

9. ENERGY EFFICIENCY
A country’s energy intensity can be explained by the structure of the economy. Since regaining independence in 1991, Estonia’s economy has shifted continuously out of heavy industry and more towards the service and commercial sectors. These sectors are less energy intensive and tend to have a different fuel mix, typically consuming more electricity and space heating, than traditional industry sectors.
Energy consumption by sector
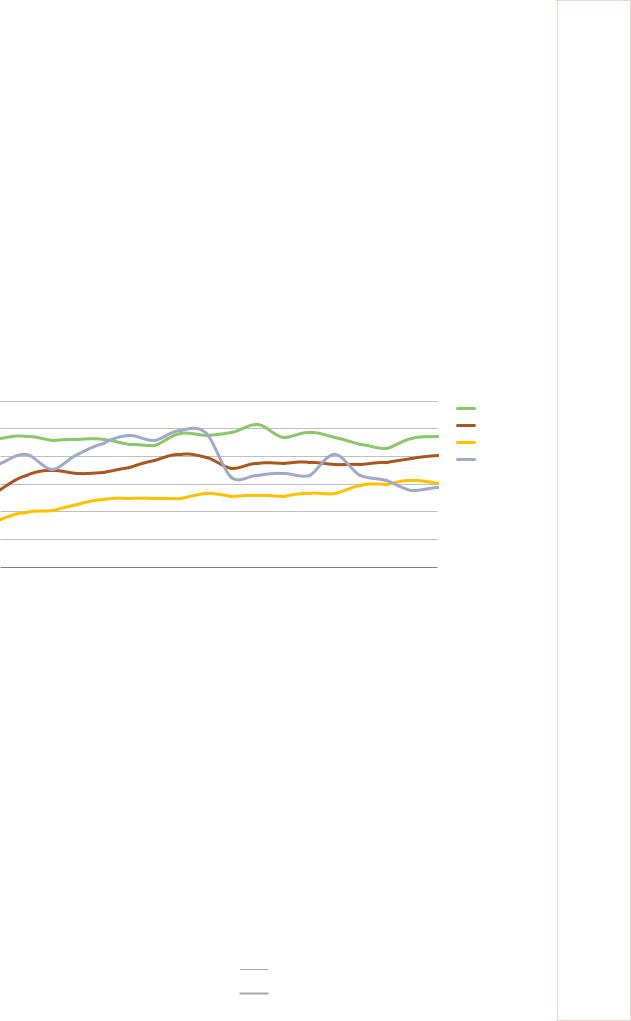
Since a decline after the financial crisis in 2008, Estonia’s TFC has been relatively stable at around 2.8-3.0 Mtoe. Energy consumption, however, has varied on a sector level (Figure 9.3). The commercial sector’s energy consumption has increased steadily while industrial consumption has declined, corresponding to a shift towards a more service sector-based economy in Estonia. Transport energy demand has also continuously been increasing, while residential sector consumption has remained relatively flat.
Figure 9.3 Final energy consumption by sector, 2000-17
1.2 |
Mtoe |
|
Residential |
||
|
||
1 |
Transport |
|
0.8 |
Commercial* |
|
Industry** |
||
0.6 |
|
|
0.4 |
|
|
0.2 |
|
0
2000 2001 2002 2003 2004 2005 2006 2007 2008 2009 2010 2011 2012 2013 2014 2015 2016 2017
IEA 2019. All rights reserved.
*Includes commercial and public services, agriculture, forestry, and fishing.
**Includes non-energy use.
Note: Mtoe = million tonnes of oil-equivalent.
Source: IEA (2019a), World Energy Balances 2019, www.iea.org/statistics.
Residential sector
The residential sector is the largest energy consumer in Estonia, with nearly one-third of TFC in 2017. Energy demand has been stable in the last decades, despite the decline in population. Weather conditions, especially winter temperatures, cause annual variations in demand; during 2000-17, energy demand varied between 0.9 Mtoe and 1.0 Mtoe (Figure 9.4).
139
ENERGY SYSTEM TRANSFORMATION
9. ENERGY EFFICIENCY
Figure 9.4 TFC in the residential sector by source, 2000-17
1.2 |
Mtoe |
|
|
|
|
|
|
|
|
|
|
|
|
|
|
|
|
Oil |
|
|
|
|
|
|
|
|
|
|
|
|
|
|
|
|
|
|
|
1 |
|
|
|
|
|
|
|
|
|
|
|
|
|
|
|
|
|
Natural gas |
0.8 |
|
|
|
|
|
|
|
|
|
|
|
|
|
|
|
|
|
Coal |
|
|
|
|
|
|
|
|
|
|
|
|
|
|
|
|
|
Bioenergy |
|
|
|
|
|
|
|
|
|
|
|
|
|
|
|
|
|
|
|
|
0.6 |
|
|
|
|
|
|
|
|
|
|
|
|
|
|
|
|
|
Electricity |
0.4 |
|
|
|
|
|
|
|
|
|
|
|
|
|
|
|
|
|
Heat |
|
|
|
|
|
|
|
|
|
|
|
|
|
|
|
|
|
|
|
0.2 |
|
|
|
|
|
|
|
|
|
|
|
|
|
|
|
|
|
|
0 |
|
|
|
|
|
|
|
|
|
|
|
|
|
|
|
|
|
|
2000 |
2001 |
2002 |
2003 |
2004 |
2005 |
2006 |
2007 |
2008 |
2009 |
2010 |
2011 |
2012 |
2013 |
2014 |
2015 |
2016 |
2017 |
|
IEA 2019. All rights reserved.
Residential energy consumption shows annual variations, but the long-term trend is stable, despite a declining population.
Note: Mtoe = million tonnes of oil-equivalent.
Source: IEA (2019a), World Energy Balances 2019, www.iea.org/statistics.
Bioenergy and district heating together account for 75% of residential energy consumption, mainly used for space and water heating. Electricity accounts for 18% of demand in the sector, consumed mostly by household appliances. Fossil fuels account for only 7% of the direct consumption (Figure 9.4). However, they also make up around half of the district heating supply and 86% of the electricity generation, which gives a total share of fossil energy of over 40%.
Industry and commercial sectors
Estonia’s economy is becoming more oriented towards services, and energy consumption in the commercial sector has steadily increased over the last decades. In 2017, the commercial sector consumed 0.61 Mtoe, a 22% increase compared to 2007 (Figure 9.5). Agriculture and forestry account for around 20% of total commercial energy demand, mostly diesel oil. The rest is consumed in public and commercial services, which mostly use electricity in appliances and district heating or natural gas for heating.
Figure 9.5 TFC in the commercial sector by source, 2000-17
0.7 |
Mtoe |
|
Oil |
||
|
||
0.6 |
Natural gas |
|
|
||
0.5 |
Coal |
|
|
||
0.4 |
Bioenergy |
|
|
||
0.3 |
Electricity |
|
|
||
0.2 |
Heat |
|
|
||
0.1 |
|
0
2000 2001 2002 2003 2004 2005 2006 2007 2008 2009 2010 2011 2012 2013 2014 2015 2016 2017
IEA 2019. All rights reserved.
The commercial sector has the fastest growing energy demand in Estonia, largely met by electricity, which accounts for nearly half of total consumption in the sector.
Notes: Mtoe = million tonnes of oil-equivalent. Includes commercial and public services, agriculture, forestry, and fishing.
Source: IEA (2019a), World Energy Balances 2019, www.iea.org/statistics.
140
9. ENERGY EFFICIENCY
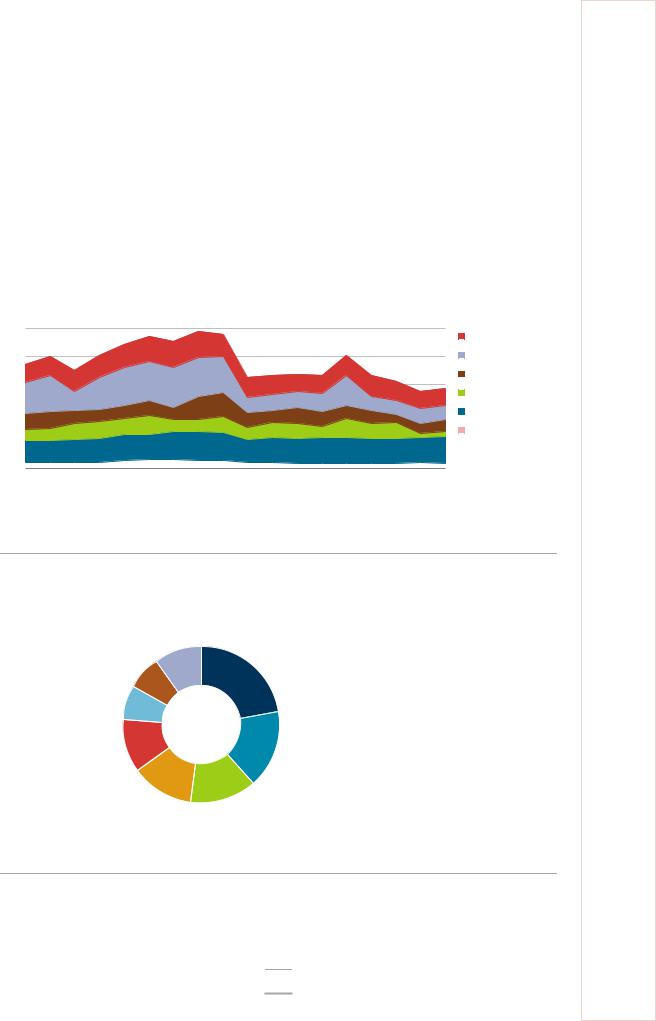
The industry sector is on the opposite trajectory, with a 42% decline in energy consumption in the last decade (Figure 9.6). Consumption fell by a third in one year after the financial crisis in 2008 and has not picked up since. In 2017, the industry sector consumed 0.58 Mtoe, or 20% of TFC. Electricity accounts for one-third of total energy use in industry, and the share has increased as consumption of other energy sources has fallen. In particular, bioenergy consumption, mainly in wood industries, has declined significantly in recent years.
Construction is the largest energy-consuming industry, with 22% of total industry consumption. This includes a large share of bitumen and lubricants used for non-energy purposes (mainly asphalt). Other large industry sectors are non-metallic minerals, food and tobacco, paper and pulp, and wood product industries (Figure 9.7).
Figure 9.6 TFC in industry by source, 2000-17
1 |
Mtoe |
|
Oil |
||
|
||
0.8 |
Natural gas |
|
0.6 |
Coal |
|
Bioenergy and waste |
||
|
||
0.4 |
Electricity |
|
0.2 |
Heat |
|
|
0  2000 2001 2002 2003 2004 2005 2006 2007 2008 2009 2010 2011 2012 2013 2014 2015 2016 2017
IEA 2019. All rights reserved.
Industrial energy consumption has not recovered from the large decline after the financial crisis, and has fallen by 42% in the last decade.
Notes: Mtoe = million tonnes of oil-equivalent. Includes non-energy consumption.
Source: IEA (2019a), World Energy Balances 2019, www.iea.org/statistics.
Figure 9.7 Energy consumption in manufacturing industry sectors, 2017
10% |
22% |
|
7% |
||
|
||
7% |
|
|
11% |
16% |
|
13% |
14% |
|
|

 Construction

 Non-metallic minerals

 Paper
Paper

 Wood and wood products

 Food and tobacco

 Machinery
 Chemical and petrochemical
 Other*
IEA 2019. All rights reserved.
Estonia has several industry sectors with similar shares of total energy consumption, but construction is the biggest when including oil products used for non-energy purposes.
*Includes consumption of bitumen and lubricants for non-energy use in construction.
**Other includes mining and quarrying, textile and leather, transport equipment, non-ferrous metals, iron and steel, and unspecified industrial consumption.
Source: IEA (2019a), World Energy Balances 2019, www.iea.org/statistics.
141
ENERGY SYSTEM TRANSFORMATION