
- •Foreword
- •Table of contents
- •1. Executive summary
- •Overview
- •Energy sector transformation
- •Taxation
- •Energy market reform
- •Energy security and regional integration
- •Key recommendations
- •2. General energy policy
- •Country overview
- •Energy supply and demand
- •Energy production and self-sufficiency
- •Energy consumption
- •Key institutions
- •Policy and targets
- •Energy sector transformation and independence
- •Taxation
- •Assessment
- •Recommendations
- •3. Oil shale
- •Overview
- •Supply and demand
- •Policy and regulatory framework
- •Industry structure
- •Environmental impact from oil shale production and use
- •Future of oil shale
- •Assessment
- •Recommendations
- •Overview
- •Supply and demand
- •Oil production
- •Trade: Imports and exports
- •Shale oil
- •Oil products
- •Oil demand
- •Market structure
- •Prices and taxes
- •Upstream – Oil shale liquefaction
- •Infrastructure
- •Refining
- •Ports and road network
- •Storage
- •Emergency response policy
- •Oil emergency reserves
- •Assessment
- •Oil markets
- •Oil security
- •Recommendations
- •5. Electricity
- •Overview
- •Supply and demand
- •Electricity generation
- •Imports and exports
- •Electricity consumption
- •Electricity prices and taxes
- •Market structure
- •Wholesale and distribution market
- •Interconnections
- •Synchronisation with continental Europe
- •Network balancing
- •Electricity security
- •Generation adequacy
- •Reliability of electricity supplies
- •Assessment
- •Security of supply
- •Recommendations
- •6. Natural gas
- •Overview
- •Supply and demand
- •Consumption of natural gas
- •Trade
- •Production of biomethane
- •Market structure
- •Unbundling of the gas network
- •Wholesale
- •Retail
- •Price and tariffs
- •Financial support for biomethane
- •Infrastructure
- •Gas network
- •Recent changes in network
- •LNG terminal
- •Storage
- •Infrastructure developments
- •Biomethane infrastructure
- •Regional network interconnections
- •Gas emergency response
- •Gas emergency policy and organisation
- •Network resilience
- •Emergency response measures
- •Assessment
- •Recommendations
- •7. Energy, environment and climate change
- •Overview
- •Energy-related CO2 emissions and carbon intensity
- •Climate policy framework
- •The EU climate framework
- •Domestic climate policies
- •Policies to reduce emissions from the electricity sector
- •Policies to reduce emissions from the transport sector
- •Improving the energy efficiency of the vehicle fleet
- •Alternative fuels and technologies
- •Public transport and mode shifting
- •Taxation
- •Assessment
- •Recommendations
- •8. Renewable energy
- •Overview
- •Renewable energy supply and consumption
- •Renewable energy in total primary energy supply
- •Renewable electricity generation
- •Renewables in heat production
- •Renewables in transport
- •Targets, policy and regulation
- •Measures supporting renewable electricity
- •Wind
- •Solar
- •Hydropower
- •System integration of renewables
- •Bioenergy
- •Measures supporting renewable heat
- •Measures supporting renewables in transport
- •Assessment
- •Recommendations
- •9. Energy efficiency
- •Overview
- •Energy consumption by sector
- •Residential sector
- •Industry and commercial sectors
- •Transport
- •Energy efficiency policy framework and targets
- •Targets for 2020 and 2030
- •Energy efficiency in buildings
- •Residential building sector
- •Public sector buildings
- •Support measures
- •District heating
- •District heating market and regulation
- •District heating energy efficiency potential and barriers
- •Industry
- •Transport
- •Assessment
- •Buildings and demand for heating and cooling
- •District heating
- •Industry
- •Challenges
- •Recommendations
- •10. Energy technology research, development and demonstration
- •Overview
- •Public spending on energy RD&D
- •General RD&D strategy and organisational structure
- •Energy RD&D priorities, funding and implementation
- •Industry collaboration
- •International collaboration
- •IEA technology collaboration programmes
- •Other engagements
- •Horizon 2020
- •Baltic collaboration
- •Nordic-Baltic Memorandum of Understanding (MOU) on Energy Research Programme
- •Monitoring and evaluation
- •Assessment
- •Recommendations
- •ANNEX A: Institutions and organisations with energy sector responsibilities
- •ANNEX B: Organisations visited
- •Review criteria
- •Review team
- •IEA member countries
- •International Energy Agency
- •Organisations visited
- •ANNEX C: Energy balances and key statistical data
- •ANNEX D: International Energy Agency “Shared Goals”
- •ANNEX E: List of abbreviations
- •Acronyms and abbreviations
- •Units of measure

8. RENEWABLE ENERGY
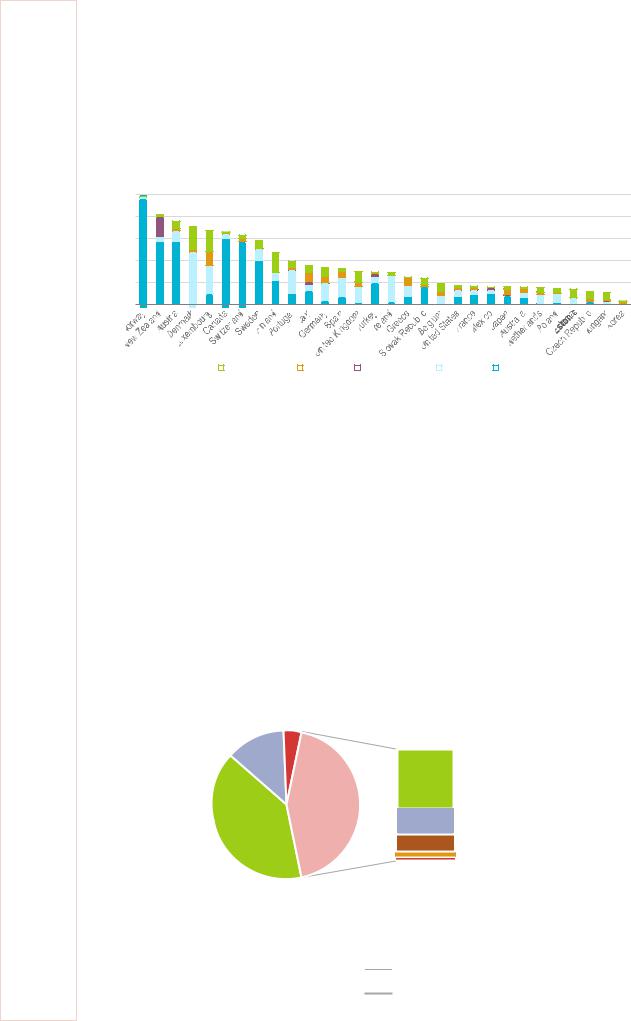
In 2017, Estonia’s share of renewables in electricity ranked 27th among IEA countries (Figure 8.7). The experiences of other IEA countries can offer insights on the pathways to achieving the 50% share of renewable electricity laid out in the National Development Plan of the Energy Sector until 2030 (NDPS 2030), (MEAC, 2017a).
Figure 8.7 Share of renewables in electricity generation in IEA countries, 2017
100% |
80% |
60% |
40% |
20% |
0% |
|
Bioenergy* |
|
Solar |
|
Geothermal |
|
Wind |
|
Hydro** |
|
|
|
|
|
|||||
|
|
|
|
|
IEA 2019. All rights reserved.
*Bioenergy includes solid biofuels, renewable waste, liquid biofuels and biogases.
**Hydro includes hydro power (excluding pumped storage), and tidal, wave and ocean energy. Source: IEA (2019), World Energy Balances 2019, www.iea.org/statistics.
Renewables in heat production
In 2017, renewable energy covered 51.6% of Estonia’s heat consumption, with over 95% coming from bioenergy and 4.6% covered by heat pumps using renewable energy (Eurostat, 2018). The 2017 share of renewables in heat exceeded Estonia’s 2020 target of 38.4%, but significant progress is still needed to reach the 2030 target of 80% renewables in heat consumption.
Figure 8.8 shows the breakdown by type of fuel in heat consumption in the residential and commercial sectors (excluding heat from electricity), where bioenergy covered 63% (23% from use of biomass in district heating systems plus 40% from direct use of biomass is smaller systems outside of district heating networks).
Figure 8.8 Residential and commercial heat consumption by fuel, 2017
|
13% |
4% |
|
|
|
|
|
|
|
|
23% |
|
|
District heat |
|
|
|
43% |
10% |
40% |
|
|
|
|
|
7% |
|
|
|
|
|
|
|
|
2% |
|
|
|
1% |
Natural gas
Oil
Bioenergy
Natural gas
Coal/oil shale
Waste
Other fossil fuels
IEA 2019. All rights reserved.
Note: Excludes heat from electricity.
Source: IEA (2019), World Energy Balances 2019, www.iea.org/statistics.
118