
- •Foreword
- •Table of contents
- •1. Executive summary
- •Overview
- •Energy sector transformation
- •Taxation
- •Energy market reform
- •Energy security and regional integration
- •Key recommendations
- •2. General energy policy
- •Country overview
- •Energy supply and demand
- •Energy production and self-sufficiency
- •Energy consumption
- •Key institutions
- •Policy and targets
- •Energy sector transformation and independence
- •Taxation
- •Assessment
- •Recommendations
- •3. Oil shale
- •Overview
- •Supply and demand
- •Policy and regulatory framework
- •Industry structure
- •Environmental impact from oil shale production and use
- •Future of oil shale
- •Assessment
- •Recommendations
- •Overview
- •Supply and demand
- •Oil production
- •Trade: Imports and exports
- •Shale oil
- •Oil products
- •Oil demand
- •Market structure
- •Prices and taxes
- •Upstream – Oil shale liquefaction
- •Infrastructure
- •Refining
- •Ports and road network
- •Storage
- •Emergency response policy
- •Oil emergency reserves
- •Assessment
- •Oil markets
- •Oil security
- •Recommendations
- •5. Electricity
- •Overview
- •Supply and demand
- •Electricity generation
- •Imports and exports
- •Electricity consumption
- •Electricity prices and taxes
- •Market structure
- •Wholesale and distribution market
- •Interconnections
- •Synchronisation with continental Europe
- •Network balancing
- •Electricity security
- •Generation adequacy
- •Reliability of electricity supplies
- •Assessment
- •Security of supply
- •Recommendations
- •6. Natural gas
- •Overview
- •Supply and demand
- •Consumption of natural gas
- •Trade
- •Production of biomethane
- •Market structure
- •Unbundling of the gas network
- •Wholesale
- •Retail
- •Price and tariffs
- •Financial support for biomethane
- •Infrastructure
- •Gas network
- •Recent changes in network
- •LNG terminal
- •Storage
- •Infrastructure developments
- •Biomethane infrastructure
- •Regional network interconnections
- •Gas emergency response
- •Gas emergency policy and organisation
- •Network resilience
- •Emergency response measures
- •Assessment
- •Recommendations
- •7. Energy, environment and climate change
- •Overview
- •Energy-related CO2 emissions and carbon intensity
- •Climate policy framework
- •The EU climate framework
- •Domestic climate policies
- •Policies to reduce emissions from the electricity sector
- •Policies to reduce emissions from the transport sector
- •Improving the energy efficiency of the vehicle fleet
- •Alternative fuels and technologies
- •Public transport and mode shifting
- •Taxation
- •Assessment
- •Recommendations
- •8. Renewable energy
- •Overview
- •Renewable energy supply and consumption
- •Renewable energy in total primary energy supply
- •Renewable electricity generation
- •Renewables in heat production
- •Renewables in transport
- •Targets, policy and regulation
- •Measures supporting renewable electricity
- •Wind
- •Solar
- •Hydropower
- •System integration of renewables
- •Bioenergy
- •Measures supporting renewable heat
- •Measures supporting renewables in transport
- •Assessment
- •Recommendations
- •9. Energy efficiency
- •Overview
- •Energy consumption by sector
- •Residential sector
- •Industry and commercial sectors
- •Transport
- •Energy efficiency policy framework and targets
- •Targets for 2020 and 2030
- •Energy efficiency in buildings
- •Residential building sector
- •Public sector buildings
- •Support measures
- •District heating
- •District heating market and regulation
- •District heating energy efficiency potential and barriers
- •Industry
- •Transport
- •Assessment
- •Buildings and demand for heating and cooling
- •District heating
- •Industry
- •Challenges
- •Recommendations
- •10. Energy technology research, development and demonstration
- •Overview
- •Public spending on energy RD&D
- •General RD&D strategy and organisational structure
- •Energy RD&D priorities, funding and implementation
- •Industry collaboration
- •International collaboration
- •IEA technology collaboration programmes
- •Other engagements
- •Horizon 2020
- •Baltic collaboration
- •Nordic-Baltic Memorandum of Understanding (MOU) on Energy Research Programme
- •Monitoring and evaluation
- •Assessment
- •Recommendations
- •ANNEX A: Institutions and organisations with energy sector responsibilities
- •ANNEX B: Organisations visited
- •Review criteria
- •Review team
- •IEA member countries
- •International Energy Agency
- •Organisations visited
- •ANNEX C: Energy balances and key statistical data
- •ANNEX D: International Energy Agency “Shared Goals”
- •ANNEX E: List of abbreviations
- •Acronyms and abbreviations
- •Units of measure

6. NATURAL GAS
with Gazprom at the end of 2015, Eesti Gaas AS entered into a new three-year contract with Gazprom in March 2016. Eesti Gaas AS remains the biggest wholesaler on the market (with a wholesale market share of 67.4% in 2017), followed by Eesti Energia AS (11%), and the remaining market share spread over four other companies, each with less than 10% (Baltic Energy Partners OÜ, Scener OÜ, Alexela Energia AS and 220 Energia OÜ) (Competition Authority, 2018).
Retail
With new gas importers entering the market, the dominance of Eesti Gaas AS in the retail sector has decreased. Gaasivõrgud AS, a subsidiary of Eesti Gaas, has the biggest market share and uses the 1 486 km long distribution network owned by Eesti Gaas under a commercial lease contract. In 2017, 27 companies were active on the Estonian retail gas market, compared to 23 the previous year. Eesti Gaas remains the dominant supplier in the retail sector, with 55% of the market in 2017. However, this is substantially lower than before, and compares to 93% in 2016 (Competition Authority, 2018). To promote further market competition, the obligatory supply licence was replaced with a simple registration as a supplier in mid-2017.
Price and tariffs
The Estonian Competition Authority is responsible for network tariffs and methodologies for calculating connection fees, which it approves in accordance with the Natural Gas Act. Eesti Gaas AS, as the predominant market player, must get approval from the Competition Authority on the sales margin to be included in the price of gas sold to household consumers. Other gas sellers add the approved sales margin to the import price of gas. The Competition Authority verifies annually that the weighted average price of gas sold in a calendar year does not exceed the weighted average purchase price in the same period, otherwise the company must settle the balance with its customers.
Pursuant to the Natural Gas Act, household consumers must be notified 30 days in advance of any change in price. The retail sale prices of the gas sold to final consumers are disclosed on the gas suppliers’ websites. Consumers can then decide whether they wish to switch gas suppliers. The price of natural gas was responsible for 68% of the total gas bill for the household consumer in 2017 (Competition Authority, 2018).
The continuous fall in gas demand is driving down the price of gas in Estonia. Estonia’s gas price for industry dropped significantly between 2013 and 2018, from USD 47.2/MWh to USD 36.9/MWh, despite a sharp increase in the tax rate (from 3% to 15%; see Figure 6.4). In the IEA comparison, Estonia is now a little closer to the IEA median, from the 11th lowest to the 14th lowest.
86

6. NATURAL GAS
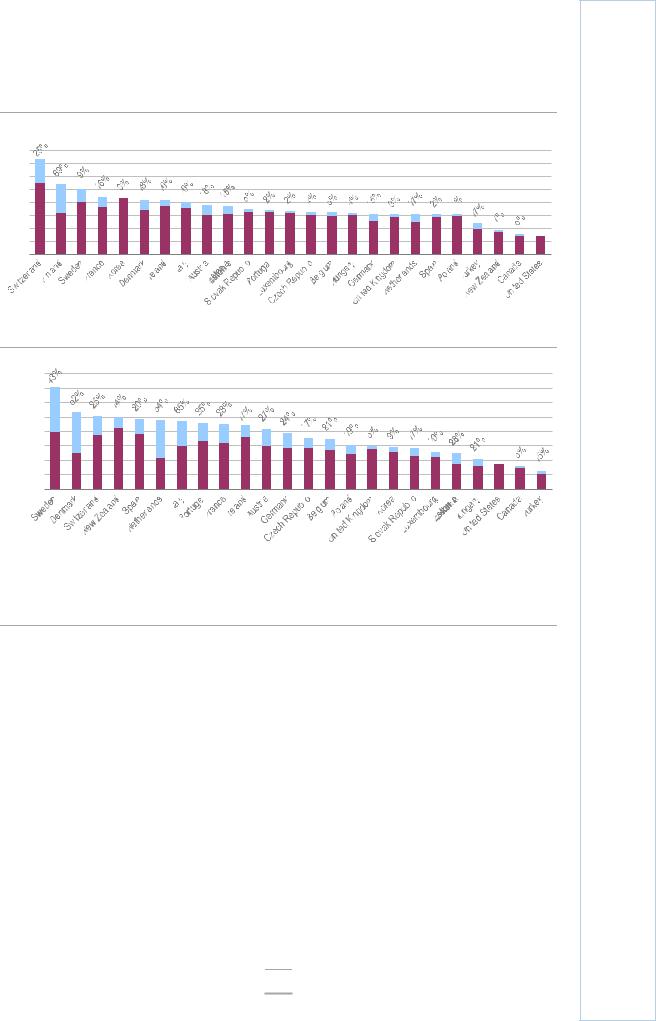
Figure 6.4 Natural gas prices in IEA member countries, 2018
Industry
USD/MWh |
|
Tax component |
|
||
|
80
70
60
50
40
30
20
10
0
Households
USD/MWh
160
140
120
100
80
60
40
20
0
Tax component
IEA 2019. All rights reserved.
In the IEA comparison, Estonia’s industry gas price stands close to the median while the household gas price is relatively low.
Notes: MWh = megawatt hour. Tax information is not available for the United States. Data not avabilable for Australia, Finland (households), Greece, Japan, Mexico and Norway.
Source: IEA (2019c), Energy Prices and Taxes 2019, www.iea.org/statistics.
Over the same period, the gas price for households fell by 27%, to USD 48.7/MWh. Unlike the industry gas price, there was only a small increase in the tax rate, from 21% to 28%, as it was from a higher basis. Estonia still has one of the lowest gas prices for households among European IEA member countries.
Financial support for biomethane
In 2018, the government set up a scheme to provide financial support for domestic biomethane production (see Chapters 7 and 8). Under the scheme, companies may request state subsidies for their biomethane production by submitting applications on a rolling basis from 2018 to 30 November 2020. Elering, the state-owned TSO, manages the direct payment of the subsidies based on the level of production and consumption. For its first year 2018, the government allocated around EUR 4 million for the scheme, including promoting the usage of biomethane in public transport, with an objective of making biomethane more price-competitive against other liquid fuels. As of April 2018,
87
ENERGY SECURITY