
- •Foreword
- •Table of contents
- •1. Executive summary
- •Overview
- •Energy sector transformation
- •Taxation
- •Energy market reform
- •Energy security and regional integration
- •Key recommendations
- •2. General energy policy
- •Country overview
- •Energy supply and demand
- •Energy production and self-sufficiency
- •Energy consumption
- •Key institutions
- •Policy and targets
- •Energy sector transformation and independence
- •Taxation
- •Assessment
- •Recommendations
- •3. Oil shale
- •Overview
- •Supply and demand
- •Policy and regulatory framework
- •Industry structure
- •Environmental impact from oil shale production and use
- •Future of oil shale
- •Assessment
- •Recommendations
- •Overview
- •Supply and demand
- •Oil production
- •Trade: Imports and exports
- •Shale oil
- •Oil products
- •Oil demand
- •Market structure
- •Prices and taxes
- •Upstream – Oil shale liquefaction
- •Infrastructure
- •Refining
- •Ports and road network
- •Storage
- •Emergency response policy
- •Oil emergency reserves
- •Assessment
- •Oil markets
- •Oil security
- •Recommendations
- •5. Electricity
- •Overview
- •Supply and demand
- •Electricity generation
- •Imports and exports
- •Electricity consumption
- •Electricity prices and taxes
- •Market structure
- •Wholesale and distribution market
- •Interconnections
- •Synchronisation with continental Europe
- •Network balancing
- •Electricity security
- •Generation adequacy
- •Reliability of electricity supplies
- •Assessment
- •Security of supply
- •Recommendations
- •6. Natural gas
- •Overview
- •Supply and demand
- •Consumption of natural gas
- •Trade
- •Production of biomethane
- •Market structure
- •Unbundling of the gas network
- •Wholesale
- •Retail
- •Price and tariffs
- •Financial support for biomethane
- •Infrastructure
- •Gas network
- •Recent changes in network
- •LNG terminal
- •Storage
- •Infrastructure developments
- •Biomethane infrastructure
- •Regional network interconnections
- •Gas emergency response
- •Gas emergency policy and organisation
- •Network resilience
- •Emergency response measures
- •Assessment
- •Recommendations
- •7. Energy, environment and climate change
- •Overview
- •Energy-related CO2 emissions and carbon intensity
- •Climate policy framework
- •The EU climate framework
- •Domestic climate policies
- •Policies to reduce emissions from the electricity sector
- •Policies to reduce emissions from the transport sector
- •Improving the energy efficiency of the vehicle fleet
- •Alternative fuels and technologies
- •Public transport and mode shifting
- •Taxation
- •Assessment
- •Recommendations
- •8. Renewable energy
- •Overview
- •Renewable energy supply and consumption
- •Renewable energy in total primary energy supply
- •Renewable electricity generation
- •Renewables in heat production
- •Renewables in transport
- •Targets, policy and regulation
- •Measures supporting renewable electricity
- •Wind
- •Solar
- •Hydropower
- •System integration of renewables
- •Bioenergy
- •Measures supporting renewable heat
- •Measures supporting renewables in transport
- •Assessment
- •Recommendations
- •9. Energy efficiency
- •Overview
- •Energy consumption by sector
- •Residential sector
- •Industry and commercial sectors
- •Transport
- •Energy efficiency policy framework and targets
- •Targets for 2020 and 2030
- •Energy efficiency in buildings
- •Residential building sector
- •Public sector buildings
- •Support measures
- •District heating
- •District heating market and regulation
- •District heating energy efficiency potential and barriers
- •Industry
- •Transport
- •Assessment
- •Buildings and demand for heating and cooling
- •District heating
- •Industry
- •Challenges
- •Recommendations
- •10. Energy technology research, development and demonstration
- •Overview
- •Public spending on energy RD&D
- •General RD&D strategy and organisational structure
- •Energy RD&D priorities, funding and implementation
- •Industry collaboration
- •International collaboration
- •IEA technology collaboration programmes
- •Other engagements
- •Horizon 2020
- •Baltic collaboration
- •Nordic-Baltic Memorandum of Understanding (MOU) on Energy Research Programme
- •Monitoring and evaluation
- •Assessment
- •Recommendations
- •ANNEX A: Institutions and organisations with energy sector responsibilities
- •ANNEX B: Organisations visited
- •Review criteria
- •Review team
- •IEA member countries
- •International Energy Agency
- •Organisations visited
- •ANNEX C: Energy balances and key statistical data
- •ANNEX D: International Energy Agency “Shared Goals”
- •ANNEX E: List of abbreviations
- •Acronyms and abbreviations
- •Units of measure

6. NATURAL GAS
demand growth for gas in the transport sector. The ten-year development plan of Estonia’s transmission system operator (TSO), Elering1, projects overall gas demand to decline to 0.47 bcm by 2027 (Competition Authority, 2018).
Trade
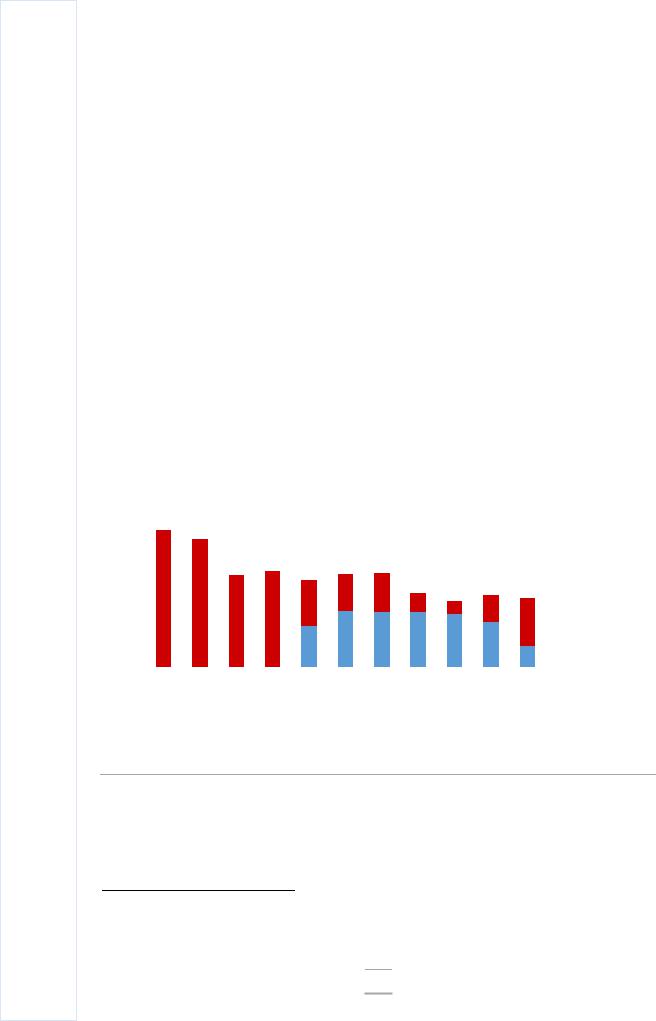
In 2017, Estonia’s total gas imports were 0.49 bcm (Figure 6.3). In line with the declining gas demand in the country, the volume of gas imports has fallen by 51% over the last decade.
Prior to 2014, only gas imports of Russian origin were possible, either directly imported from Russia or from the Inčukalns gas storage facility in Latvia. Estonia’s connection with the Klaipeda LNG terminal in Lithuania, commissioned in 2014, has made it possible for Estonia to develop more diversified import sources. However, gas from Lithuania is purchased on the gas exchange GET Baltic, and as deliveries from this exchange come either from Klaipeda LNG or from Russian gas delivered to Lithuania, gas imports via this route do not necessarily indicate diversification from Russian gas. Thus, while 31% of Estonia’s 2017 gas imports came through the connection with Latvia, including 12% from Lithuania, the predominant share of Estonia’s gas imports are still of Russian origin (Competition Authority, 2018).
Figure 6.3 Estonia’s natural gas imports by entry point, 2007-17
1.2 |
bcm |
|
|
|
|
|
|
|
|
|
|
|
|
|
|
|
|
|
|
|
|
|
|
|
|
|
|
|
|
|
|
|
|
|
||
|
|
|
|
|
|
|
|
|
|
|
|
|
|
|
|
|
|
|
|
|
|
|
|
|
|
|
|
|
|
|
|
|
|
|
|
|
|
|
|
|
|
|
|
|
|
|
|
|
|
|
|
|
|
|
|
|
|
|
|
|
|
|
|
|
|
|
|
|
|
|
|
|
|
1.0 |
|
|
|
|
|
|
|
|
|
|
|
|
|
|
|
|
|
|
|
|
|
|
|
|
|
|
|
|
|
|
|
|
|
|
|
Latvia |
|
|
|
|
|
|
|
|
|
|
|
|
|
|
|
|
|
|
|
|
|
|
|
|
|
|
|
|
|
|
|
|
|
|
|
||
0.8 |
|
|
|
|
|
|
|
|
|
|
|
|
|
|
|
|
|
|
|
|
|
|
|
|
|
|
|
|
|
|
|
|
|
|
|
|
|
|
|
|
|
|
|
|
|
|
|
|
|
|
|
|
|
|
|
|
|
|
|
|
|
|
|
|
|
|
|
|
|
|
|
||
|
|
|
|
|
|
|
|
|
|
|
|
|
|
|
|
|
|
|
|
|
|
|
|
|
|
|
|
|
|
|
|
|
||||
|
|
|
|
|
|
|
|
|
|
|
|
|
|
|
|
|
|
|
|
|
|
|
|
|
|
|
|
|
|
|
|
|
|
|
||
0.6 |
|
|
|
|
|
|
|
|
|
|
|
|
|
|
|
|
|
|
|
|
|
|
|
|
|
|
|
|
|
|
|
|
|
|
|
|
|
|
|
|
|
|
|
|
|
|
|
|
|
|
|
|
|
|
|
|
|
|
|
|
|
|
|
|
|
|
|
|
|
|
|
|
|
0.4 |
|
|
|
|
|
|
|
|
|
|
|
|
|
|
|
|
|
|
|
|
|
|
|
|
|
|
|
|
|
|
|
|
|
|
|
Russian |
|
|
|
|
|
|
|
|
|
|
|
|
|
|
|
|
|
|
|
|
|
|
|
|
|
|
|
|
|
|
|
|
|
|
|
||
|
|
|
|
|
|
|
|
|
|
|
|
|
|
|
|
|
|
|
|
|
|
|
|
|
|
|
|
|
|
|
|
|
|
|
|
|
|
|
|
|
|
|
|
|
|
|
|
|
|
|
|
|
|
|
|
|
|
|
|
|
|
|
|
|
|
|
|
|
|
|
|
|
|
0.2 |
|
|
|
|
|
|
|
|
|
|
|
|
|
|
|
|
|
|
|
|
|
|
|
|
|
|
|
|
|
|
|
|
|
|
|
Federation |
|
|
|
|
|
|
|
|
|
|
|
|
|
|
|
|
|
|
|
|
|
|
|
|
|
|
|
|
|
|
|
|
|
|
|
|
|
0.0 |
|
|
|
|
|
|
|
|
|
|
|
|
|
|
|
|
|
|
|
|
|
|
|
|
|
|
|
|
|
|
|
|
|
|
|
|
|
|
|
|
|
|
|
|
|
|
|
|
|
|
|
|
|
|
|
|
|
|
|
|
|
|
|
|
|
|
|
|
|
|
|
|
|
2007 |
2008 |
2009 |
2010 |
2011 |
2012 |
2013 |
2014 |
2015 |
2016 |
2017 |
|
|
|
IEA 2019. All rights reserved.
Estonia’s gas imports are predominately of Russian origin, either imported directly or through the interconnection with Latvia.
Source: IEA (2019b), Natural Gas Information 2019, www.iea.org/statistics.
Production of biomethane
Estonia has no domestic production of natural gas. However, the government has been supporting indigenous production of biomethane to promote both the security of natural
1 Annex A provides more detailed information about institutions and organisations with responsibilities related to the energy sector.
84