


7. ELECTRICITY
are needed to remove barriers to investment and maintain momentum, notably for distributed generation, such as solar photovoltaic (PV).
India has reached “one nation one grid” as it has synchronised its regional grids into one national grid at one frequency, but its markets remain fragmented, notably at the retail level, but also in wholesale trading. Structural reforms are under discussion to foster the creation of a wholesale market place for trading of power across India, including least-cost dispatch of electricity. The GoI is now tackling these structural concerns. In the context of surplus power, opportunities abound to carry out reforms to incorporate best practices from around the world. These particularly relate to the governance of power markets and systems to build a joint vison and enhance the role and collaboration of system and grid operators. India has built an institutional framework capable of providing the required investment. Reforms to this framework would allow greater economic efficiency, notably to boost cost-effective dispatch and balancing at the intrastate level, increase cross-border transmission capacity available for trades and better utilise existing assets. Today around 90% of trading is done through bilateral long-term contracts. This prevents efficient price discovery in the market, and leads to stressed assets and renewable energy curtailment.
Governance challenges at the interface between open markets and regulated services currently limit the opportunities for economic efficiency and consumer benefits. Structural market reforms are needed to further improve the financial stability, reliability and efficiency of electricity distribution. Reliable electricity supply to consumers can be fostered by introducing power quality norms, metering and billing, and moving towards cost-reflective and market-based tariffs.
Supply and demand trends
India’s electricity demand has been increasing across most sectors, at an average annual rate of 7% during 2007-17. The largest consumption stems from the industrial and commercial sectors, although residential electricity demand is leading electricity demand growth.
Figure 7.1 Electricity overview – power generation by source, 2017
3% |
2% 2% 2% |
|
|
|
|
|
|
3% |
|
|
Coal |
|
|
||
|
|
||
5% |
|
|
Hydro |
|
|
||
|
|
||
|
|
Natural gas |
|
9% |
|
|
|
|
|
||
|
|
Wind |
|
|
|
||
|
|
||
|
|
|
Biofuels and waste |
|
|
|
|
|
|
|
|
|
74% |
|
Nuclear |
|
|
||
|
|
||
|
|
Solar |
|
|
|
||
|
|

 Oil
Oil
IEA 2019.
All rights reserved.
Coal accounts for three-quarters of India’s electricity generation, which is consumed mostly in the industrial, commercial and residential sectors.
Notes: Bioenergy data are estimated by the IEA.
Source: IEA (2019a), World Energy Balances 2019, www.iea.org/statistics/.
152
IEA. All rights reserved.

7. ELECTRICITY
Most of the demand growth has been met by coal power generation, which accounted for nearly three-quarters of total electricity generation in 2017 (Figure 7.1), but also renewable power, in particular wind and solar, which increased rapidly supported by ambitious targets and policy measures.
Electricity generation
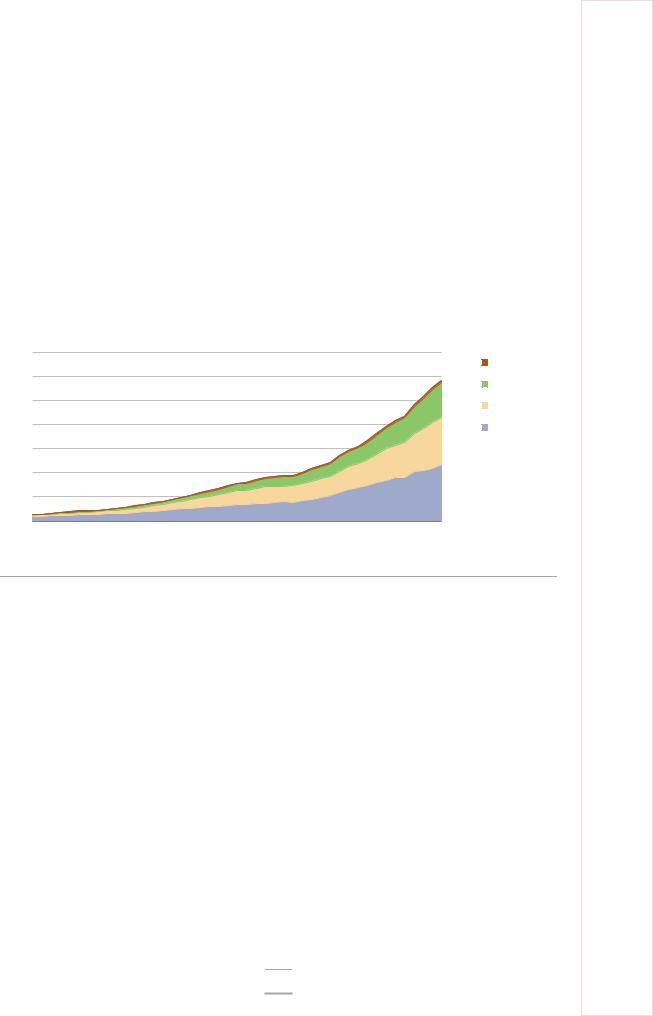
India’s electricity generation has increased exponentially in the last decade, with an average annual growth rate of 6%. In 2017 total generation was 1 532 TWh, an increase by 86% since 2007 (Figure 7.2).
Coal power has met over 80% of this growth in electricity generation. Its share of total electricity generation has increased from 65% in 2007 to 74% in 2017. In 2017 gas power accounted for less than 5% of total electricity generation, down from over 10% a decade earlier. Hydropower is the second-largest power source in India, with 9% of total generation in 2017, down from 16% in 2007. Power generation from other renewables (wind, solar, and bioenergy and waste) accounted for 8% of total generation in 2017 (see further in Chapter 5 on renewable energy).Nuclear power is also increasing, but at a much slower pace than coal and renewables. In 2017 nuclear power accounted for below 3% of total electricity generation, but there are plans to increase its capacity in India.
Figure 7.2 Electricity generation by source, 1973-2017
1 600 |
TWh |
|
|
|
|
|
|
|
|
|
|
|
|
|
|
|
|
|
|
|
|
|
|
|
|
|
Oil |
||
1 400 |
|
|
|
|
|
|
|
|
|
|
|
|
||
|
|
|
|
|
|
|
|
|
|
|
|
Natural gas |
||
1 200 |
|
|
|
|
|
|
|
|
|
|
|
|
||
|
|
|
|
|
|
|
|
|
|
|
|
Coal |
||
1 000 |
|
|
|
|
|
|
|
|
|
|
|
|
||
|
|
|
|
|
|
|
|
|
|
|
|
Bioenergy and waste |
||
800 |
|
|
|
|
|
|
|
|
|
|
|
|
||
|
|
|
|
|
|
|
|
|
|
|
|
Nuclear |
||
600 |
|
|
|
|
|
|
|
|
|
|
|
|
||
|
|
|
|
|
|
|
|
|
|
|
|
Hydro |
||
400 |
|
|
|
|
|
|
|
|
|
|
|
|
||
|
|
|
|
|
|
|
|
|
|
|
|
Wind |
||
200 |
|
|
|
|
|
|
|
|
|
|
|
|
||
|
|
|
|
|
|
|
|
|
|
|
|
Solar |
||
|
|
|
|
|
|
|
|
|
|
|
|
|
||
0 |
|
|
|
|
|
|
|
|
|
|
|
|
IEA 2019. |
|
1973 |
1977 |
1981 |
1985 |
1989 |
1993 |
1997 |
2001 |
2005 |
2009 |
2013 |
2017 |
|||
All rights reserved. |
||||||||||||||
Electricity generation has increased by 91% in a decade, mainly from coal power.
Notes: Bioenergy data are estimated by the IEA.
Source: IEA (2019a), World Energy Balances 2019, www.iea.org/statistics/.
The picture is different when looking at installed capacity (see Table 7.1): capacity has grown from 134 GW in 2008 to 248 GW in 2013 and 365 GW in 2019 (preliminary data), which has resulted in a good capacity margin over peak demand.
India’s installed generation capacity is composed of
365 GW, coal (55.8%), hydro (13.7%), wind (10.1%), solar PV (8.8%), natural gas (6.8%), bioenergy and waste (2.7%), nuclear (2%) and oil (0.1%)
Solar installed capacity in India has increased rapidly from 2.63 GW in 2013 to 32.5 GW in 2019. While the share of renewables (wind, solar and bioenergy) was around 8% of generation in 2017, these sources made up around 21.8% of the installed capacity in 2017 (see Table 7.1).
153
ENERGY SECURITY
IEA. All rights reserved.

7. ELECTRICITY
The largest power markets within India are the states of Maharashtra, Uttar Pradesh, Madhya Pradesh, Chhattisgarh, Gujarat, Tamil Nadu, West Bengal, Andra Pradesh, Rajasthan and Karnataka (Figure 7.3).
Table 7.1 Evolution of installed capacity by fuel, 2013-18 (MW)
Fuel category |
2013 |
2014 |
2015 |
2016 |
2017 |
2018 |
2019**** |
|
|
|
|
|
|
|
|
Coal* |
145 273 |
164 636 |
185 173 |
192 163 |
197 171 |
200 704 |
204 224 |
|
|
|
|
|
|
|
|
Gas |
21 782 |
23 062 |
24 509 |
25 329 |
24 897 |
24 937 |
24 937 |
|
|
|
|
|
|
|
|
Diesel |
1 199 |
1 199 |
993 |
838 |
838 |
638 |
510 |
|
|
|
|
|
|
|
|
Nuclear |
4 780 |
5 780 |
5 780 |
6 780 |
6 780 |
6 780 |
6 780 |
|
|
|
|
|
|
|
|
Hydro** |
44 335 |
45 323 |
47 057 |
48 858 |
49 779 |
49 992 |
50 047 |
|
|
|
|
|
|
|
|
Wind |
21 043 |
23 354 |
26 777 |
32 280 |
34 046 |
35 626 |
37 279 |
|
|
|
|
|
|
|
|
Solar |
2 632 |
3 744 |
6 763 |
12 289 |
21 651 |
28 181 |
32 578 |
|
|
|
|
|
|
|
|
Biomass*** |
7 510 |
7 805 |
8 110 |
8 296 |
8 839 |
9 242 |
9 946 |
|
|
|
|
|
|
|
|
Total |
248 554 |
274 903 |
305 162 |
326 833 |
344 001 |
356 100 |
365 891 |
*Includes lignite.
**Includes small hydropower.
***Includes biomass power/co-generation and energy-from-waste.
**** Preliminary data based on 30/11/2019
Source: CEA (2019a), All India Installed Capacity, www.cea.nic.in/reports/monthly/installedcapacity.
Figure 7.3 Electricity generation by state, 2018
140 TWh
120
100
80
60
40
20
0
IEA 2019. All rights reserved.
*Other includes Sikkim, Tripura, Kerala, Assam, Bhutan, Meghalaya, Arunachal Pradesh, Manipur, Nagaland, Mizoram and Goa.
Source: CEA (2019b), All India Electricity Generation; https://npp.gov.in/publishedReports
Imports and exports
In 2017 India became a net exporter of electricity after having been a net importer for several decades. The country has increased international power trade with neighbouring countries in Southeast Asia: in 2018 India exported power to Bangladesh, Myanmar and Nepal and imported power from Bhutan. India has developed new interconnections with Nepal and Bangladesh in recent years, as part of a greater regional integration move
154
IEA. All rights reserved.
7. ELECTRICITY
across South Asia. India plans to buy surplus hydropower from Bhutan and is putting in place investment and concessional finance to build hydropower in Bhutan and also in the Northern Indian territories.
Consumption
The industrial and service sectors are the largest users of electricity in India, accounting for 74% of total final consumption (TFC) together, roughly half each (Figure 7.4). Iron and steel, chemicals and petrochemicals, and textiles and leather are the industries with the highest electricity consumption (although nearly half of all industrial electricity consumption is not specified by sector). The service sector includes agriculture (demand for water pumping) and forestry, which account for half of the sector’s demand. The residential sector is the third-largest electricity consumer, at 25% of total demand. The remaining consumption is used for rail transport.
Figure 7.4 Electricity TFC by sector, 1973-2017
1400 TWh |
|
|
|
|
|
|
|
|
|
|
|
Transport |
|
1200 |
|
|
|
|
|
|
|
|
|
|
|
||
|
|
|
|
|
|
|
|
|
|
|
Residential |
||
|
|
|
|
|
|
|
|
|
|
|
|
||
1000 |
|
|
|
|
|
|
|
|
|
|
|
Services/other* |
|
|
|
|
|
|
|
|
|
|
|
|
|
||
800 |
|
|
|
|
|
|
|
|
|
|
|
Industry |
|
600 |
|
|
|
|
|
|
|
|
|
|
|
|
|
400 |
|
|
|
|
|
|
|
|
|
|
|
|
|
200 |
|
|
|
|
|
|
|
|
|
|
|
|
|
0 |
|
|
|
|
|
|
|
|
|
|
|
IEA 2019. |
|
1973 |
1977 |
1981 |
1985 |
1989 |
1993 |
1997 |
2001 |
2005 |
2009 |
2013 |
2017 |
||
All rights reserved. |
Electricity consumption has doubled in the last decade, and increased across all sectors.
*Services/other includes commercial and public services, agriculture and forestry, and non-specified consumption. Source: IEA (2019a), World Energy Balances, 2019, www.iea.org/statistics/
Industrial electricity demand has increased rapidly since the early 2000s and has continued to grow by 75% in the past decade. Service sector and residential demand have grown even more rapidly in recent years. Between 2014 and 2017 electricity consumption for services increased by 28% and by 26% in the residential sector. The residential demand growth has been driven by better access to electricity and increased use of electrical appliances.
However, per capita electricity consumption in India is still among the world’s lowest (Figure 7.5). India’s electricity growth rate per capita decreased in 2011/12, but overtook that of China in 2013/14 for two years (Figure 7.6). Future electricity consumption will be driven by growing electricity access, ownership of appliances and economic growth.
155
ENERGY SECURITY
IEA. All rights reserved.