

3. ENERGY AND SUSTAINABLE DEVELOPMENT
Figure 3.8
SO2 |
2018 |
2040 |
|
NOX |
2018 |
|
2040 |
PM2.5 2018
NPS 2040
2018 NPS 2040
Industrial emissions of major air pollutants and fuel mix in industry, 2015 and 2040 (NPS)
20% |
40% |
60% |
80% |
|
100% |
|
|
|
|||||||
|
|
|
|
|
|
|
|
|
|
|
|
|
|
|
Iron and steel |
|
|
|
|
|
|
|
|
|
|
|
|
|
|
||
|
|
|
|
|
|
|
|
|
|
|
|
|
|
|
Cement |
|
|
|
|
|
|
|
|
|
|
|
|
|
|
||
|
|
|
|
|
|
|
|
|
|
|
|
|
|
|
Chemicals |
|
|
|
|
|
|
|
|
|
|
|
|
|
|
||
|
|
|
|
|
|
|
|
|
|
|
|
|
|
|
Paper |
|
|
|
|
|
|
|
|
|
|
|
|
|
|
||
|
|
|
|
|
|
|
|
|
|
|
|
|
|
|
Aluminium |
|
|
|
|
|
|
|
|
|
|
|
|
|
|
||
|
|
|
|
|
|
|
|
|
|
|
|
|
|
|
Transformation* |
|
|
|
|
|
|
|
|
|
|
|
|
|
|
||
|
|
|
|
|
|
|
|
|
|
|
|
|
|
|
Other sectors |
|
|
|
|
|
|
|
|
|
|
|
|
|
|
||
|
|
|
|
|
|
|
|
|
|
|
|
|
|
|
Share of process |
|
|
|
|
|
|
|
|
|
|
|
|
|
|
|
emissions |
|
|
|
|
|
|
|
|
|
Mt |
|
|
|
|
|
(top axis) |
1 |
2 |
3 |
4 |
5 |
|
||||||||||
|
|
|
Coal |
||||||||||||
|
|
|
|
|
|
|
|
|
|
|
|
|
|
|
|
|
|
|
|
|
|
|
|
|
|
|
|
|
|
|
|
|
|
|
|
|
|
|
|
|
|
|
|
|
|
|
Oil |
|
|
|
|
|
|
|
|
|
|
|
|
|
|
|
Natural gas |
|
|
|
|
|
|
|
|
|
|
|
|
|
|
|
Electricity |
|
|
|
|
|
|
|
|
|
|
|
|
|
|
|
Heat |
|
|
|
|
|
|
|
|
|
Mtoe |
|
|
|
|
|
Biomass |
200 |
400 |
600 |
800 |
1 000 |
|
|
|||||||||
|
|
IEA 2019. |
|||||||||||||
|
|
|
|
|
|
|
|
|
|
|
|
|
|
|
|
All rights reserved.
* Transformation of fossil fuels (e.g. oil refining, oil and gas production, LNG terminals), excluding power and heat generation.
Note: The industry energy mix includes non-energy uses (mainly petrochemical feedstocks), as well as energy consumption by transformation industries, excluding heat and power generation.
Source: IEA (2019b), World Energy Outlook 2019.
Energy-related CO2 emissions and carbon intensity: SDG 13
Energy-related CO2 emissions in India nearly doubled in a decade, from 1 022 Mt in 2004 to 2 015 Mt in 2014, illustrating double-digit growth rates between 2005 and 2010 (Figure 3.9). They reached 2 162 Mt CO2 in 2017. CO2 emission are estimated to have grown again in 2017 and 2018, much in line with the global trend.
Figure 3.9 Energy-related CO2 emissions and main drivers, 2000-17
3.0 |
Index 2000=1 |
|
|
|
CO2 emissioi ns |
||
|
|
||
2.5 |
|
GDP/capita |
|
2.0 |
|
Population |
|
1.5 |
|
CO2//TPES |
|
|
2 |
||
1.0 |
|
TPES/GDP |
|
|
|
||
0.5 |
|
|
|
0 |
|
IEA 2019. |
|
2000 2001 2002 2003 2004 2005 2006 2007 2008 2009 2010 2011 2012 2013 2014 2015 2016 2017 |
|||
All rights reserved. |
|||
Energy-related CO2 emissions have more than doubled since 2000, driven by strong economic growth, increasing population and higher carbon intensity in the energy supply.
Notes: Real GDP in USD 2010 prices and purchasing power parity (PPP).
Source: IEA (2019a), CO Emissions from Fuel Combustion 2019, www.iea.org/statistics/.
60
IEA. All rights reserved.
3. ENERGY AND SUSTAINABLE DEVELOPMENT
Estimates show that CO2 emissions in India are likely to have reached 2 299 Mt in 2018, with year-on-year growth from 2017 of 4.8% (IEA, 2018f). Total energy-related CO2 emissions increased by 144% from 2000 to 2017, close to the growth in GDP per capita.
Population and rapid economic growth have pushed up energy demand, which has become the key driver of India’s rising CO2 emissions and carbon intensity (Figure 3.9). From 2000 to 2016, the population grew by 27% and GDP per capita by 158%. The GoI objectives of increasing electricity access, combined with high economic growth rates (6.8% on average per year since 2010), and a growing population have led to an average increase in electricity demand of over 7% a year since 2010. Increased energy efficiency was not able to keep in check the increase in total energy demand, which almost doubled from 2000.
Over the period, CO2 emissions intensity rose by 22%, but the emissions increase was less pronounced thanks to the improvements in energy intensity (TPES/GDP), which fell by 39%. The overall carbon intensity of India’s economy puts India as the eighth highest in a comparison with IEA member countries (Figure 3.10).
Figure 3.10 CO2 intensity of India and IEA member countries, 2017
0.5kg CO /USD PPP (2010)
0.4
0.3
0.2
0.1
0
IEA 2019. All rights reserved.
The high share of coal power makes India’s economy relatively carbon-intensive.
Source: IEA (2019a), CO Emissions from Fuel Combustion 2019, www.iea.org/statistics/.
In spite of the high carbon intensity of the energy supply, India has a comparatively lower level of energy use per capita. India’s per capita CO2 emissions are therefore lower than any IEA member and Association country by a large margin, less than half of Mexico’s and less than one tenth of Australia’s (Figure 3.11). Sustaining economic development and delivery of societal objectives in India will require the adequacy of energy resources for expected growth in energy consumption and energy use per capita over coming decades. Ensuring energy consumption growth at the same time as reducing carbon intensity of supply will be the key challenge.
61
ENERGY SYSTEM TRANSFORMATION
IEA. All rights reserved.

3. ENERGY AND SUSTAINABLE DEVELOPMENT
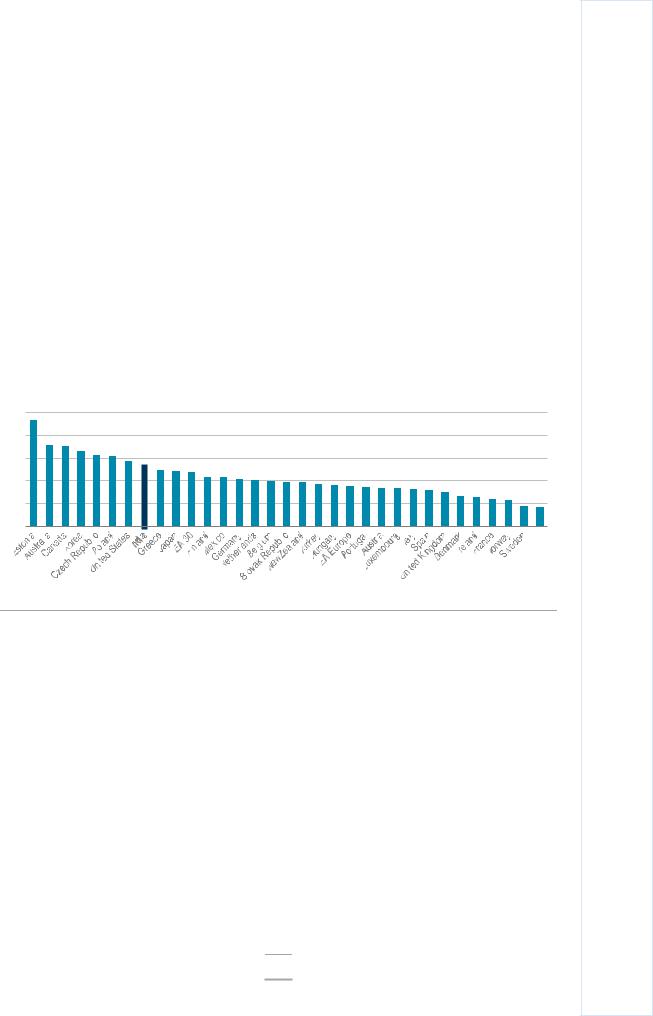
Figure 3.11 CO2 emissions per capita in India and IEA member countries, 2017
18 |
t CO per capita |
||||||||||||||||||||||||||||||||||||||||||||||||||||||||||||||||||
|
|
|
|
|
|
|
|
|
|
|
|
|
|
|
|
|
|
|
|
|
|
|
|
|
|
|
|
|
|
|
|
|
|
|
|
|
|
|
|
|
|
|
|
|
|
|
|
|
|
|
|
|
|
|
|
|
|
|
|
|
|
|
|
|
|
|
|
16 |
|
|
|
|
|
|
|
|
|
|
|
|
|
|
|
|
|
|
|
|
|
|
|
|
|
|
|
|
|
|
|
|
|
|
|
|
|
|
|
|
|
|
|
|
|
|
|
|
|
|
|
|
|
|
|
|
|
|
|
|
|
|
|
|
|
|
|
|
|
|
|
|
|
|
|
|
|
|
|
|
|
|
|
|
|
|
|
|
|
|
|
|
|
|
|
|
|
|
|
|
|
|
|
|
|
|
|
|
|
|
|
|
|
|
|
|
|
|
|
|
|
|
|
|
|
|
|
|
|
|
|
|
|
|
|
14 |
|
|
|
|
|
|
|
|
|
|
|
|
|
|
|
|
|
|
|
|
|
|
|
|
|
|
|
|
|
|
|
|
|
|
|
|
|
|
|
|
|
|
|
|
|
|
|
|
|
|
|
|
|
|
|
|
|
|
|
|
|
|
|
|
|
|
|
|
|
|
|
|
|
|
|
|
|
|
|
|
|
|
|
|
|
|
|
|
|
|
|
|
|
|
|
|
|
|
|
|
|
|
|
|
|
|
|
|
|
|
|
|
|
|
|
|
|
|
|
|
|
|
|
|
|
|
|
|
|
|
|
|
|
|
|
12 |
|
|
|
|
|
|
|
|
|
|
|
|
|
|
|
|
|
|
|
|
|
|
|
|
|
|
|
|
|
|
|
|
|
|
|
|
|
|
|
|
|
|
|
|
|
|
|
|
|
|
|
|
|
|
|
|
|
|
|
|
|
|
|
|
|
|
|
|
|
|
|
|
|
|
|
|
|
|
|
|
|
|
|
|
|
|
|
|
|
|
|
|
|
|
|
|
|
|
|
|
|
|
|
|
|
|
|
|
|
|
|
|
|
|
|
|
|
|
|
|
|
|
|
|
|
|
|
|
|
|
|
|
|
|
|
10 |
|
|
|
|
|
|
|
|
|
|
|
|
|
|
|
|
|
|
|
|
|
|
|
|
|
|
|
|
|
|
|
|
|
|
|
|
|
|
|
|
|
|
|
|
|
|
|
|
|
|
|
|
|
|
|
|
|
|
|
|
|
|
|
|
|
|
|
|
|
|
|
|
|
|
|
|
|
|
|
|
|
|
|
|
|
|
|
|
|
|
|
|
|
|
|
|
|
|
|
|
|
|
|
|
|
|
|
|
|
|
|
|
|
|
|
|
|
|
|
|
|
|
|
|
|
|
|
|
|
|
|
|
|
|
|
8 |
|
|
|
|
|
|
|
|
|
|
|
|
|
|
|
|
|
|
|
|
|
|
|
|
|
|
|
|
|
|
|
|
|
|
|
|
|
|
|
|
|
|
|
|
|
|
|
|
|
|
|
|
|
|
|
|
|
|
|
|
|
|
|
|
|
|
|
|
|
|
|
|
|
|
|
|
|
|
|
|
|
|
|
|
|
|
|
|
|
|
|
|
|
|
|
|
|
|
|
|
|
|
|
|
|
|
|
|
|
|
|
|
|
|
|
|
|
|
|
|
|
|
|
|
|
|
|
|
|
|
|
|
|
|
|
6 |
|
|
|
|
|
|
|
|
|
|
|
|
|
|
|
|
|
|
|
|
|
|
|
|
|
|
|
|
|
|
|
|
|
|
|
|
|
|
|
|
|
|
|
|
|
|
|
|
|
|
|
|
|
|
|
|
|
|
|
|
|
|
|
|
|
|
|
|
|
|
|
|
|
|
|
|
|
|
|
|
|
|
|
|
|
|
|
|
|
|
|
|
|
|
|
|
|
|
|
|
|
|
|
|
|
|
|
|
|
|
|
|
|
|
|
|
|
|
|
|
|
|
|
|
|
|
|
|
|
|
|
|
|
|
|
4 |
|
|
|
|
|
|
|
|
|
|
|
|
|
|
|
|
|
|
|
|
|
|
|
|
|
|
|
|
|
|
|
|
|
|
|
|
|
|
|
|
|
|
|
|
|
|
|
|
|
|
|
|
|
|
|
|
|
|
|
|
|
|
|
|
|
|
|
|
|
|
|
|
|
|
|
|
|
|
|
|
|
|
|
|
|
|
|
|
|
|
|
|
|
|
|
|
|
|
|
|
|
|
|
|
|
|
|
|
|
|
|
|
|
|
|
|
|
|
|
|
|
|
|
|
|
|
|
|
|
|
|
|
|
|
|
2 |
|
|
|
|
|
|
|
|
|
|
|
|
|
|
|
|
|
|
|
|
|
|
|
|
|
|
|
|
|
|
|
|
|
|
|
|
|
|
|
|
|
|
|
|
|
|
|
|
|
|
|
|
|
|
|
|
|
|
|
|
|
|
|
|
|
|
|
|
|
|
|
|
|
|
|
|
|
|
|
|
|
|
|
|
|
|
|
|
|
|
|
|
|
|
|
|
|
|
|
|
|
|
|
|
|
|
|
|
|
|
|
|
|
|
|
|
|
|
|
|
|
|
|
|
|
|
|
|
|
|
|
|
|
|
|
0 |
|
|
|
|
|
|
|
|
|
|
|
|
|
|
|
|
|
|
|
|
|
|
|
|
|
|
|
|
|
|
|
|
|
|
|
|
|
|
|
|
|
|
|
|
|
|
|
|
|
|
|
|
|
|
|
|
|
|
|
|
|
|
|
|
|
|
|
|
|
|
|
|
|
|
|
|
|
|
|
|
|
|
|
|
|
|
|
|
|
|
|
|
|
|
|
|
|
|
|
|
|
|
|
|
|
|
|
|
|
|
|
|
|
|
|
|
|
|
|
|
|
|
|
|
|
|
|
|
|
|
|
|
|
|
|
IEA 2019. All rights reserved.
In per capita emissions, India ranks significantly lower than any IEA member country and a factor of 10 below Australia in the top.
Source: IEA (2019a), CO Emissions from Fuel Combustion 2019, www.iea.org/statistics/.
Sectoral GHG status and stated policy outlook
Coal and oil dominate energy-related CO2 emissions. Coal is the largest energy source in both power generation and industry, and its use accounted for 70% of total energy-related CO2 emissions in 2017 (Figure 3.12). While coal-related emissions stabilised during 2014-16, their growth has resumed over the last two years, driven mainly by the power sector. Oil accounted for 27% of emissions in 2017, and the share is growing as oil consumption increases in both transport and industry.
Figure 3.12 Energy-related CO emissions by source, historical and NPS projections for 2030 and 2040
Mt CO2 |
|
|
|
|
|
|
|
|
|
|
5 000 |
|
|
|
|
|
|
|
|
|
|
4 000 |
|
|
|
|
|
|
|
|
|
|
3 000 |
|
|
|
|
|
|
|
|
|
|
2 000 |
|
|
|
|
|
|
|
|
|
|
1 000 |
|
|
|
|
|
|
|
|
|
|
0 |
|
|
|
|
|
|
|
|
2030 |
2040 |
2001 |
2003 |
2005 |
2007 |
2009 |
2011 |
2013 |
2015 |
2017 |

 Oil
Oil

 Natural gas

 Coal
Coal
IEA 2019. All rights reserved.
Coal-related emissions connected to the power sector have stabilised in recent years, while emissions from oil are increasing with the growth in transport and industry demand.
Source: IEA (2019a), CO Emissions from Fuel Combustion 2019, www.iea.org/statistics/; IEA (2019b), World Energy Outlook 2019.
The contribution of coal towards energy-related CO2 emissions is expected to decline over time thanks to government policies to scale up low-carbon power generation. The outlook of stated policies shows the share of coal in power generation remaining at 70% in 2040. By that time, coal, oil and gas emissions are, however, together expected to have doubled due to the increase in overall energy demand. Nevertheless, the energy intensity of India’s economy is projected to continue on a downward trajectory, with an almost 35%
62
IEA. All rights reserved.

3. ENERGY AND SUSTAINABLE DEVELOPMENT
improvement by 2030 compared to 2017 and 50% by 2040. The power sector represents just over half of total energy-related CO2 emissions, with the industrial and transport sectors accounting for 13% and 26% of the emissions respectively (Figure 3.13).
Figure 3.13 Energy-related CO emissions by sector, historical and NPS projections for 2030 and 2040
5 000 |
Mt CO2 |
|
|
|
|
|
|
|
|
|
|
|
|
|
|
|
|
|
|
|
|
|
|
Commercial* |
|
|
|
|
|
|
|
|
|
|
|
|
|
|
4 000 |
|
|
|
|
|
|
|
|
|
|
|
Residential |
3 000 |
|
|
|
|
|
|
|
|
|
|
|
Transport |
|
|
|
|
|
|
|
|
|
|
|
Industry** |
|
2 000 |
|
|
|
|
|
|
|
|
|
|
|
Power generation |
|
|
|
|
|
|
|
|
|
|
|
Other*** |
|
|
|
|
|
|
|
|
|
|
|
|
|
|
1 000 |
|
|
|
|
|
|
|
|
|
|
|
|
0 |
2001 |
2003 |
2005 |
2007 |
2009 |
2011 |
2013 |
2015 |
2017 |
|
|
IEA 2019. |
|
2030 |
2040 |
||||||||||
|
All rights reserved. |
Power generation, heavily reliant on coal combustion, represents over half of total energyrelated CO2 emissions, its contribution having stabilised in recent years.
*Includes energy-related emissions in agriculture. **Energy-related emissions from manufacturing and construction.
***Emissions from refineries and other energy industry, and non-defined emissions.
Source: IEA (2019a), CO Emissions from Fuel Combustion 2019, www.iea.org/statistics/; IEA (2019b), World Energy Outlook 2019.
The power sector represents the largest emitting sector in India. The carbon intensity of India’s power generation has declined by over 10% since 2010, thanks to more renewable energy sources and a step change in coal power efficiency (up 6% over the last five years) after a suite of new plants were installed. The dominance of coal power still gives India significantly higher carbon intensity than the more mixed power supplies of the People’s Republic of China (“China”) and the IEA average (see Chapter 7 on electricity, Figure 3.10), but India has witnessed a stronger downward trend recently.
Figure 3.14 Electricity generation by source in India, historical and projected (STEPS)
100% |
|
|
5 000 |
TWh |
|
Coal |
||||
|
|
|
|
|
|
|
|
|||
|
|
|
|
|
|
|
|
|
|
Gas |
|
|
|
|
|
|
|
|
|
|
|
|
|
|
|
|
|
|
|
|
|
|
80% |
|
|
4 000 |
|
|
|
|
|
|
Oil |
|
|
|
|
|
|
|
|
|||
|
|
|
|
|
|
|
|
|||
|
|
|
|
|
|
|
|
Nuclear |
||
|
|
|
|
|
|
|
|
|||
|
|
|
|
|
|
|
|
|
|
|
|
|
|
|
|
|
|
|
|
|
Hydro |
|
|
|
|
|
|
|
|
|
|
|
|
|
|
|
|
|
|
|
|
|
|
60% |
|
|
3 000 |
|
|
|
|
|
|
Bioenergy |
|
|
|
|
|
|
|
|
|
|
Solar PV |
|
|
|
|
|
|
|
|
|
|
|
|
|
|
|
|
|
|
|
|
|
|
40% |
|
|
2 000 |
|
|
|
|
|
|
Wind |
|
|
|
|
|
|
|
|
|||
|
|
|
|
|
|
|
|
|||
|
|
|
|
|
|
|
|
Other renewables |
||
|
|
|
|
|
|
|
|
|||
|
|
1 000 |
|
|
|
|
|
|
||
20% |
|
|
|
|
|
|
|
|
|
|
|
|
|
|
|
|
|
|
|
||
0% |
|
|
|
|
|
|
|
|
|
IEA 2019. |
|
|
|
2018 2040 |
|
|
|||||
2010 2012 2014 2016 2018 2020 2022 2024 2026 2028 2030 2032 2034 2036 2038 2040 |
|
|
|
All rights reserved. |
||||||
Coal remains the primary source of generation, but its share declines over time, reducing power sector emissions.
Source: IEA (2019b), World Energy Outlook 2019.
63
ENERGY SYSTEM TRANSFORMATION
IEA. All rights reserved.