


3. ENERGY AND SUSTAINABLE DEVELOPMENT
Power sector
The Environment Protection Amendment Rules (EPAR) introduced in December 2015 strengthened the SO2 and NOX emissions limits for new and existing plants. For existing and new coal-fired power plants they are, respectively, 200-600 µg/m3 and 100 µg/m3 of SO2 and 300-600 µg/m3 and 100 µg/m3 of NOX. These limits are comparable to or even more stringent than those in place in the European Union and the United States. Even though the coal types used in India are usually quite low in sulphur content, the new rules will require considerable retrofit investment in scrubbers and other control technologies. The limit for PM 2.5 from new power plants is 30 µg/m3, while the limit for existing plants is 50 µg/m3 or 100 µg/m3 depending on when the plant was built. Given the location of power plants in highly densely populated areas, especially in the north of the country, implementation of the EPAR rules has an important role in the reduction of SO2 and PM 2.5 emissions.
Air pollution limits in the power sector had not, however, been implemented by the initial deadline of 2017, two years after their adoption. Precise implementation status of the EPAR rules is evolving, with challenges due to ongoing litigation, policy uncertainty, delays in technology implementation and cost estimates by the thermal power industry in the course of 2018 and 2019. The compliance with the new standards was first postponed to 2022 by the GoI due to extensive retrofitting costs for the existing power plants. The Supreme Court, however, reimposed the deadline of 2021 for the most polluting plants and maintained the deferred deadline for the remaining plants at 2022. In August 2019 the Supreme Court additionally cancelled the further tightening of SO2 and NOX emission limits for thermal power plants by 2022 (proposed NOX limit of 300 µg/m3 by 2022 and 100 µg/m3 limit thereafter), but maintained the implementation of the current air pollution standards (NOX limit of 450 µg/m3).
Industrial sector
Emission standards for key industrial sectors are also being gradually developed, though additional efforts are needed to ensure more comprehensive coverage. The cement and steel subsectors have standards for PM, NOX and SO2 emissions, while other subsectors (e.g. aluminium, large paper production facilities and small boilers) only have PM emission limits. SO2 emissions are often tackled by the imposition of minimum stack height requirements and standards depending on the age or size of the installations. The stringency of the regulation of industry should, however, be strengthened to reflect technology capabilities. For instance, PM emission limits for most iron and steel processes (e.g. blast furnaces, sintering plants and basic oxygen furnaces) are set much higher than in other emerging economies11.
An important industry-related measure to improve urban air quality is also the focus on reduction of PM 2.5 pollution from brick kilns, which traditionally operate in densely populated areas. Other policy efforts, which are primarily aimed at addressing economic or climate change objectives, will also help curb pollutant emissions growth, notably efforts to increase industrial energy efficiency via the Perform, Achieve and Trade (PAT) scheme and its market-based trading programme for efficiency certificates.
11 Three times higher in India than in China (150 µg/m3 compared with 50 µg/m3) and 7.5 times higher than in Germany (20 µg/m3) (World Steel Association, 2014).
57
ENERGY SYSTEM TRANSFORMATION
IEA. All rights reserved.
3. ENERGY AND SUSTAINABLE DEVELOPMENT
The outlook for air quality
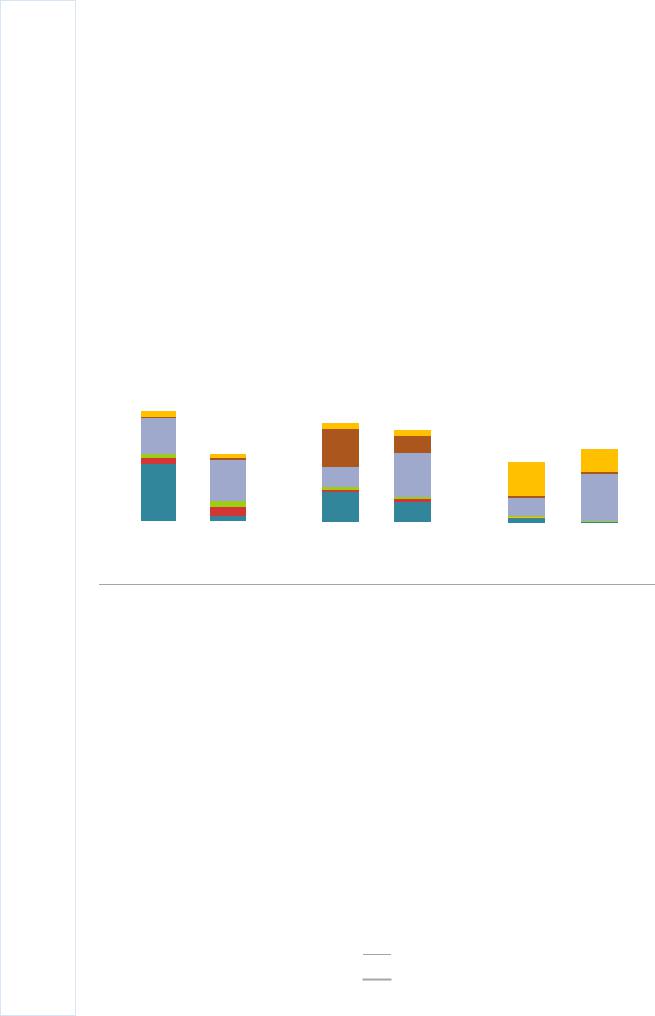
India is expected to become the most populous country in the world by the mid-2020s, according to the United Nations, with an additional 315 million people expected to join the urban population by 2040 (and population density increasing to an average of 540 inhabitants per square kilometre [km2]), with a corresponding increase in demand for additional housing, transport infrastructure and electricity, all of which drive air pollution. Policy action to curb the growth of air pollutant emissions is therefore essential. Successful implementation of the impressive policies already stated by the GoI will, according to IEA estimates, help to keep the growth in check (Figure 3.7). Without these policy measures, SO2 and PM 2.5 emissions would roughly double by 2040 and NOX emissions would grow almost 2.5 times. However, the decrease in pollution from sources covered by regulation (power and transport sectors) will be outstripped by the growth of pollution from industrial expansion, notably for PM 2.5.
Figure 3.7 Emissions of major air pollutants, 2018 and 2040 (NPS)
|
|
|
|
SO2 |
NOx |
|
|
|
PM 2.5 |
|||
10 |
Mt SO2 |
|
Mt NOX |
|
Mt PM 2.5 |
|||||||
|
|
|
|
10 |
|
|
10 |
|
|
|
|
|
|
|
|
|
|
|
|
|
|
|
|||
8 |
|
|
|
|
8 |
|
|
8 |
|
|
|
|
|
|
|
|
|
|
|
|
|
|
|||
6 |
|
|
|
|
6 |
|
|
6 |
|
|
|
|
|
|
|
|
|
|
|
|
|
|
|||
4 |
|
|
|
|
4 |
|
|
4 |
|
|
|
|
|
|
|
|
|
|
|
|
|
|
|||
2 |
|
|
|
|
2 |
|
|
2 |
|
|
|
|
|
|
|
|
|
|
|
|
|
|
|||
2018 |
|
NPS 2040 |
|
|
|
|
2018 |
|
NPS 2040 |
|
|
|
|
2018 |
NPS 2040 |
||||
|
Power |
|
Other energy sector |
|
|
Agriculture |
|
|
Industry |
|
|
Transport |
|
Buildings |
|
IEA 2019. |
|||
|
|
|
|
|
|
|
|||||||||||||
|
|
|
|
|
|
|
All rights reserved. |
||||||||||||
|
|
|
|
|
|
|
|
|
|
|
|
|
|
|
|
|
|
|
|
Note: STEP = Stated Policies Scenario, a projection based on existing policy frameworks and announced policy intentions.
Source: IEA (2019b), World Energy Outlook 2019.
In the power sector, the successful implementation of the EPAR regulations and diversification of the power mix is expected to lead to a reduction in total SO2 emissions by 2040 relative to today, with the bulk of remaining SO2 emissions shifting to industry. NOX emissions drop slightly by 2040, as a strong decrease in emissions from coal plants is partially offset by increases from gas-fired plants and biomass combustion (Figure 3.7). Nevertheless, power generation in India more than triples over this period, with coal showing stronger absolute growth than any other source of power generation in India. As power plants are often located near cities, towns and villages, the potential impact on health of regulatory implementation is significant. Therefore, resolving the issues related to delay in and non-compliance with EPAR application offers considerable potential benefits.
Implementation of EPAR requires the majority of the currently installed coal-fired capacity to be retrofitted with modern control technology and new-build plants to be equipped with advanced technologies for NOX, SO2 and PM control. Rapid expansion of modern renewables, including solar PV and wind power (underpinned by ambitious policy support),
58
IEA. All rights reserved.

3. ENERGY AND SUSTAINABLE DEVELOPMENT
together with plans to expand nuclear capacity are crucial measures to move towards pollution-free power over time. In this regard, linking air quality with decarbonisation policy also plays an important role in addressing the two challenges in a synchronised manner.
In transport, the introduction of Bharat VI emissions standards for LDVs and HDVs is expected to play an important role in reducing emissions. Most importantly transport’s share of NOX emissions is expected to decline from 40% today to less than 20% in 2040. This is in spite of the exponential growth in car ownership and thanks to considerable fuel economy improvement. This decline is also underpinned by increasing stringency of standards for HDVs, with a key role for buses. But India will remain heavily reliant on road freight despite the intention to move part of this load to new dedicated rail freight corridors. Transport plays a relatively minor role (less than 5%) in India’s energy-related emissions of PM 2.5. While vehicle standards play an effective role in reducing exhaust-related emissions, attention needs to be paid to non-exhaust emissions, such as from breaks and tyres, which are increasing considerably (also from EVs).
In industry, the implementation of tighter emissions standards is expected to improve the emissions intensity of key industrial sectors. Yet, air pollutant emissions from industry are expected to grow substantially over the coming decades to around two and a half times higher in 2040 than today. The growth in industrial output results in almost fourfold growth in coal consumption, with a large absolute increase in pollutant emissions. Despite policy efforts to improve emission intensities, regulation remains weak by international comparison and less stringent than in other sectors (for instance in transport). Three energy-intensive subsectors (steel, cement, chemicals and petrochemicals) give rise to the vast majority of emissions for each pollutant. The steel subsector alone gives rise to almost 50% of total PM 2.5 emissions from the industrial and transformation sector today. This share increases to almost 70% by 2040 as crude steel production increases by a factor of 4.5, compared with 2015 levels based on current and announced policies (Figure 3.8). Despite the low sulphur content of Indian coal, SO2 emissions also increase dramatically, especially from the iron and steel subsector.
PM emitted by combustion activities in the buildings sector represents almost two-thirds of total energy-related PM emissions in India today, due to solid fuel cooking (the sector accounts for only a small share of total NOX and SO2 emissions). The way that this evolves in the projections is shaped by the major progress that India is expected to make in energy access. A key driver for reducing indoor air pollution is the reduction by almost a half the number of people without access to clean cooking facilities in rural areas (from around 840 million today to 480 million) and the switch from solid biomass and kerosene to LPG (and in some instances piped natural gas and electricity) by all urban households by 2040. These improvements cut PM 2.5 emissions from the buildings sector by over 30% in 2040, compared with today. This achievement, combined with reliable electricity supply, enables the phase-out of kerosene use for lighting, significantly reducing household fuel combustion and associated SO2 emissions.
59
ENERGY SYSTEM TRANSFORMATION
IEA. All rights reserved.