

книги / 761
.pdf2.
2.17 1 DTP3
: DHS & MICS surveys, various years.
StatLink  http://dx.doi.org/10.1787/888933866771
, , DTP3.
2.18 1 DTP3
: DHS & MICS surveys, various years.
StatLink  http://dx.doi.org/10.1787/888933866790
( 2.19)..
증가했다. ( 2.20)..
: 2018 / , |
29 |
2.
2.19 1 15~49
: DHS & MICS surveys, various years.
StatLink  http://dx.doi.org/10.1787/888933866809
2.20 1 15~49
: DHS & MICS surveys, various years.
StatLink  http://dx.doi.org/10.1787/888933866847
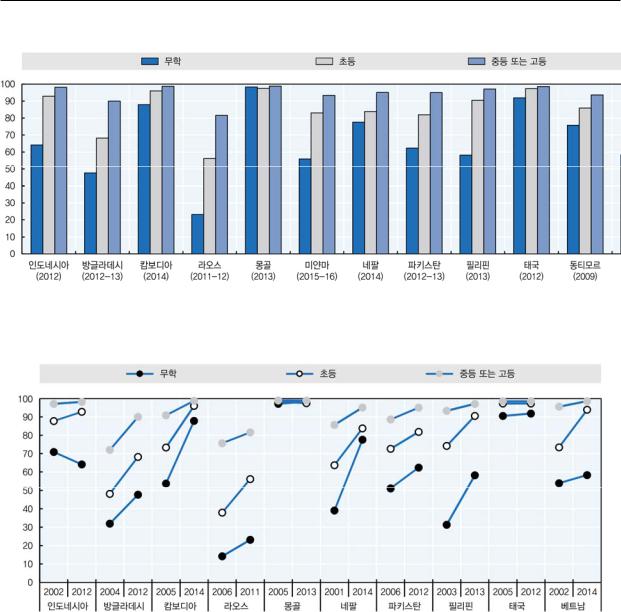
, , 2 1( 2.21). ..
, , , ( 2.22). .
30 |
: 2018 / , |
2.
2.21 5
: DHS & MICS surveys, various years.
StatLink  http://dx.doi.org/10.1787/888933866866
2.22 5
: DHS & MICS surveys, various years.
StatLink  http://dx.doi.org/10.1787/888933866885
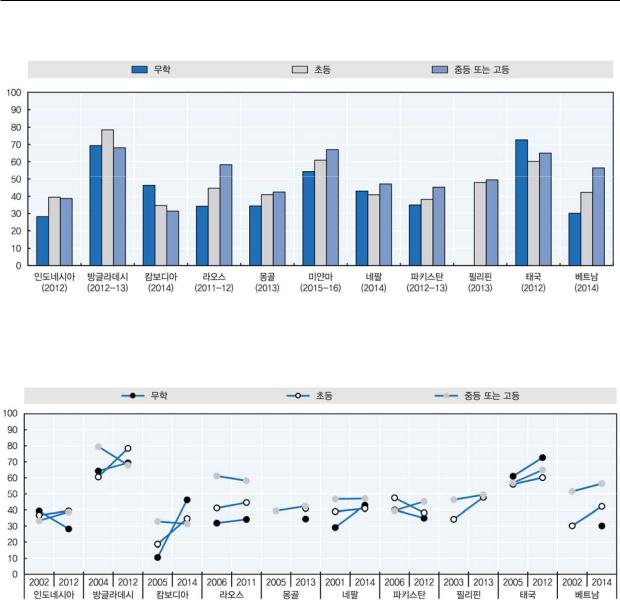
, , 50% ( 2.23).
1 DTP3 . , DTP3 ( 2.24). , ,DTP3 .
: 2018 / , |
31 |

2.
2.23 1 DTP3
: DHS & MICS surveys, various years.
StatLink  http://dx.doi.org/10.1787/888933866904
2.24 1 DTP3
: DHS & MICS surveys, various years.
StatLink  http://dx.doi.org/10.1787/888933866923
32 |
: 2018 / , |

: 2018 /
3
: 2018 / , |
33 |

3.
,(3 “ ” “5 ” )., , (4 “ ” ). ,, (National Institute on Ageing, National Institute of Health and WHO, 2011).
2016 69.9 , 20005.8 .
74.3. 2000 3.6 ,OECD 3.1 ( 3.1, ).
. 201684.2 ., , , , ,80 . , 1070 , 2016 66 .
( 3.1, ). 20164.7 5.4 , OECD 5.6 .8, 2 . 65 ( 3.2).77.6% 84.5% 65 ,65 67.3% 74.4%
. , , ,65 94% ,655 3 ., (UNESCAP, 2017).
(1 GDP )( 3.3). 1. 1 GDP ,. ,. (3 “ ” “5 ” ).
, . . .
...
“65 ” 65.
34 |
: 2018 / , |

3.
3.1. 2000 2016 , , 2016
: OECD Health Statistics 2018; the World Bank World Development Indicators Online.
StatLink  http://dx.doi.org/10.1787/888933867075
3.2 65 , 2016 |
3.3. 1 GDP, 2016 |
: The World Bank World Development Indicators Online. |
: OECD Health Statistics 2018, The World Bank World |
||
StatLink |
http://dx.doi.org/10.1787/888933867284 |
Development Indicators Online. |
|
|
|
StatLink |
http://dx.doi.org/10.1787/888933867493 |
: 2018 / , |
35 |

3.
1 ,, ,, .
,, ,(4 “” “ ” ). , ,. 1 2/3 ( 40~28 ) .
. ,6 , 2,000g( :) . 48 ,24 , ., , ,(UNICEF, 2013).,(WHO, 2006). (4 “ ” 5 “ ”).
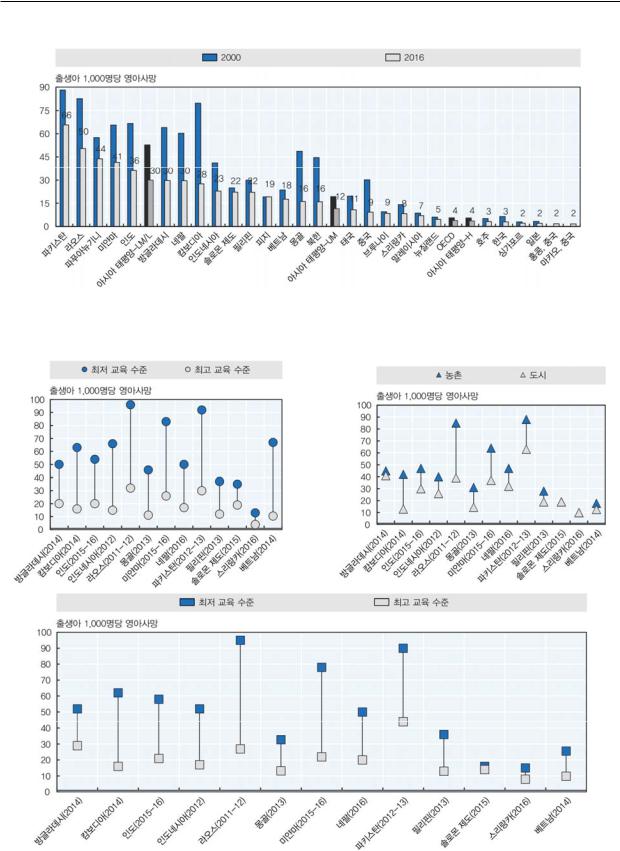
2030 1,000 12(SDG). 201630 , 2000( 3.4). 1,000 11.5 SDG .
. , , , ,2016 1,000 3, 50.
2000 50% ( 3.4). , ,65% ,, ,.
( 3.5). ,, 554 .6 ,. ( ) ,( 3.5)..
1,000 1.
인구조사, . .5 .
36 |
: 2018 / , |
3.
3.4 , 2000 2016 ( )
: UN Inter-agency Group for Child Mortality Estimation (IGME) Child Mortality Report 2017; Hong Kong annual digest of statistics 2017; Macau yearbook of Statistics, 2016.
StatLink  http://dx.doi.org/10.1787/888933867626
3.5. ,
: DHS & MICS surveys, various years.
StatLink  http://dx.doi.org/10.1787/888933867645
: 2018 / , |
37 |

3.
5
5 . SDG 2030 51,000 25(United Nations, 2015).
5 (17%),(15%), (10%), (9%),
(7%) . ,
(Fischer Walker , 2013, WHO UNICEF, 2013). 5
3/4 .
5 35%. SDG. 2012 (World Health Assembly) 6“ , ,
(Comprehensive implementation plan on maternal, infant and young child nutrition)” .10 (UN Decade of Action on Nutrition, 2016~2025) .
2016 560 5, 40%(220 )(UNICEF, 2017). 51,000 35.9 13.1 ( 3.6). ,
, , ,, 1,000 4 OECD. , , ,1,000 50, .5 19%(110 ) .
550% , . ,, 70% .5
, , A ,, (WHO, 2014a).2000~2015 67%(3 “ ” ). SDG, , , , ,(UNICEF, 2013).
(3 “ ” ), 5 ( 3.7). 5 ,.,5 6 .. , ,5 ,20% 20%5 3. ( 3.7). 5.
5 1,000 5. 5.
5 .
.(rate) (ratio) 3
“ ” .
38 |
: 2018 / , |