


Exploring Clean Energy Pathways: |
3. The implications if CO2 storage were limited |
The role of CO2 storage |
|
In-depth analysis: Implications for power generation in the LCS
In the LCS, storage of CO2 from power plants would be almost zero, a stark difference from the CTS where 56 Gt CO2 from the power sector are stored from today to 2060 (Figure 39). Cumulative CO2 emissions from the power sector would be only 2% higher compared to the CTS. Annual CO2 emissions in 2060 would quadruple compared to the CTS, though from a very low level of 200 Mt CO2 in the CTS. This increase in the power sector’s emissions reflects that by excluding CO2 storage, the costs for CO2 abatement would increase, with marginal abatement costs reaching USD 450/tCO2 by 2060. Consequently, mitigation options in other parts of the energy system would become more economic. Still, at a global average CO2 intensity of 12 g CO2/kWh, electricity would be almost completely decarbonised by 2060.
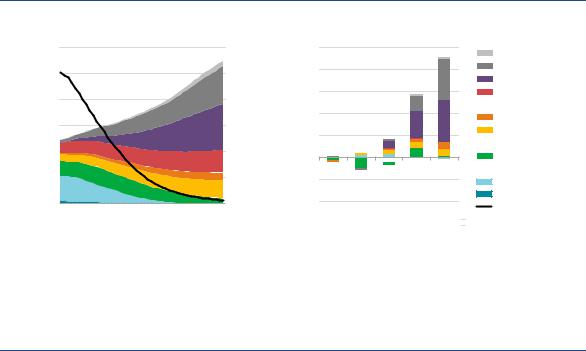
Figure 39. Annual CO2 emissions of global power sector and cumulative CO2 stored, used and captured in the CTS and the LCS
IEA 2019. All rights reserved.
Note: Analysis above uses the Energy Technology Perspectives modelling framework.
More than 55 Gt CO2 from the power sector are cumulatively stored by 2060 in the CTS, an amount corresponding to the sector’s global CO2 emissions over the last four years. In the LCS, almost no CO2 from the power sector would be stored, while 2 Gt CO2 would be captured and used for fuel and chemical feedstock production.
This would be largely achieved thanks to renewables, mainly solar PV and wind, which would account for 84% in the generation mix of the variant in 2060, compared to 77% in the CTS (Figure 40). Power generation with CO2 capture would almost vanish by 2060, with a share of 1% in the generation mix. The captured CO2 (around 2 Gt CO2 cumulatively by 2060) would be almost completely utilised in the fuel transformation sector for the production of synthetic fuels or feedstocks.
Early retirement of coal-fired power plants, i.e. closing plants before they reach the end of their technical lifetime, would be required to drastically decarbonise the global power sector as in the CTS. Based on the technical lifetime of coal power plants existing today or under construction, around 750 GW of capacity could still be operating in 2060 and emit around 3.5 Gt CO2 per year,
PAGE | 61
IEA. All rights reserved.

Exploring Clean Energy Pathways: |
3. The implications if CO2 storage were limited |
The role of CO2 storage |
|
an emission level clearly incompatible with the targets of the Paris Agreement. In the CTS, around 1 000 GW of coal-fired power capacity are retired early. In the LCS, the capacity retired prematurely would be, at 1 200 GW, somewhat higher, reflecting that retrofitting coal-fired power plants with CCU is no longer an economic option. Most of the early retirement of coal capacity in the LCS would occur in the period 2025–40, at a global average rate of 60 GW per year, while in the CTS the retirement rate over this period is 45 GW per year, a quarter lower.
As a result of early retirement of coal capacity in the LCS compared to the CTS, global electricity generation from coal power plants existing today or under construction would be, on a cumulative basis, 20 200 TWh lower in the LCS over the time period 2017–60. This reduced coal-fired electricity generation from plants either existing or under construction, but for which the original investment must be paid in any case, would result in lost revenues that are estimated (on an undiscounted basis) at around USD 1.8 trillion between 2017 and 2060. This would mostly affect Asian countries with a quite young coal fleet today, with an average age of 9 years in China and 12 years in India, while the average age of the coal fleet in Europe is 30 years and 36 years in the United States. Accordingly, almost two-thirds of these estimated lost revenues would occur in China and a quarter of them in India.
The captured CO2 from retrofitted coal-fired power plants could be used for the production of synthetic hydrocarbon fuels (PtL, PtG), substituting fossil fuels and resulting in similar CO2 reductions to the counterfactual case of storing the CO2 and continuing the use of fossil fuels. In the LCS, however, it would be more cost-effective to retire the coal-fired power plants early instead and replace them with renewable power generation (or to a much smaller extent with nuclear).
Limiting CO2 storage would lead overall to much higher electricity generation, being 13% higher in 2060 compared to the CTS. This would be to some extent driven by increased electrification of transport and industry as a CO2 mitigation option, while a slightly higher cost for residential and commercial electricity would trigger efficiency measures that would lead to reduced electricity demand. As a net effect, global final electricity demand would increase by 900 TWh in 2060 in the LCS, or 2% compared to the CTS. Combined with energy efficiency improvements, electricity’s share of global final energy demand in 2060 would increase from to 36% in the CTS to 39% in the LCS.
The largest impact on electricity demand, however, would come from the fuel transformation sector, where around 4 700 TWh (or 9% of global electricity generation) in 2060 would be used for the production of synthetic hydrocarbon fuels through PtL and PtG. This additional electricity demand would be largely covered by dedicated off-grid renewable electricity generation, largely from solar PV and wind, with parts of it in combined hybrid solar PV and onshore wind systems to increase FLH for hydrogen electrolysis. Therefore, this dedicated power generation, though largely based on variable renewable energy, would not pose the integration challenges caused by grid-connected VRE.22
22 Having said that, energy storage can play a role for the production of hydrogen-based fuels from dedicated solar PV and/or wind generation. Energy storage in the form of battery storage can be used to increase the FLH of the electrolyser, while hydrogen storage can be an option to increase the utilisation of the fuel synthesis process. Whether investments in such additional storage make economic sense (compared to the alternative of curtailing some of the electricity) has to be assessed in the context of the overall plant design and its local conditions, such as hourly solar PV and/or wind generation profiles.
PAGE | 62
IEA. All rights reserved.
Exploring Clean Energy Pathways: |
3. The implications if CO2 storage were limited |
The role of CO2 storage |
|
Figure 40. Global electricity generation in the LCS (left) and changes relative to the CTS (right)
TWh |
60 000 |
|
|
|
600 |
/kWh |
TWh |
10 000 |
|
|
|
|
Other renewables |
|
|
|
|
|
|
|
|
|
|
||||
|
|
|
|
|
2 |
|
|
|
|
|
|||
|
50 000 |
|
|
|
500 |
gCO |
|
8 000 |
|
|
|
|
Wind |
|
|
|
|
|
|
|
|
|
Solar |
||||
|
|
|
|
|
|
|
|
|
|
||||
|
|
|
|
|
|
|
|
|
|
|
|
||
|
40 000 |
|
|
|
400 |
|
|
6 000 |
|
|
|
|
Hydro |
|
|
|
|
|
|
|
|
|
|
|
Biomas with CCS |
||
|
|
|
|
|
|
|
|
4 000 |
|
|
|
|
|
|
|
|
|
|
|
|
|
|
|
|
|
Biofuels and waste |
|
|
30 000 |
|
|
|
300 |
|
|
|
|
|
|
|
|
|
|
|
|
|
|
2 000 |
|
|
|
|
Nuclear |
||
|
|
|
|
|
|
|
|
|
|
|
|
||
|
|
|
|
|
|
|
|
|
|
|
|
Natural gas with CCS |
|
|
20 000 |
|
|
|
200 |
|
|
|
|
|
|
|
|
|
|
|
|
|
|
0 |
|
|
|
|
Natural gas |
||
|
|
|
|
|
|
|
|
|
|
|
|
||
|
10 000 |
|
|
|
100 |
|
|
-2 000 |
|
|
|
|
Coal with CCS |
|
|
|
|
|
|
|
|
|
|
Coal |
|||
|
0 |
|
|
|
0 |
|
|
-4 000 |
|
|
|
|
Oil |
|
|
|
|
|
|
|
|
|
|
CO intensity |
|||
|
2017 |
2030 |
2040 |
2050 |
2060 |
|
|
2020 |
2030 |
2040 |
2050 |
2060 |
|
|
|
|
|
IEA 2019. All rights reserved.
Note: Analysis above uses the Energy Technology Perspectives modelling framework.
In the LCS, CCS in the power sector would be largely replaced by solar PV and wind, which also would cover the additional electricity demand. This would be mainly used for the production of hydrogenbased fuels and feedstocks, and would result in a 13% increase in electricity generation in 2060 compared to the CTS.
As conventional fossil power plants, CCS power plants can contribute to balancing variations in electricity generation and demand. This is particularly true for seasonal variations, which are difficult to meet through battery storage due to the limited capability to store energy over longer time periods. On the demand side, seasonal variations in electricity demand can be driven by heating or cooling needs, while on the generation side weather seasons can influence renewable electricity generation. Examples are the seasonality of India’s wind generation, with peaks during the monsoon season, or the decline in PV generation during winter months in Europe. With increasing shares of these renewable sources in the generation mix to decarbonise the power sector, these seasonal imbalances can become more pronounced in some parts of the world. Furthermore, weather conditions that lead to very little wind and solar generation may coincide with periods of high demand for a period of several days, e.g. several days of foggy weather with no sunshine or wind during winter months in Europe.
In the CTS, power plants equipped with CCS in 2060 have an installed capacity of 615 GW globally, providing around 3 400 TWh of dispatchable electricity generation. They thus provide short-term flexibility on a daily level to some extent, but also balance seasonal variations in renewable generation and electricity demand. In the LCS, the loss of this dispatchable generation would be compensated by increased generation from dispatchable power plants (up 2 270 TWh in 2060 relative to the CTS), namely from natural gas without CCS, bioenergy without CCS, nuclear power and solar thermal energy. The remaining gap would be covered by a combination of solar PV and wind power, with flexibility needs for storage and demand response increasing to 1 560 GW in the LCS compared to 1 430 GW in the CTS.
Converting electricity into a storable fuel (hydrogen, SNG from PtG, ammonia), which can then be used for power generation, is a further option to address seasonal imbalances. In the LCS, PtG would allow the continued use of the existing gas infrastructure for transport and seasonal storage, as well as the subsequent use of the SNG in power plants. This is, however, a relatively costly option, so that on average only 2% of the remaining natural gas use in the power sector in the LCS in 2060 would be based on PtG.
PAGE | 63
IEA. All rights reserved.

Exploring Clean Energy Pathways: |
3. The implications if CO2 storage were limited |
The role of CO2 storage |
|
Large-scale electricity interconnections between regions with different seasonal patterns of electricity demand or of renewable electricity production could be a further way to balance seasonal variations, e.g. higher winter electricity demand in Northern Europe could be covered by otherwise unused solar resources in North Africa. Such large-scale and long-distance interconnections are technically feasible. At the end of last year the world’s longest transmission line (based on ultra-high-voltage direct current technology with a transmission capacity of 12 GW) commenced operation in China, connecting northwest China's Xinjiang Uygur Autonomous Region and China’s Anhui province in the east over a distance of 3 324 kilometres, roughly equivalent to the distance between Moscow and Madrid. While technically feasible, long-distance interconnectors may face political challenges and security concerns, especially when involving not only the importing or exporting countries, but also several transit countries. For these reasons, long-distance interconnectors have not been investigated as a seasonal balancing option in the scenario analysis.
Overall, while CCS in the CTS plays an important role in providing system flexibility, in particular on the seasonal scale, its almost complete elimination from the power sector in the LCS would require investment in alternative dispatchable low-carbon generation options. This, in total, would lead to an additional capacity need for dispatchable power technologies (gas turbines and combined-cycle gas turbines without CCS, biomass power, nuclear power, solar thermal power, electricity storage) of around 900 GW in 2060, resulting in additional investment of USD 1.3 trillion over 2017–60.
Box 8. What are the impacts on demand for materials in the power sector if CO2 storage were limited?
While the LCS would lead to lower consumption of fossil fuels by having fewer coalor gas-fired power plants with CCS and by the substitution of fossil oil and natural gas with synthetic fuels from hydrogen, the impact on material needs to build power generation capacity is not immediately clear. Electricity generation in the LCS would be 13% higher compared to the CTS, which would drive up capacity needs, in particular solar PV and wind, and the related material needs to build these technologies. At the same time, the capacity mix would be different, with fossil-based power plants with CCS almost completely disappearing in the LCS.
The implications of the power sector on steel, cement and aluminium demand have been assessed based on new additions to power technology capacity in the scenarios and their material intensities. The overall impacts of the LCS on material needs would be moderate. Cumulative material demands during 2015–60 would increase by 11% for steel, 8% for cement and 12% for aluminium, relative to the CTS. The impacts on global material demand would be smaller, with the power sector being responsible for a 0.4% increase in cumulative steel demand in the LCS, a 0.4% increase in aluminium demand and a 0.05% increase in cement demand. These increases in total material demand may appear small, but may still be challenging for the industrial sector, given limited availability of CCS and the need to rely on more costly production pathways in the LCS.
The cumulative needs of the power sector for steel, cement and aluminium would increase in the LCS by 8–12% relative to the CTS.
PAGE | 64
IEA. All rights reserved.