


Global EV Outlook 2019 |
5. Challenges and solutions for EV deployment |
5. Challenges and solutions for EV deployment
Vehicle and battery costs
Challenge
EV purchase prices are not yet competitive with ICE vehicles
Indications from the total cost of ownership analysis
The high purchase price of an electric vehicle (EV) (absent purchase incentives) is regarded by consumers as the main barrier when buying a new car. The price difference compared with an internal combustion engine (ICE) vehicle is substantial. Purchasing a standard medium size EV is approximately 40% more expensive1 than a conventional ICE vehicle of similar size (IEA, 2019a).
The purchase price, however, does not give the full picture of the total cost for the consumer. The total cost of ownership (TCO) is a useful means to compare the cost of driving vehicles with different characteristics by taking account of the combined effects of purchase price and operational costs. The Global EV Outlook 2018 took a close look at comparing the TCO between electric and ICE vehicles for various categories (IEA, 2018a). The key findings are: 2
•From a first-owner perspective (assumed to keep the car on average 3.5 years), even with higher prices for fuel than for electricity on a per kilometre (km) basis, the TCO for a battery electric vehicle (BEV) is higher than for an ICE vehicle.
•With battery prices to auto manufacturers of USD 260 (United States dolars) per kilowatthour (kWh) (comparable with battery production costs close to USD 215/kWh, i.e. accounting for a 20% profit margin for battery suppliers), scaling up the consumer adoption of BEVs in cars continues to require policy support.
•With battery prices close to USD 330/kWh,3 plug-in hybrid vehicles (PHEVs) show lower first-owner TCOs than ICE cars only in regions with high fuel prices.
•Electric two-wheelers are cost competitive with ICE versions in countries with high fuel
taxes when the mileage exceeds 4 500 km/year and with a battery pack price of USD 400/kWh.4
1An EV costs around USD 35 600 and a standard ICE vehicle costs around USD 25 000 (IEA, 2019b).
2The TCO analysis parameters include: vehicle purchase price; mileage; fuel consumption; fuel price; maintenance costs; duration of ownership; residual value of the vehicle at the end of its life, as well as a discount factor. The TCO analysis developed for the Global EV Outlook 2018 looked at the mid-size car category and did not take into account time and discomfort costs possibly posed by BEVs, e.g. for long-distance trips.
3This value (which applies to PHEVs) is compatible with USD 260/kWh for BEVs, given that PHEV batteries have a stronger focus on power density, rather than energy density (IEA, 2018a).
PAGE | 165
IEA. All rights reserved.

Global EV Outlook 2019 |
5. Challenges and solutions for EV deployment |
•Electric buses travelling 40 000-50 000 km/year are competitive in regions with high diesel taxation regimes for battery prices below USD 260/kWh.
•Electric trucks are only cost competitive as medium trucks with an all-electric driving range
below 200 km and as heavy trucks with a range of 400 km with battery pack cost of USD 260/kWh and diesel price of USD 1.4 per litre (L).
A significant overall conclusion of the TCO analysis is that, given the battery production costs, battery prices and fuel prices considered in the Global EV Outlook 2018 analysis, the economic advantages of vehicle electrification currently are limited to a relatively narrow range of cases.
Effect of recent battery cost reductions on the cost gap
A recent survey indicates that prices of automotive battery packs were around USD 175/kWh by the end of 2018 (Goldie-Scot, 2019). The significant price drop in comparison with the USD 215/kWh used for the central estimate of the TCO analysis in 2018 reflects changes in the key determinants of battery pack costs. These include moving towards increasing shares of nickel-rich chemistries in nickel manganese cobalt oxide (NMC, i.e. moving from NMC 111 to 422 and 532, and to a lesser extent up to 622 and 811)5 and nickel cobalt aluminium oxide (NCA,
moving from N0.8C0.15A0.05 to N0.9C0.05A0.05) batteries and the increasing size of battery production plants, which reduces the production costs per kWh of automotive battery packs.
Simulations made with the BatPac Model developed by the Argonne National Laboratory indicate that the battery pack cost of USD 215/kWh used in the 2018 TOC analysis is consistent with an average battery pack of 30 kWh, a plant capacity of 3.5 gigawatt-hours per year (GWh/year) and an NMC 111 cathode composition (IEA, 2018a).6 The same BatPac Model indicates that a cost value of USD 175/kWh is compatible with a change in battery chemistry to a 80/20% NMC 111 and NMC 622 mix, if the pack size is 30 kWh and the plant size is 3.5 GWh/year.7
Impacts of developments in 2018 on the total cost of ownership
The TCO for all-electric vehicles is strongly correlated with the price of batteries (IEA, 2018a). As battery prices continue to decrease and energy densities increase, EVs are set to become increasingly attractive from the perspective of cost and performance. Figure 5.1 illustrates the cost competitiveness of different powertrain technologies for a car as a function of battery prices. It considers a first-owner perspective and looks at two fuel price conditions: USD 0.8/L
and USD 1.5/L, |
respectively |
coupled with average annual mileage of 12 |
000 km/year and |
18 000 km/year.8 |
Conditions |
compatible with the 2018 TCO analysis (i.e. |
battery price of |
USD 260/kWh) are shown on the extreme right of the graphs. The figure also covers battery price estimates closer to the USD 175/kWh indicated in Goldie-Scot (2019).
4The smaller the battery pack, the larger the relative fixed costs associated with it (e.g. battery management system, casing). This explains the higher pack cost per kWh for small battery capacities (e.g. two-wheelers) compared to larger capacities (in cars and heavier vehicles) for the same battery technology and chemistry.
5The numbers correspond to the ratios of nickel, manganese and cobalt in the cathode.
6As discussed in 2. Prospects for electric mobility development, NMC chemistries account for roughly half of the automotive battery market, while NCA accounts for almost a third of the total. While the focus of the discussion here is on NMC chemistries, similar considerations can also be developed for NCA and advanced NCA chemistries.
7Other ways to achieve the same cost include a stronger shift towards NMC 622 battery chemistry, but in plants having less than 3.5 GWh/year capacity or an upward adjustment of either the pack size or the plant capacity with a higher NMC 111 chemistry share.
8The 12 000 km/year mileage for a USD 1.5/L price environment is consistent with the average magnitude of mileage and fuel prices seen in Europe; 18 000 km/year and USD 0.8/L are closer to values observed in the United States.
PAGE | 166
IEA. All rights reserved.
Global EV Outlook 2019 |
5. Challenges and solutions for EV deployment |
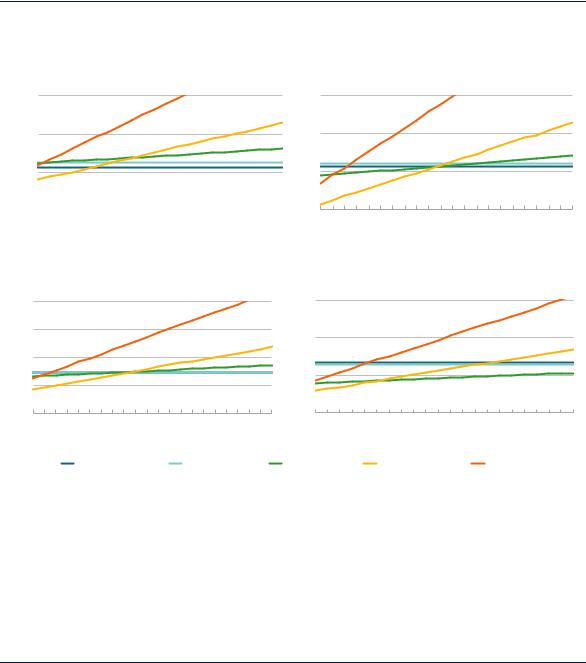
Figure 5.1 shows that a mid-size BEV car with a 36 kWh battery pack (allowing an all-electric range of 200 km) will have a lower TCO than conventional gasoline ICE or hybrid electric (HEV) cars with a fuel price of USD 1.5/L and 12 000 km/year mileage when battery prices fall below USD 150/kWh. If the all-electric range is 400 km, the battery cost threshold for a costs competitive TCO against a gasoline ICE car would be close to USD 70/kWh.
Figure 5.1. Total cost of ownership as a function of battery and fuel prices for a mid-size car and a SUV
Fuel price: 0.8 USD/L - Car |
Fuel price: 1.5 USD/L - Car |
Total cost of ownership (USD/km) |
Total cost of ownership (USD/km) |
0.45 |
0.60 |
0.40 |
0.55 |
0.35 |
0.50 |
0.30


 0.45
0.45
50 |
70 |
90 |
110 |
130 |
150 |
170 |
190 |
210 |
230 |
250 |
50 |
70 |
90 |
110 |
130 |
150 |
170 |
190 |
210 |
230 |
250 |
||||||
|
|
|
Battery price (USD/kWh) |
|
|
|
|
|
|
|
|
Battery price (USD/kWh) |
|
|
|
||||||||||||
|
|
|
|
|
|
|
Fuel price: 0.8 USD/L - SUV |
|
|
|
|
|
|
Fuel price: 1.5 USD/L - SUV |
|||||||||||||
|
|
|
|
|
|
|
|
|
|
|
|
|
|
|
|
|
|
||||||||||
Total cost of ownership (USD/km) |
|
|
|
|
|
|
|
Total cost of ownership (USD/km) |
|
|
|
|
|||||||||||||||
0.50 |
|
|
|
|
|
|
|
|
|
|
|
|
|
|
|
|
0.70 |
|
|
|
|
|
|
|
|
|
|
0.45 |
|
|
|
|
|
|
|
|
|
|
|
|
|
|
|
|
0.60 |
|
|
|
|
|
|
|
|
|
|
|
|
|
|
|
|
|
|
|
|
|
|
|
|
|
|
|
|
|
|
|
|
|
|
|
|
|
|
0.40 |
|
|
|
|
|
|
|
|
|
|
|
|
|
|
|
|
|
|
|
|
|
|
|
|
|
|
|
0.35 |
|
|
|
|
|
|
|
|
|
|
|
|
|
|
|
|
0.50 |
|
|
|
|
|
|
|
|
|
|
|
|
|
|
|
|
|
|
|
|
|
|
|
|
|
|
|
|
|
|
|
|
|
|
|
|
|
|
0.30 |
|
|
|
|
|
|
|
|
|
|
|
|
|
|
|
|
0.40 |
|
|
|
|
|
|
|
|
|
|
50 |
70 |
90 |
110 |
130 |
150 |
170 |
190 |
210 |
230 |
250 |
50 |
70 |
90 |
110 |
130 |
150 |
170 |
190 |
210 |
230 |
250 |
||||||
|
|
|
Battery price (USD/kWh) |
|
|
|
|
|
|
|
|
|
Battery price (USD/kWh) |
|
|
|
|||||||||||
|
|
Gasoline |
|
|
|
|
|
Hybrid |
|
|
|
|
|
PHEV |
|
|
BEV-200 |
|
|
BEV-400 |
|
|
|||||
Notes: The total cost of ownership is calculated from a first-owner perspective, i.e. within a period of four years and using a discount rate of 10%. Annual mileage is 12 000 km for the high fuel price scenario and 18 000 km for the low fuel price scenario. For cars, the gasoline vehicle and the hybrid vehicle are assumed to have fuel consumption of 6.8 litres of gasoline equivalent per 100 kilometres (Lge/100 km) for the ICE vehicle and 5.1 Lge/100 km for the hybrid vehicle. The BEV is assumed to consume 0.19 kilowatt-hours per kilometre (kWh/km) (1.9 Lge/100 km) for 200 km range (36-kWh battery), 0.195 kWh/km for 400 km range (73-kWh battery). For SUVs, the gasoline consumption is 8.9 L/100 km and the hybrid consumption is 6.5 L/100 km. BEV consumption is 0.195 kWh/km for a 200-km SUV and 0.2 kWh/km for a 400-km SUV. PHEVs have the same consumption as the hybrid vehicles for ICE operation and the same as the BEVs when in electric mode, their all-electric range is assumed to be 50 km and the share of electric driving is assumed to be 60%. The price for electricity is USD 0.13/kWh and USD 0.04/kWh is added to account for charging infrastructure costs.
As battery prices decline, BEVs become cheaper to operate than ICE vehicles. PHEVs already have lower TCO than ICE vehicles where fuel prices are high, even with high battery costs.
Battery prices of around USD 100/kWh are necessary for BEV cars with 200 km range to be cost competitive with a conventional ICE vehicle at a fuel price of USD 0.8/L and 18 000 km/year mileage. The cost parity threshold falls to USD 50/kWh for BEVs with 400 km range, in the same
PAGE | 167
IEA. All rights reserved.