


Global EV Outlook 2019 |
4. Electric vehicle life-cycle GHG emissions |
Detailed assessment
Life-cycle GHG emissions: drivers and potential for emissions reduction
The balance of GHG emissions due to vehicle manufacturing and fuel production and use varies depending on the powertrain. Typically, GHG emissions in the vehicle cycle, i.e. components manufacturing, assembly, disposal and recycling,7 of electric powertrains are higher in EVs than for ICE vehicles. The fuel cycle GHG performance of ICE vehicles versus electric powertrains can vary widely based on the carbon intensity of the supplied electricity. Additionally, these observations vary depending on battery size, location of battery plants (due to the characteristics of battery assembly and the supply chains of battery materials), vehicle size and mileage driven. This section discusses results based on variations of these parameters. Figure 4.2 shows the comparative assessment of five powertrains for a mid-size car with the characteristics set out in the Methodology section. It also reflects on variability of results that comes with comparisons of different car sizes.
Figure 4.2. Comparative life-cycle GHG emissions of a global average mid-size car by powertrain, 2018
t CO2-eq |
|
|
|
|
|
|
|
|
|
Variability relative |
|
|
Effect of larger |
||||||
45 |
|
|
|
|
|
|
|
|
|
|
|
|
|
to vehicle size |
|
|
battery (+ 200 km) |
||
40 |
|
|
|
|
|
|
|
|
|
|
|
|
|
|
|
|
|
|
Tank-to-wheel fuel |
|
|
|
|
|
|
|
|
|
|
|
|
|
|
|
|
|
|
||
|
|
|
|
|
|
|
|
|
|
|
|
|
|
|
|
||||
|
|
|
|
|
|
|
|
|
|
|
|
|
|
|
|
|
|
||
35 |
|
|
|
|
|
|
|
|
|
|
|
|
|
|
|
|
|
|
cycle |
|
|
|
|
|
|
|
|
|
|
|
|
|
|
|
|
|
|
Well-to-tank fuel |
|
30 |
|
|
|
|
|
|
|
|
|
|
|
|
|
|
|
|
|
|
|
|
|
|
|
|
|
|
|
|
|
|
|
|
|
|
|
|
|
||
|
|
|
|
|
|
|
|
|
|
|
|
|
|
|
|
|
|
||
25 |
|
|
|
|
|
|
|
|
|
|
|
|
|
|
|
|
|
|
cycle |
|
|
|
|
|
|
|
|
|
|
|
|
|
|
|
|
|
|
Vehicle cycle - |
|
|
|
|
|
|
|
|
|
|
|
|
|
|
|
|
|
|
|
||
20 |
|
|
|
|
|
|
|
|
|
|
|
|
|
|
|
|
|
|
|
|
|
|
|
|
|
|
|
|
|
|
|
|
|
|
|
|
|
||
|
|
|
|
|
|
|
|
|
|
|
|
|
|
|
|
|
|
||
|
|
|
|
|
|
|
|
|
|
|
|
|
|
|
|
|
|
batteries (200 km) |
|
15 |
|
|
|
|
|
|
|
|
|
|
|
|
|
|
|
|
|
|
|
|
|
|
|
|
|
|
|
|
|
|
|
|
|
|
|
|
|
Vehicle cycle - |
|
|
|
|
|
|
|
|
|
|
|
|
|
|
|
|
|
|
|
||
10 |
|
|
|
|
|
|
|
|
|
|
|
|
|
|
|
|
|
|
|
|
|
|
|
|
|
|
|
|
|
|
|
|
|
|
|
|
|
||
|
|
|
|
|
|
|
|
|
|
|
|
|
|
|
|
|
|
||
|
|
|
|
|
|
|
|
|
|
|
|
|
|
|
|
|
|
assembly, disposal |
|
|
|
|
|
|
|
|
|
|
|
|
|
|
|
|
|
|
|
|
|
5 |
|
|
|
|
|
|
|
|
|
|
|
|
|
|
|
|
|
|
and recycling |
|
|
|
|
|
|
|
|
|
|
|
|
|
|
|
|
||||
0 |
|
|
|
|
|
|
|
|
|
|
|
|
|
|
|
|
|
|
Vehicle cycle - |
|
|
|
|
|
|
|
|
|
|
|
|
|
|
|
|
|
|
||
|
|
|
|
|
|
|
|
|
|
|
|
|
|
|
|
|
|
||
|
|
|
|
|
|
|
|
|
|
|
|
|
|
|
|
|
|
components and |
|
|
ICE |
HEV |
PHEV |
BEV |
FCEV |
|
|
||||||||||||
|
|
|
|
||||||||||||||||
|
|
|
|
fluids |
|||||||||||||||
|
|
|
|
|
|
|
|
|
|
|
|
|
|
|
|
|
|
|
|
Notes: All ICE powertrains (i.e. including in the HEV and the PHEV categories) are assumed to be powered by gasoline.
Vehicle assumptions: vehicle power 110 kW, battery size 38 kWh (BEV with a range of 200 km) or 10.5 kWh (PHEV with a range of 55 km); battery chemistry NMC111; annual mileage 15 000 km; vehicle lifetime ten years. (Assumptions applicable to all powertrains unless otherwise stated). Fuel economy assumptions (WLTP values): ICE - 6.8 litres of gasoline equivalent per 100 kilometres (Lge/100 km); HEV - 5.1 Lge/100 km; BEV - (200 km range) 19.0 kWh/100 km (2.1 Lge/100 m), BEV (400 km range) 19.4 kWh/100 km (2.1 Lge/100 km); FCEV 3.7 Lge/100 km. PHEV is a combination of ICE and BEV fuel economies, with 40% total mileage driven on gasoline and 60% on electricity (this utility factor is in line with WLTP provisions). The fuel economy of BEVs and PHEVs (for the electric powertrain) include a 5% penalty for charging losses.
Power supply CO2 intensity in the fuel cycle is 518 g CO2-eq/kWh. This is representative of the 2018 global average and includes transmission and distribution system losses.
The hydrogen production pathway considered here is steam methane reforming from natural gas (well-to-wheel emissions intensity of 3.2 kg CO2- eq/Lge), which is representative of the majority of current hydrogen production.
The ranges suggested by the sensitivity bars represent the case of small cars (lower bound) and of large cars (upper bound) – for BEVs, the lower bound of the sensitivity bar represents a small car with a 200 km range, and the upper bound represents a large car with a 400 km range. All parameters relative to small and large cars are detailed in the notes to Figure 4.4.
Sources: IEA analysis based on ANL (2018); IEA (2019a),(2019b).
The fuel cycle is today the largest component of life-cycle GHG emissions of all powertrains; with a GHG intensity of electricity generation equal to the global average, EVs, FCEVs and HEVs all exhibit similar performance.
7 In this assessment, recycling of a number of materials is accounted for directly in each material production process, based on their global average recycling rates, according to the GREET model methodology. There is no specific accounting for lithium-ion battery recycling.
PAGE | 155
IEA. All rights reserved.

Global EV Outlook 2019 |
4. Electric vehicle life-cycle GHG emissions |
Figure 4.2 provides several key insights:
•For all powertrains, the fuel cycle GHG emissions (orange and yellow in the figure) over the vehicle lifetime outweigh vehicle cycle GHG emissions (dark blue, light blue and green in the figure): vehicle manufacturing, disposal and recycling ranges between 18% (ICE) and 36% (BEV 200 km and FCEV) of the vehicle life-cycle emissions. For a BEV with 400 km range though, this share goes up to 43%.
•BEVs and PHEVs emit the least life-cycle GHG emissions (around 25 tonnes of carbon-
dioxide equivalent [t CO2-eq]) given the assumptions of this analysis, although those of BEVs can be slightly higher with longer drive range. Results may also vary depending on the location of the battery production given differences in the characteristics of battery assembly and the supply chains of battery materials. The GHG emissions performance of
FCEVs and HEVs is slightly higher at 27.5 t CO2-eq, with global average ICE vehicles emissions at 35 t CO2-eq.
•In a BEV with 200 km range, lithium-ion (Li-ion) batteries (38 kWh size) with currently available cathode chemistries (NMC 111) account for a third of vehicle cycle emissions and 12% of vehicle and fuel cycle emissions combined. If one assumes a doubling of the range, and thus brings battery capacity to 78 kWh, Li-ion batteries account for slightly half of vehicle cycle emissions and 23% of vehicle and fuel cycle emissions combined.
The relative importance of each life-cycle stage (represented by a different colour in Figure 4.2) can vary widely by powertrain type. As do the areas with the largest potential for CO2 emissions reduction for each type of powertrain.
For ICE vehicles and HEVs, the tank-to-wheel fuel stage accounts for the majority of life-cycle GHG emissions. They can only be reduced by efficiency improvements (provided that they overcome eventual increases in vehicle manufacturing emissions) and indirect measures, such as on-board carbon capture or fuel switching that compensates for tank-to-wheel CO2 emissions (e.g. sustainable biofuels or electro-fuels). The vehicle cycle (components manufacturing, vehicle assembly, disposal and recycling) is the second-largest contributor to ICE and HEV life-cycle emissions.
For BEVs and FCEVs, which are zero-emissions at the tailpipe and for which with 2018 global average carbon intensity of power generation, the wheel-to-well aspect of life-cycle emissions accounts for 56-64%. So reducing the amount of CO2 emissions due to fuel use is the area with the largest GHG mitigation potential. This can be achieved through vehicle efficiency improvements8 and CO2 emissions reduction in electricity or hydrogen production.9 In addition, a reduction in the carbon intensity of electricity generation could also provide GHG emissions
8Electric powertrains are currently three-to-five-times more efficient than internal combustion engines, depending on vehicle weight. Auxiliaries, such as air conditioning can significantly affect the vehicle electricity use. Better vehicle insulation or heat pumps can help in that regard. For example, upcoming model SEAT El-Born is fitted with a heat pump that can, according to the manufacturer, save 60 km of range (SEAT, 2019) and the Audi Q4 e-tron model uses a body paint specifically designed to reflect certain light waves to help keep the interior cool and minimise needs for air conditioning (Audi, 2019). Both models are expected to start production in 2020.
9The variability of the carbon intensity of electricity generation across countries (as low as 9 g CO2-eq/kWh in Norway in 2017) suggests that there is a demonstrated capacity and a viable margin to do so. Carbon capture, utilisation and storage (CCUS) may also make this viable for power generation from fossil fuels. For hydrogen, lowering emissions requires the use of electrolysis and renewable electricity, or the use of steam methane reforming (SMR) coupled with CCUS. However, hydrogen produced by electrolysis requires a significantly higher amount of electricity compared with battery storage, and SMR with CCUS only allows for partial GHG emission reductions.
PAGE | 156
IEA. All rights reserved.

Global EV Outlook 2019 |
4. Electric vehicle life-cycle GHG emissions |
reductions in the vehicle cycle (as processes would be using lower carbon electricity), if the region of use of the vehicle and of manufacturing are the same, or if the emissions reduction from electricity production are global.
Plug-in hybrids can tap the GHG emissions reduction potential areas as for HEVs and BEVs, plus the additional lever of increasing the share of electric driving.
As stated, an important aspect of the analysis of life-cycle emissions is the difference in driving ranges provided by the various vehicle types. A comparison of FCEVs and BEVs illustrates this well. It shows that doubling the drive range of the BEV to the same level of the FCEV diminishes the life-cycle emissions benefit of the BEV relative to the FCEV at the current global average carbon intensity of electricity generation.10 This also holds for a similar comparison with a conventional ICE vehicle. Boosting the BEV to a hypothetical 600-800 km drive range, which likely can be achieved by a benchmark global average ICE vehicle, would significantly cut into the current life-cycle emissions benefit of BEVs, as the required larger battery size would increase the life-cycle emissions associated with the battery roughly proportionally. In practice, such drive ranges are not currently considered among BEV manufacturers, not least to contain BEV costs. Nonetheless, this consideration underscores that rightsizing the drive range of BEVs is important not only for their cost competitiveness, but also from the point of view of their climate benefits. Addressing this while ensuring no loss in convenience for the customer (through e.g. optimised and fast charging infrastructure) will be important moving forward.
Effect of mileage on EV life-cycle GHG emissions
The vehicle cycle of BEVs results in higher GHG emissions than for an equivalent ICE vehicle. However, as BEVs emit less than ICE vehicles in the use stage, BEVs provide GHG emissions savings on a life-cycle basis after a period of use of the vehicle. Relative to an equivalent gasoline ICE vehicle, a mid-size BEV, with a 200 km drive range and assuming the global average CO2 emissions intensity of electricity generation as well as average battery manufacturing GHG emissions of 75 kg CO2-eq/kWh, starts saving CO2 on a life-cycle basis when it has been driven more than 25 000 km (Figure 4.3). For a BEV with a longer range (400 km), the break-even mileage is 60 000 km under the same assumptions. For a vehicle driving 15 000 km annually, used as a central estimate in this analysis, a BEV provides net GHG emissions savings after 1.5 to 4 years of use, depending on the driving range.
With a carbon intensity of electricity generation equal to the 2018 global average, a BEV travelling 150 000 km over ten years (as per our central estimate) saves 23-33% of GHG emissions over its life cycle compared with an ICE vehicle. Savings are maximised for high mileage drivers, at around 32-38% less GHG emissions than an equivalent ICE vehicle at 250 000 km, provided that this does not require a battery replacement. At this mileage level, two-thirds to three-quarters of the vehicle's emissions are from the fuel, as opposed to vehicle manufacturing, disposal and recycling. This is particularly relevant for fleet vehicles or taxis which will cover higher-than-average distances over their lifetime. Moreover, CO2 savings due to mileages that are higher than our central estimate go hand-in-hand with fuel cost savings and an early cost-parity, on a total cost of ownership basis. A lower CO2 intensity
10 The BEV being powered by electricity and the FCEV being powered by hydrogen stemming from steam methane reforming from natural gas.
PAGE | 157
IEA. All rights reserved.

Global EV Outlook 2019 |
4. Electric vehicle life-cycle GHG emissions |
of power generation would naturally shorten the time needed for a break-even with an ICE vehicle and it would boost savings at high mileages.11
A key difference from BEVs is that HEVs have vehicle cycle emissions (manufacturing, disposal and recycling) very similar to those of an ICE vehicle (Figure 4.2). HEVs start saving CO2 in the first year of driving (i.e. under 15 000 km), but do not surpass 20% GHG savings compared to an equivalent ICE vehicle in the long-run.
Figure 4.3. Life-cycle GHG emissions savings of a mid-size BEV and HEV relative to a global average mid-size ICE vehicle by lifetime vehicle mileage, 2018
60% |
|
|
|
|
|
|
BEV - range |
40% |
|
|
|
|
|
|
|
|
|
|
|
|
|
200 km |
|
20% |
|
|
|
|
|
|
BEV - range |
|
|
|
|
|
|
|
|
0% |
|
|
|
|
|
|
400 km |
|
|
|
|
|
|
|
|
-20% |
0 |
50 000 |
100 000 |
150 000 |
200 000 |
250 000 |
HEV |
-40%
-60%
-80%
-100%
Mileage over vehicle lifetime (km)
Notes: Assumptions are the same as for Figure 4.2, except for mileage which is a variable here. Average carbon intensity of electricity generation in the fuel cycle is 518 g CO2-eq/kWh.
Sources: IEA analysis based on ANL (2018); IEA Mobility Model (2019b); IEA (2019a).
Life-cycle GHG emissions savings begin at 25 000 for a 200 km BEV and 60 000 km for a 400 km BEV. HEVs start saving GHG emissions compared with a global average mid-size ICE vehicle after 10 000 km. HEVs save about 20% of the lifetime GHG emissions; with the current global average carbon intensity of the electricity mix, BEVs can save up to 30-40%, relative to a global average mid-size ICE vehicle.
Effect of vehicle size and power on EV life-cycle emissions
For all powertrains, vehicle size has an impact on life-cycle GHG emissions.
•A large ICE car (200 kW) with 150 000 km total mileage emits 58% more than a small size, 70 kW ICE car over its lifetime (44 t CO2-eq versus 28 t CO2-eq).
•For BEVs, assuming a 39 kWh battery (for a range of 200 km) and 200 kW power for a large version, and a 36 kWh battery (for a range of 200 km) and 70 kW power for a small version, the difference is 17% (25 t CO2-eq versus 21 t CO2-eq) (Figure 4.4).
For ICE vehicles, the vehicle cycle (manufacturing, disposal and recycling) and the fuel cycle (use phase) are in roughly equal parts responsible for this difference in emissions, meaning that manufacturing a larger ICE (implying larger material quantities), and the greater amount
11 The effect of power system CO2 intensity on vehicle life-cycle emissions is shown in Figure 4.5 and Figure 4.6.
PAGE | 158
IEA. All rights reserved.
Global EV Outlook 2019 |
4. Electric vehicle life-cycle GHG emissions |
of energy needed to move it, drive emissions up to a similar extent. The picture is different for BEVs, for which larger vehicle manufacturing makes up for the large majority of additional emissions compared to a small BEV,12 although the increase in emissions is smaller than for ICE vehicles.
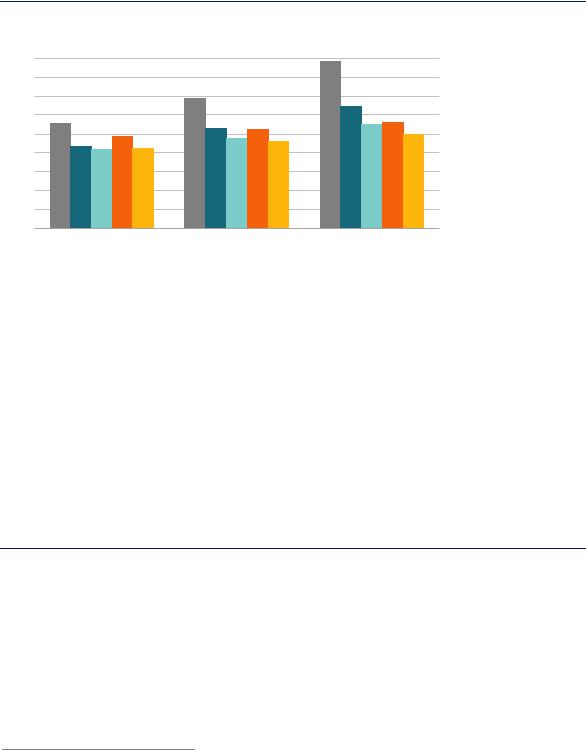
Figure 4.4. Life-cycle GHG emissions of BEVs, PHEVs and ICEs by market segment, 2018
t CO2-eq
45
40
35
30
25
20
15
10
5
0
Small car |
Mid-size car |
Large car |
 ICE
ICE
 PHEV (30% e-driving)
 PHEV (70% e-driving)
 BEV (400 km range)
 BEV (200 km range)
Notes: This figure is based on the life-cycle GHG emissions assessment of vehicles in small, mid-size and large market segments, coupled with three sizes and power ratings: 70 kW (1 100 kg), 110 kW (1 450 kg) and 200 kW (1 900 kg) (the relationship between vehicle size and power is shown in (IEA, 2019a)). For the mid-size BEV, PHEV and ICE vehicle, the assumptions are the same as in Figure 4.2. The vehicle specific assumptions for the small and the large vehicles are:
Small: battery size 36 kWh (BEV with a range of 200 km), or 75 kWh (BEV with a range of 400 km), or 10 kWh (PHEV with a range of 55 km); WLTP fuel economy 5.5 Lge/100 km (ICE); 18.2 kWh/100 km (2.0 Lge/100 km) (BEV 200 km range); 18.6 kWh/100 km
(2.0 Lge/100 km) (BEV 400 km range). The fuel economy of BEVs and PHEVs (for the electric powertrain) include a 5% penalty for charging losses.
Large: battery size 39 kWh (BEV with a range of 200 km), or 80 kWh (BEV with a range of 400 km), or 11 kWh (PHEV with a range of 55 km); on-road fuel economy 8.9 Lge/100 km (ICE); 19.6 kWh/100 km (2.1 Lge/100 km) (BEV 200 km range); 20.0 kWh/100 km (2.2 Lge/100 km) (BEV 400 km range). The fuel economy of BEVs and PHEVs (for the electric powertrain) include a 5% penalty for charging losses.
For all segments, PHEV is a combination of ICE and BEV fuel economies, either with 70% total mileage driven on gasoline and 30% on electricity (30% e-driving) or 30% total mileage driven on gasoline and 70% on electricity (70% e-driving). Annual vehicle mileage is 15 00 km and vehicle lifetime is ten years. Carbon intensity of electricity generation in the fuel cycle is 518 g CO2-eq/kWh.
Sources: IEA analysis based on ANL (2018); IEA (2019a),(2019b).
GHG emissions savings from electric vehicles increase with size relative to equivalent ICE vehicles. In absolute terms, small vehicles emit less GHGs than large ones with the same powertrain.
Figure 4.4 shows that over a ten-year vehicle lifetime with 15 000 km annual mileage, the larger the vehicle size, the larger the difference in GHG emissions between an EV (BEV or PHEV) and an ICE car. In other words, in the large vehicle segment, EVs save more GHG emissions compared to ICE vehicles: at the 2018 global average carbon intensity of electricity generation, a small BEV saves 12-24% (depending on BEV range) of GHG emissions over its lifetime compared to a similar size ICE vehicle, and a large one saves around 40%. In the current context of rising sales of vehicles with large powertrains in all markets (IEA, 2019a), this observation suggests that increasing electrification of large vehicle models and targeted
12 The reason for this is the much lower sensitivity of BEV fuel use to changes in vehicle weight in comparison with ICE vehicles, as highlighted in Fuel Economy in Major Car Markets (IEA, 2019a). This is mostly due to the higher efficiency of electric powertrains and the effect of regenerative breaking.
PAGE | 159
IEA. All rights reserved.