


Global EV Outlook 2019 |
3. Outlook |
|
|
|
|
privately owned. Given the large energy requirements of both mediumand heavy-freight trucks (roughly 1 and 1.4 kWh/km, respectively), it is also likely that, similar to buses, trucks will mostly rely on fast chargers.
Electricity demand estimated for trucks by 2030 is about 13 TWh in the New Policies Scenario and 72 TWh in the EV30@30 Scenario. The daily energy demand requirements depend on the allelectric range of the vehicles and the characteristics of their batteries. If PHEVs trucks have allelectric daily mileages of 30 km for medium-freight trucks and 15 km for heavy-freight trucks, and BEVs have a range of 150 km, a usage frequency of five days a week and 50 weeks a year would be compatible with all-electric mileages of 7 500 and 3 750 km/year for medium and heavy PHEV trucks, and a maximum of 37 500 km for BEV trucks. With a 50 kW charger, PHEVs would need less than one hour to charge, and BEVs would need two to three hours. With increasing charging power capacity, these times would reduce, allowing more opportunities to share charging infrastructure.
Assuming caps of 10 PHEV trucks and 10 BEV medium trucks (with a 165 kW average power by 2030) per charger and five BEV heavy trucks to be sharing chargers with a 450 kW power rate, and taking into account of the energy demand from the electric truck uptake considered in the scenarios would lead to 140 000 chargers deployed in the New Policies Scenario and 350 000 in the EV30@30 Scenario, mostly for medium trucks. The power capacity coupled with these chargers in 2030 would reach 27 GW in the New Policies Scenario and 67 GW in the EV30@30 Scenario.
Publicly accessible chargers for LDVs
Publicly accessible charging points for LDVs are complementary to private chargers. They are important enablers of the use of BEVs over long distances and by consumers that are interested in EVs but do not have the possibility to rely on private (home or workplace) chargers.
The projections for publicly accessible LDV chargers in both the New Policies and the EV30@30 scenarios build on the following considerations:
•Most countries are assumed to have a ratio of publicly accessible chargers converging towards one charger per ten electric LDVs in 2030, i.e. the value indicated by the targets in China and the European Union.
•The share of fast chargers per EV is stable and equal to a value of 10% of the distance driven by EVs in all global regions except China and Japan, where the same share is assumed equal to 20%. The 10% value is consistent with the much higher frequency of use of home and
workplace chargers observed in the Nordic region (IEA, 2018c) and larger amounts of kWh per charge in the case of fast charging.24 The higher value for China and Japan is based on higher reliance on fast charging that is observed today.
•Publicly accessible slow chargers are level 2 chargers with an average power rate increasing from about 3.7 kW today to 7.4 kW in 2030.
•DC fast chargers are subject to a progressive upgrade to ultra-fast and high power chargers, from an average of 50 kW in 2018 to almost 100 kW by 2030. If the capacity utilisation of
24 The 10% value is also used in a recent study developed for the European Commission (Cambridge Econometrics, 2018).
PAGE | 138
IEA. All rights reserved.
Global EV Outlook 2019 |
3. Outlook |
fast chargers remains unchanged, this leads to a significant reduction in the number of publicly accessible fast charging points. This also brings down the share of fast chargers in the total of all publicly accessible chargers.25
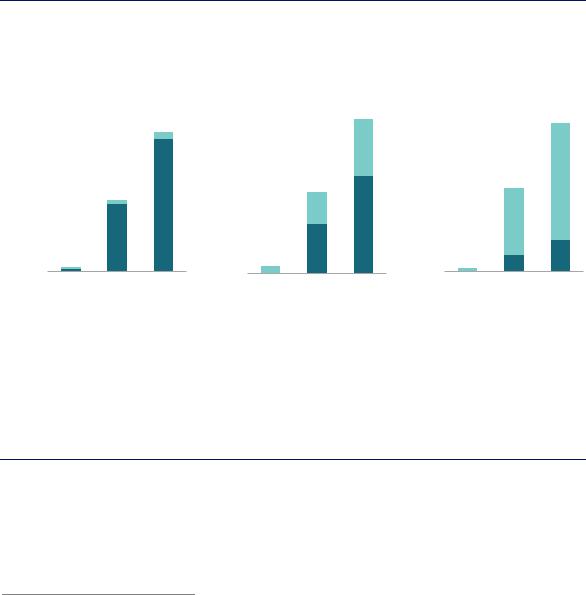
In the New Policies Scenario, the number of publicly accessible chargers for LDVs resulting from these considerations increases from about 560 000 today to 10 million in 2030 (Figure 3.7). Slow chargers account for about 95% of the total publicly accessible charging infrastructure in 2030, up from 70% today. The power capacity of LDV public charging infrastructure reaches 113 GW in 2030, with fast chargers accounting for almost 40% of the total. The total energy consumed by publicly accessible chargers for LDVs is 70 TWh in 2030, with fast chargers delivering about 80% of it.
Figure 3.7. Number of publicly accessible chargers for LDVs, relative power capacity and energy demand by scenario, 2018-30
|
|
|
Number of chargers |
|
|
|
Power capacity |
|
|
|
Energy demand |
|
|||||||||||||||
ofNumberchargers (millions) |
25 |
|
|
|
|
|
|
|
powerChargingcapacity (GW) |
250 |
|
|
|
|
|
|
|
|
Energysupplied (TWh) |
150 |
|
|
|
|
|
|
|
|
|
|
|
|
|
|
|
|
|
|
|
|
|
|
|
|
|
||||||||||
|
|
|
|
|
|
|
|
|
|
|
|
|
|
|
|
|
|
|
|||||||||
5 |
|
|
|
|
|
|
|
50 |
|
|
|
|
|
|
|
|
30 |
|
|
|
|
|
|
|
|||
|
20 |
|
|
|
|
|
|
|
|
200 |
|
|
|
|
|
|
|
|
|
120 |
|
|
|
|
|
|
|
|
15 |
|
|
|
|
|
|
|
|
150 |
|
|
|
|
|
|
|
|
|
90 |
|
|
|
|
|
|
|
|
10 |
|
|
|
|
|
|
|
|
100 |
|
|
|
|
|
|
|
|
|
60 |
|
|
|
|
|
|
|
|
|
|
|
|
|
|
|
|
|
|
|
|
|
|
|
|
|
|
|
|
|||||||
|
|
|
|
|
|
|
|
|
|
|
|
|
|
|
|
|
|
|
|
|
|
||||||
|
0 |
|
|
|
|
|
|
|
|
0 |
|
|
|
|
|
|
|
|
|
0 |
|
|
|
|
|
|
|
|
|
2018 |
|
2030 |
|
2030 |
|
|
|
|
|
|
|
|
|
|
|
|
2018 |
|
2030 |
|
2030 |
|
|||
|
|
|
|
|
|
|
2018 |
|
2030 |
|
2030 |
|
|
|
|
|
|
|
|||||||||
|
|
|
|
|
|
|
|
|
|
|
|
|
|
|
|
||||||||||||
|
|
|
|
|
|
|
|
|
|
|
|
|
|
|
|
|
|
|
|||||||||
|
|
|
|
|
NPS |
|
EV30@30 |
|
|
|
|
|
NPS |
|
EV30@30 |
|
|
|
|
|
NPS |
|
EV30@30 |
|
|||
|
|
|
|
|
|
|
|
|
Slow chargers |
|
|
|
|
|
|
Fast chargers |
|
|
|
|
|
||||||
|
|
|
|
|
|
|
|
|
|
|
|
|
|
|
|
|
|
|
|
||||||||
|
|
|
|
|
|
|
|
|
|
|
|
|
|
|
|
|
|
|
|
||||||||
Notes: NPS = New Policies Scenario. The assumptions used for the development of these projections are included in the main text. Source: IEA analysis developed with the IEA Mobility Model (IEA, 2019a).
The number of public LDV chargers reaches 10 million in the New Policies Scenario and almost 20 million in the EV30@30 Scenario in 2030, of which most are slow chargers. The power capacity is more evenly distributed among the two types of publicly accessible chargers. Fast chargers serve the bulk of electricity demand.
In 2030, the number of publicly accessible LDV chargers is 7% of the total number of LDV chargers (public and private). The power capacity of publicly accessible LDV chargers accounts for 12% of the total and about 18% of the total electricity consumed by EVs.
25 With a constant share of electricity delivered through fast chargers, an increase in power rating for fast chargers translates into a reduction of the amount of publicly accessible fast chargers that serve the EV fleet, if compared with a situation where the increase in the average power rating of the fast chargers does not take place. With a 10% occupancy rate for a fast charger, a 10% share of the distance driven by one EV in Europe could be satisfied by either one 50 kW fast charger for 150 cars, one 175 kW fast charger for 500 cars or one 350 kW fast charger for 1 000 cars. Similar results are indicated in the analysis developed for the European Commission (Cambridge Econometrics, 2018).
PAGE | 139
IEA. All rights reserved.