

2. GENERAL ENERGY POLICY
National Grid plc is a British multinational electricity and gas utility company with activities in the United Kingdom and North-eastern United States. National Grid Electricity Transmission owns and operates the electricity networks and partly the interconnectors. National Grid Gas plc owns and operates the gas transmission network (from terminals to distributors), known as the National Transmission System (NTS). As of 1 April 2019, within the National Grid Group a new Electricity System Operator (ESO) entity (NGESO) is being established, that is legally separate from the transmission owner, NG Electricity Transmission. The separation will allow the ESO to play a more proactive role in managing an increasingly flexible electricity system that can realise benefits for consumers.
Supply and demand trends
Once a large producer of oil and gas from the North Sea, UK oil and gas production has declined significantly since the peak year of 2000. The United Kingdom became a net importer of natural gas in 2004, of crude oil in 2005, and of oil products in 2012.
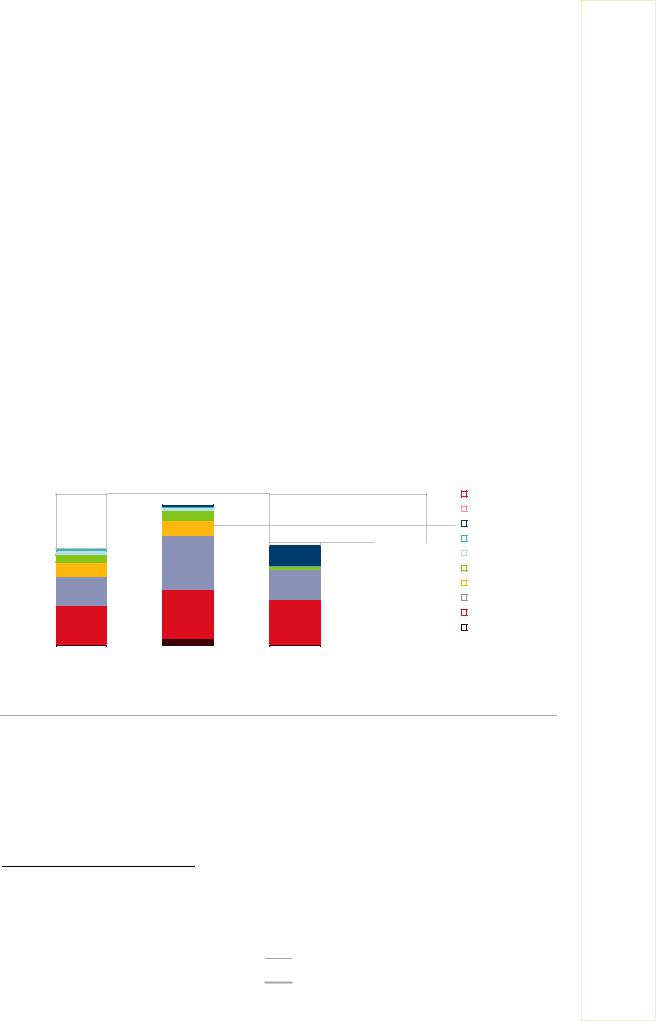
The United Kingdom’s energy system is characterised by a large share of natural gas and oil, which in 2017 accounted for 73% of the total primary energy supply (TPES2) and 70% of domestic energy production (Figure 2.2).
Figure 2.2 Overview of the United Kingdom’s energy balance, 2017
200 |
Mtoe |
|
|
|
|
|
|
|
|
|
|||
|
|
|
|
|
|
|
|
|
|
|
|
Bunkering fuel* |
|
|
|
|
|
|
|
|
|
|
|
|
|
|
|
|
|
|
|
|
|
|
|
|
|
|
|||
|
|
|
|
|
|
|
Transformation, losses and |
|
|
Heat |
|||
|
|
|
|
|
|
|
|
|
|||||
150 |
|
|
Imports |
|
|
international bunkering |
|
|
Electricity |
||||
|
|
|
|
|
|
|
|
||||||
|
|
|
|
|
|
|
|
|
|
|
|
|
Other renewables** |
|
|
|
|
|
|
|
|
|
|
|
|
|
|
|
|
|
|
|
|
|
|
|
|
|
|
|
|
100 |
|
|
|
|
|
|
|
|
Commercial |
|
|
Wind |
|
|
|
|
|
|
|
|
|
|
|
||||
|
|
|
|
|
|
|
|
|
|
||||
|
|
|
|
|
|
|
|
Transport |
|
|
|
Bioenergy and waste |
|
|
|
|
|
|
|
|
|
|
|
|
|||
|
|
|
|
|
|
|
|
|
|
|
|||
|
|
|
|
|
|
|
|
|
|
|
|
|
Nuclear |
50 |
|
|
|
|
|
|
|
|
Residential |
|
|
|
Natural gas |
|
|
|
|
|
|
|
|
|
|
|
|||
|
|
|
|
|
|
|
|
|
|
|
Oil |
||
|
|
|
|
|
|
|
|
|
|
|
|
|
|
|
|
|
|
|
|
|
|
|
|
|
|
|
|
0 |
|
|
|
|
|
|
|
|
Industry |
|
|
|
Coal |
|
|
|
|
|
|
|
|
|
|
|
|||
|
|
|
|
|
|
|
|
|
|
|
|||
|
|
|
|
|
|
|
|
|
|
|
|
||
|
|
|
|
|
|
|
|
|
|
|
|
|
|
|
|
Production |
TPES |
TFC (by fuel) |
TFC (by sector) |
|
|
|
|||||
|
|
|
|
|
|
||||||||
Natural gas and oil dominate the energy supply in the United Kingdom, and increasingly are imported as domestic production has declined.
*Bunkers includes international aviation and marine bunker fuel. Not included in the definition of TPES.
**Other renewables includes hydropower, geothermal energy, and solar energy.
Source: IEA (2019), World Energy Balances 2019 First edition (database), www.iea.org/statistics/.
Nuclear energy is the third largest energy source, with 10% of TPES and 21% of total electricity generation in the United Kingdom. The amount of nuclear energy is expected to decrease, as most of the existing nuclear power stations will close during the 2020s
2 TPES is made up of production + imports – exports - international marine and aviation bunkers ± stock changes. This equals the total supply of energy that is consumed domestically, either in transformation (e.g. power generation and refining) or in final use.
21
ENERGY INSIGHTS
IEA. All rights reserved.
2. GENERAL ENERGY POLICY
and only one new plant is being developed (Hinkley Point C). Renewable energy sources (RES) are rapidly increasing with a notable strong growth in biofuels and waste, solar photovoltaics (PV), and wind power.
The transport sector was the largest energy-consuming sector in 2017, at a third of total final consumption (TFC3), followed by the residential, industrial, and commercial sectors. Natural gas, oil, and electricity are the main energy sources, with a total share of 94% of TFC. Oil dominates the energy consumption in the transport and industry sectors, whereas natural gas is the most important fuel in the residential and commercial sectors. International bunkers for aviation and maritime transport make up a large part of domestic oil consumption (but are counted as an export).
Primary energy supply
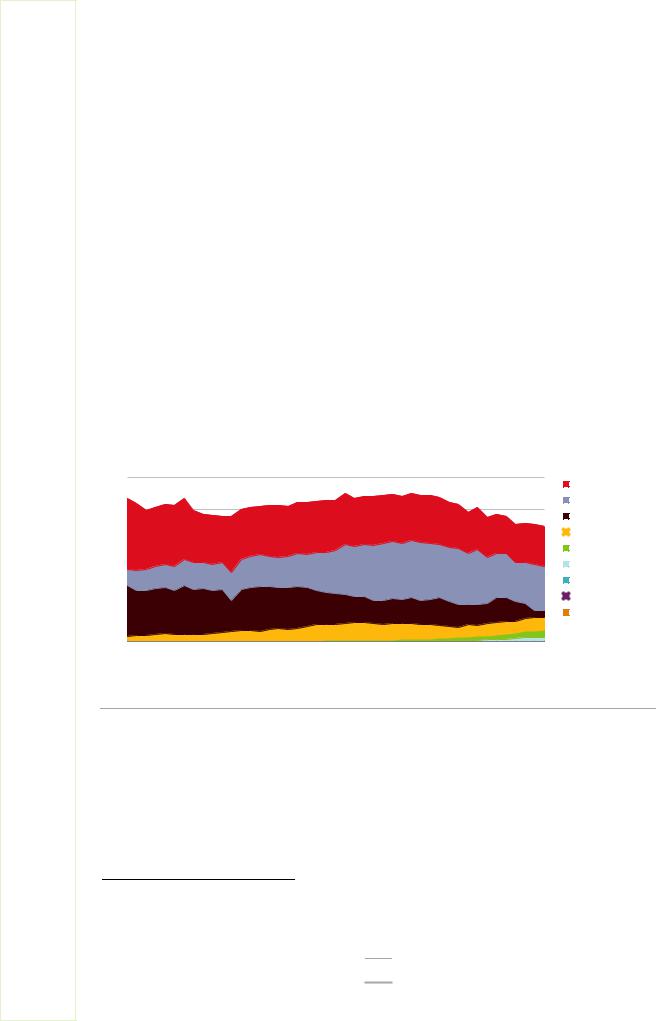
In 2017, the United Kingdom’s TPES was 176 million tonnes of oil-equivalent (Mtoe), a decline since its peak of 225 Mtoe in 2003 (Figure 2.3). In 2017, fossil fuels accounted for 78% of the TPES, a decrease from 90% in 2007. All fossil fuels have declined over the past decade, particularly the use of coal fell by more than half. The share of renewables in the TPES has increased from 2% in 2007 to 10% in 2017. By international comparison, the United Kingdom is placed at the IEA median when it comes to the share of fossil fuels in the TPES (Figure 2.4).
Figure 2.3 TPES by source, 1973-2017
250 |
Mtoe |
|
|
|
|
|
|
|
|
|
|
Oil |
|
|
|
|
|
|
|
|
|
|
|
|
|
200 |
|
|
|
|
|
|
|
|
|
|
|
Natural gas |
|
|
|
|
|
|
|
|
|
|
|
Coal |
|
|
|
|
|
|
|
|
|
|
|
|
|
|
150 |
|
|
|
|
|
|
|
|
|
|
|
Nuclear |
|
|
|
|
|
|
|
|
|
|
|
Bioenergy and waste |
|
|
|
|
|
|
|
|
|
|
|
|
|
|
100 |
|
|
|
|
|
|
|
|
|
|
|
Wind |
|
|
|
|
|
|
|
|
|
|
|
Hydro* |
|
|
|
|
|
|
|
|
|
|
|
|
|
|
50 |
|
|
|
|
|
|
|
|
|
|
|
Geothermal* |
|
|
|
|
|
|
|
|
|
|
|
Solar* |
|
|
|
|
|
|
|
|
|
|
|
|
|
|
0 |
|
|
|
|
|
|
|
|
|
|
|
|
1973 |
1977 |
1981 |
1985 |
1989 |
1993 |
1997 |
2001 |
2005 |
2009 |
2013 |
2017 |
|
The TPES decreased by 17% in the past decade, with the decline in coal, oil, and natural gas supply, whereas biofuels and other renewables are increasing.
* Negligible.
Note: The sudden decrease in coal supply in 1984 was due to the miners’ strike of 1984-85. Source: IEA (2019), World Energy Balances 2019 First edition (database), www.iea.org/statistics/.
3 TFC is the final consumption of energy (electricity, heat, and fuels, such as natural gas and oil products) by end users, but does not include the transformation sector (e.g. power generation and refining).
22
IEA. All rights reserved.
2. GENERAL ENERGY POLICY
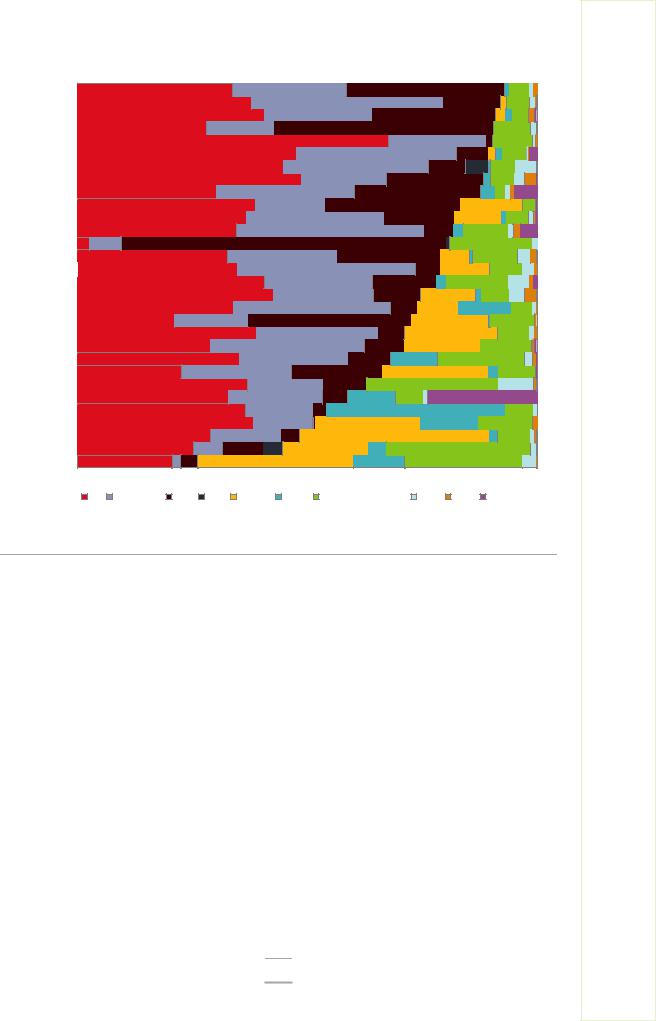
Figure 2.4 Breakdown of TPES in IEA member countries, 2017
Australia |
|
|
|
|
|
Netherlands |
|
|
|
|
|
Japan |
|
|
|
|
|
Poland |
|
|
|
|
|
Luxembourg |
|
|
|
|
|
Mexico |
|
|
|
|
|
Ireland |
|
|
|
|
|
Greece |
|
|
|
|
|
Turkey |
|
|
|
|
|
Korea |
|
|
|
|
|
United States |
|
|
|
|
|
Italy |
|
|
|
|
|
Estonia |
|
|
|
|
|
Germany |
|
|
|
|
|
Unitedited KingdomKingdom |
|
|
|
|
|
Portugal |
|
|
|
|
|
Spain |
|
|
|
|
|
Canada |
|
|
|
|
|
Czech Republic |
|
|
|
|
|
Belgium |
|
|
|
|
|
Hungary |
|
|
|
|
|
Austria |
|
|
|
|
|
Slovak Republic |
|
|
|
|
|
Denmark |
|
|
|
|
|
New Zealand |
|
|
|
|
|
Norway |
|
|
|
|
|
Switzerland |
|
|
|
|
|
France |
|
|
|
|
|
Finland |
|
|
|
|
|
Sweden |
|
|
|
|
|
0% |
20% |
40% |
60% |
80% |
100% |
Oil |
Natural gas Coal |
Peat Nuclear |
Hydro Bioenergy and waste |
Wind Solar |
Geothermal |
The United Kingdom’s share of fossil fuels in TPES is around the median among IEA countries, after a gradual decline of fossil fuel supplies over the past decade.
* Estonia’s coal is represented by oil shale.
Source: IEA (2019), World Energy Balances 2019 First edition (database), www.iea.org/statistics/.
Energy production
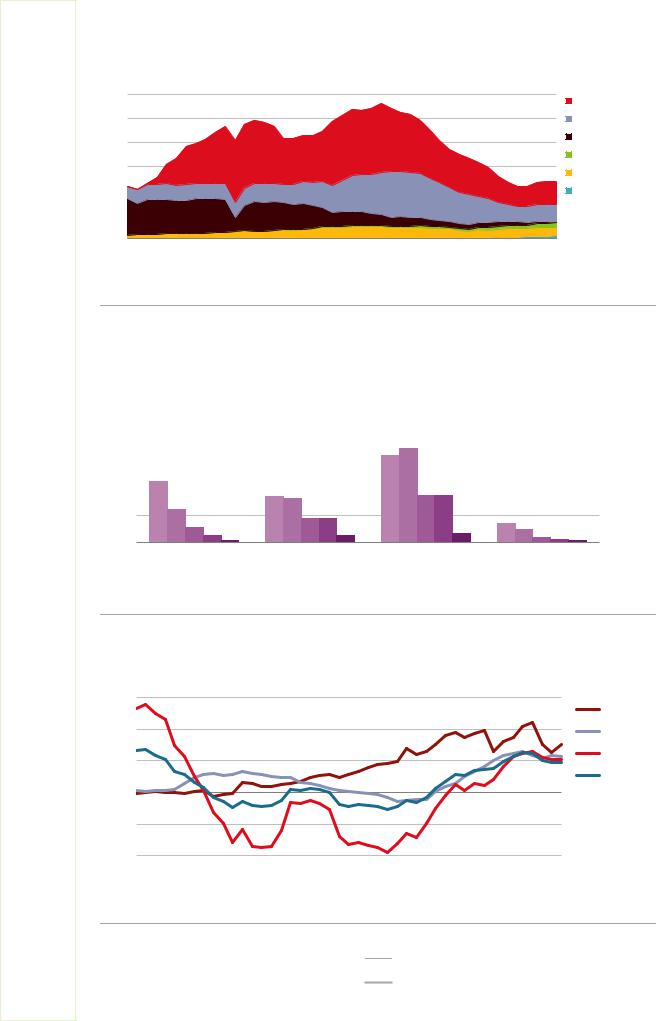
In 2017, the United Kingdom’s total energy production was 120 Mtoe, which saw a 57% decrease since the peak of 282 Mtoe in 1999 because of a decline in oil and gas production (Figure 2.5). Oil production fell by 39% over a decade and gas production dropped by 45%. Meanwhile, the country’s renewable energy production more than tripled from 5 Mtoe in 2007 to 16 Mtoe in 2017. Today, oil accounts for 40% and natural gas for 30%, with the remainder coming from nuclear (15%), biofuels and waste (8%), wind (4%), coal (2%), solar (1%), and hydro (0.4%). Domestic coal production in the United Kingdom has fallen over the past four decades and many mines have closed (Figure 2.6). In 2015, hard coal mining ended.
The significant drop in energy production made the United Kingdom more dependent on energy imports (Figure 2.7). During the decade 2007-17, natural gas and oil net imports more than doubled. The trend has been reversed over the three years 2014-17, as crude oil and gas production increased by 14% and thereby stabilised the import dependency. Coal demand has dropped significantly in recent years, both in industry and in power generation (Figure 2.6). The overall energy import dependency has declined from 50% in 2013 to 38% in 2017.
23
ENERGY INSIGHTS
IEA. All rights reserved.
2. GENERAL ENERGY POLICY
Figure 2.5 Energy production by source, 1973-2017
300 |
Mtoe |
|
Oil |
||
|
||
250 |
Natural gas |
|
200 |
Coal |
|
Biofuels and waste |
||
150 |
||
Nuclear |
||
|
||
100 |
Other renewables* |
50 |
|
|
|
|
|
|
|
|
|
|
|
0 |
|
|
|
|
|
|
|
|
|
|
|
1973 |
1977 |
1981 |
1985 |
1989 |
1993 |
1997 |
2001 |
2005 |
2009 |
2013 |
2017 |
Total energy production dropped by 57% from the peak in 1999 due to the sharp fall in oil and gas production, although production has picked up slightly in recent years.
* Includes wind, hydro, solar and geothermal.
Source: IEA (2019), World Energy Balances 2019 First edition (database), www.iea.org/statistics/.
Figure 2.6 Share of coal in different energy metrics, 1977-2017
100% |
Share of coal |
|||
|
|
|
1977 |
|
|
|
|
||
|
|
|
||
|
|
|||
80% |
|
|
|
1987 |
|
|
|||
|
|
|||
60% |
|
|
1997 |
|
|
||||
|
||||
|
|
|
2007 |
|
|
|
|
||
|
|
|
||
|
|
|||
40% |
|
|
|
2017 |
|
|
|||
|
|
|||
20% |
|
|
|
0% |
|
|
|
Domestic energy production |
TPES |
Electricity generation |
TFC |
The share of coal in electricity generation and the coal production significantly decreased in the past decade.
Source: IEA (2019), World Energy Balances 2019 First edition (database), www.iea.org/statistics/.
Figure 2.7 Energy import dependency by source, 1973-2017
120%
|
|
|
|
|
|
|
|
|
|
|
Coal |
80% |
|
|
|
|
|
|
|
|
|
|
Natural gas |
40% |
|
|
|
|
|
|
|
|
|
|
Oil |
|
|
|
|
|
|
|
|
|
|
|
|
|
|
|
|
|
|
|
|
|
|
|
Total energy |
0% |
|
|
|
|
|
|
|
|
|
|
|
-40% |
|
|
|
|
|
|
|
|
|
|
|
-80% |
|
|
|
|
|
|
|
|
|
|
|
1973 |
1977 |
1981 |
1985 |
1989 |
1993 |
1997 |
2001 |
2005 |
2009 |
2013 |
2017 |
Falling domestic production has made the United Kingdom more dependent on oil and gas imports, although the total import dependency has declined since 2013.
Source: IEA (2019), World Energy Balances 2019 First edition (database), www.iea.org/statistics/.
24
IEA. All rights reserved.