


10. NATURAL GAS
The Keuper Gas Storage Project would consist of up to 19 cavities. In March 2017, the project by INEOS received the Secretary of State for BEIS’s Development Consent Order.
The Islandmagee gas storage project in County Antrim, Northern Ireland, would have a capacity of 500 mcm. This project has received partial funding under the European Union’s “Connecting Europe Facility” programme.
Liquefied natural gas
GB has three LNG import terminals: Isle of Grain in Kent (owned by NGG with a capacity of 56 mcm/d), South Hook, and Dragon LNG in Milford Haven. Owned by the BG Group and Petronas, Dragon has a capacity of 21 mcm/d, whereas South Hook has a capacity of 58 mcm/d and is owned by Qatar Petroleum, the majority shareholder, Exxon Mobil, and Total. Amid declining production and difficult-to-build gas storage, LNG import terminals can provide a strong flexibility. The market is interested in providing gas to the GB market. NGG’s ten-year network development plan (NGG, 2017) contains 11 LNG projects; however, these have not received a FID. It is expected that US LNG will also arrive in the United Kingdom in the coming years.
Policy framework and markets
The GB gas market is considered one of the most liquid gas markets in the world with a robust gas infrastructure and diverse supplies. UK energy and climate policies support a role for gas in power generation. but pave the way for a lower contribution in residential heating. The UK Clean Growth Strategy, adopted in October 2017, confirmed the United Kingdom’s decision to maintain the CPF after 2021 at the current level, to phaseout coal power by 2025, increase the support for low-carbon electricity generation (renewables and nuclear), upgrade energy efficiency in buildings and industry, and roll out low-carbon heating and transport solutions. In recent years, gas use has made inroads in power generation, with the start of the CPF, among other factors.
To-date, the capacity market (CM) has secured over 5.4 gigawatts of new build capacity for delivery between 2018/19 and 2021/22. This includes a new combined cycle gas turbine (CCGT) plant (Kings Lynn), a new open cycle gas turbine plant (Spalding), and a significant number of small-scale gas engines. However, only one new plant, Carrington CCGT (800 megawatts) was commissioned in 2017.
The role of gas in the heating sector is uncertain as policies are in place to support lowcarbon heat solutions. In the longer term, under all scenarios gas demand in the United Kingdom will decline, according to NGG.
Gas regulation
The regulatory and policy framework that governs the GB gas market is set out by EU and UK (and transposed EU) legislation, licences (which the Office of Gas and Electricity Markets [Ofgem] grants to energy market participants), and industry codes that underpin the functioning of the energy market and define the conditions of access to different market and infrastructure segments.
The 1986 Gas Act was amended in April 2017 by the Electricity and Gas Regulations 2017, which implement the so-called EU Third Package. In 2014, Ofgem completed the
189
ENERGY SECURITY
IEA. All rights reserved.
10. NATURAL GAS
Gas Security of Supply Significant Code Review to consider changes to gas codes to reduce the likelihood, severity, and duration of a gas supply emergency. A final policy decision was announced in February 2014 and changes to cash-out arrangements came into effect on 1 October 2015.
In the entry-exit system, around 260 gas shippers buy gas from producers and importers and arrange for its transportation and sell gas to suppliers. Licensed suppliers buy gas from shippers and compete to supply both domestic and business consumers. Storage and LNG operations do not require a licence in GB.
In GB, access to storage is based on negotiated third-party access (TPA) for the Hornsea storage site, whereas the other six smaller operational storage facilities are not regulated. The LNG facilities have to offer regulated TPA; however, all three LNG facilities have an exemption from the regulated TPA under Section 19C of the Gas Act.
Gas transmission and distribution networks are regulated under Ofgem’s performancebased revenue framework, with price controls based on the “Revenue = Incentives + Innovation + Outputs” or RIIO model (RIIO T1 and RIIO GD1), which began on 1 April 2013 will run until 31 March 2021.
Transmission charges are composed by the entry and exit charges of the transmission owner – a capacity and commodity component (levied on actual gas flows) to recover the costs incurred for the provision and maintenance of transmission network assets – and the system operator charge – commodity charges levied on the basis of gas flows at entry and exit points to recover the costs incurred by the day-to-day operations on the transmission system. Transmission entry and exit capacity charges are levied on all network users, which include storage sites, LNG terminals, and beach terminals, in a non-discriminatory way. Transmission owner and system operator commodity charges are not levied on gas storage users.
Wholesale gas market
GB has a gas day-ahead and forward market that is highly liquid with an annually total traded volume of 1 853 bcm and an annual churn rate of 23 in 2017 (Ofgem, 2018a); exchange-based trading alone accounted for 58% of the traded volume. Great Britain also has an intraday market – the on-the-day commodity trading market.
The wholesale gas market has one price for gas irrespective of where the gas comes from. This is called the National Balancing Point (NBP) price of gas. In 2017, the average day-ahead gas price was the highest since the 2014 low at 45 pence/therm, up from 35 pence/therm in 2016, but much below gas record prices in 2013 (68 pence/therm). Rising NBP prices since 2014 have provided a strong incentive for gas flows from the continent to the Great Britain (GB) market.
In 2016, 142 licensed entities traded in the NBP market. Of these companies, 120 traded continuously over the year, and 22 entered and exited the platform over the period, which suggests that entry and exit is not difficult. Concentration is also low for the ownership of total supply capacity and trading activity between gas shippers at the NBP. For total supplies, the Herfindahl-Hirschman Index (HHI) of concentration is 744, below the threshold of 1 000 that would suggest a concentrated market and potential competition concerns (Ofgem, 2018b). For end users, the wholesale costs made up 39% of the gas bill, whereas network costs accounted for 25%, environmental and social costs for 1%, and the remainder from the supply pre-tax margin (9%) and 20% operating costs and other services (6%) (Ofgem, 2018a).
190
IEA. All rights reserved.
10. NATURAL GAS
Retail gas market
The retail gas market of around 23.2 million domestic gas consumers is largely controlled by the former monopoly British Gas (31%) and the five large vertically integrated electricity suppliers (EDF Energy, E.ON UK, RWE Npower, SSE, and Scottish Power) which hold equal shares of around 9-10%, besides 58 small and medium-sized gas suppliers that account for 20% of the total (Ofgem, 2018a). Incumbent suppliers thus supplied 78% of the retail gas market in 2017, down from 83% in 2016. A particular feature of the GB market, 49 suppliers offer both electricity and gas in the domestic retail market, besides seven gas-only and four electricity-only suppliers. The industrial segment has more independent suppliers than the domestic segment (households).
In terms of competition in the retail market, GB gas markets are concentrated with a HHI of around 1 400 for domestic and small business consumers in 2017 and 1 130 for large industry clients. Supplier switching rates are on the rise and were 18.6%, with consumers switching away from the six large suppliers. According to Ofgem, 58% of customers that switched during 2017 moved to smaller and medium suppliers, which took around 17 days on average (Ofgem, 2018a).
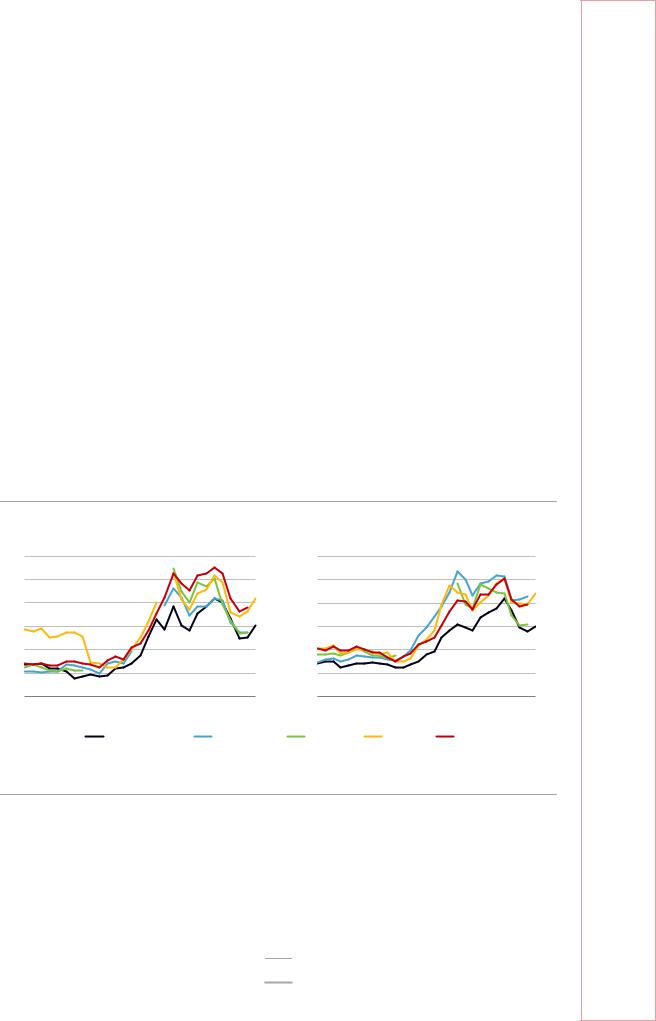
According to IEA data, the retail gas price for industry and households has declined in recent years in the United Kingdom, similarly to that in other peer countries (Figure 10.7) and UK gas prices are relatively low by international comparison.
Figure 10.7 Natural gas price trends in selected IEA member countries, 1990-2018
|
|
|
Industry |
|
|
|
|
|
Households |
|
|
|
|||
USD/MWh |
|
|
|
|
|
|
USD/MWh |
|
|
|
|
|
|
||
60 |
|
|
|
|
|
|
|
120 |
|
|
|
|
|
|
|
50 |
|
|
|
|
|
|
|
100 |
|
|
|
|
|
|
|
40 |
|
|
|
|
|
|
|
80 |
|
|
|
|
|
|
|
30 |
|
|
|
|
|
|
|
60 |
|
|
|
|
|
|
|
20 |
|
|
|
|
|
|
|
40 |
|
|
|
|
|
|
|
10 |
|
|
|
|
|
|
|
20 |
|
|
|
|
|
|
|
0 |
|
|
|
|
|
|
|
0 |
|
|
|
|
|
|
|
1990 |
1994 |
1998 |
2002 |
2006 |
2010 |
2014 |
2018 |
1990 |
1994 |
1998 |
2002 |
2006 |
2010 |
2014 |
2018 |
|
|
|
United Kingdom |
|
Netherlands |
Belgium |
|
Ireland |
|
France |
|
|
|||
UK gas prices followed the same trends but remained lower than in neighbouring countries, especially in households.
Source: IEA (2019b), Energy Prices and Taxes 2019, www.iea.org/statistics/.
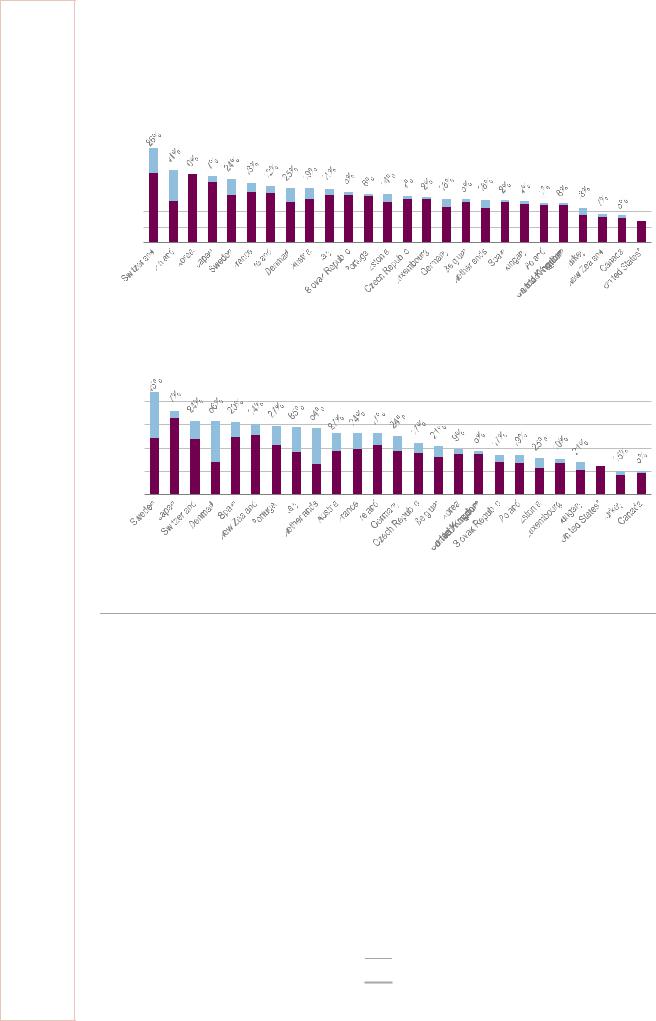
In 2017, United Kingdom had the fourth-lowest gas price for industry and eighth-lowest gas price for households among IEA countries. The share of tax in the UK natural gas price for industry and households each accounts for 3% and 5%, respectively, of the total price, which are among the lowest levels in the IEA comparison (Figure 10.8).
191
ENERGY SECURITY
IEA. All rights reserved.
10. NATURAL GAS
Figure 10.8 Natural gas prices in IEA member countries, 2017
|
|
|
|
|
|
|
|
|
|
|
|
|
|
|
|
|
|
|
|
|
|
|
Industry |
|||||||
|
|
|
|
|
|
|
|
|
|
|
|
|
|
|
|
|
|
|
|
|
|
|
|
|
|
|
|
|
|
|
70 |
USD/MWh |
|
|
|
|
|
|
|
|
|
|
|
|
|
|
|
|
|
|
Tax component |
||||||||||
|
|
|
|
|
|
|
|
|
|
|
|
|
|
|
|
|
|
|||||||||||||
|
|
|
|
|
|
|
|
|
|
|
|
|
|
|
|
|
|
|||||||||||||
|
|
|
|
|
|
|
|
|
|
|
|
|
|
|
|
|
|
|
|
|
|
|
|
|
|
|
|
|
|
|
60 |
|
|
|
|
|
|
|
|
|
|
|
|
|
|
|
|
|
|
|
|
|
|
|
|
|
|
|
|
|
|
|
|
|
|
|
|
|
|
|
|
|
|
|
|
|
|
|
|
|
|
|
|
|
|
|
|
|
|
|
|
|
50 |
|
|
|
|
|
|
|
|
|
|
|
|
|
|
|
|
|
|
|
|
|
|
|
|
|
|
|
|
|
|
|
|
|
|
|
|
|
|
|
|
|
|
|
|
|
|
|
|
|
|
|
|
|
|
|
|
|
|
|
|
|
40 |
|
|
|
|
|
|
|
|
|
|
|
|
|
|
|
|
|
|
|
|
|
|
|
|
|
|
|
|
|
|
|
|
|
|
|
|
|
|
|
|
|
|
|
|
|
|
|
|
|
|
|
|
|
|
|
|
|
|
|
|
|
30 |
|
|
|
|
|
|
|
|
|
|
|
|
|
|
|
|
|
|
|
|
|
|
|
|
|
|
|
|
|
|
|
|
|
|
|
|
|
|
|
|
|
|
|
|
|
|
|
|
|
|
|
|
|
|
|
|
|
|
|
|
|
20
10
0
|
|
Households |
|||
150 |
USD/MWh |
|
|
Tax component |
|
|
|
||||
|
|
||||
|
|
|
|
|
|
120
90
60
30
0
UK industry pays the fourth-lowest industry price, and the household price is ranked in the lower middle in comparison with other IEA countries.
* Tax information not available for the United States.
Notes: Data are not available for Australia, Greece, Mexico, and Norway (industry); Australia, Greece, Finland, Mexico, and Norway (household). USD/MWh = US dollars per megawatt hour.
Source: IEA (2018b), Energy Prices and Taxes 2018, www.iea.org/statistics/.
The Competition and Markets Authority (CMA) undertook an extensive study of the gas and electricity (energy) markets between June 2014 and June 2016. As explained in detail in Chapter on Electricity, the CMA found the wholesale market competitive. However, it judged the retail market as in poor performance. Customers were paying an average of British pounds (GBP) 1.4 bn a year more than they would in a truly competitive market. This was mainly attributed to a lack of switching activity, as twothirds of all customers remained on the default standard variable tariffs rather than switching to lower cost offers that were available in the market. In their final report, the CMA made a number of recommendations to improve the retail energy market, many of which either have been implemented by the government or are in the process of being implemented.
The government also agreed with the minority opinion in the CMA study that a temporary cap on tariffs would provide protection to consumers until competition was fully
192
IEA. All rights reserved.