

10. NATURAL GAS
Supply and demand
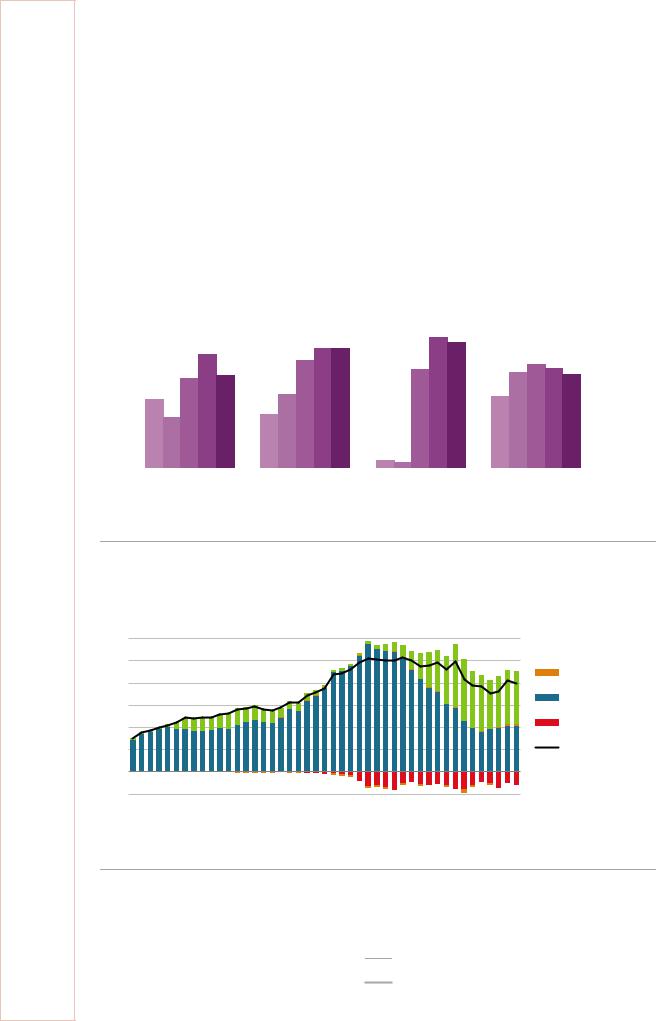
In 2017, natural gas accounted for 39% of TPES and 44% of electricity generation. However, natural gas consumption has gradually declined across all sectors (except for a revival in power generation since 2014), despite population and economic growth (Figure 10.1.) In 2017, the total gas consumption was 68 million tonnes of oil equivalent (Mtoe) (80 bcm), 17% lower than a decade previously. Increased efficiencies in heat use, which include greater levels of home insulation, and the rise in the deployment of renewable electricity generation explain this trend.
Figure 10.1 Share of natural gas in production, TPES, electricity mix, and total final energy consumption, 1977-2017
50% |
Share of natural gas |
|
|
|
|
|
|
|
|
|
|
|
|
|
1977 |
||
|
|
|
|
|
|
|||
|
|
|
|
|
||||
40% |
|
|
|
|
|
1987 |
||
|
|
|
|
|||||
|
|
|
|
|||||
|
|
|
|
|
|
1997 |
||
|
|
|
|
|
|
|||
|
|
|
|
|
||||
30% |
|
|
|
|
|
2007 |
||
|
|
|
|
|||||
|
|
|
|
|||||
|
|
|
|
|
|
2017 |
||
20% |
|
|
|
|
|
|||
|
|
|
|
|||||
|
|
|
|
|
|
|
||
|
|
|
|
|
|
|
||
10% |
|
|
|
|
|
|
|
|
|
|
|
|
|
|
|
||
0% |
|
|
|
|
|
|
|
|
Domestic energy production |
TPES |
Electricity generation |
TFC |
|||||
|
||||||||
The role of natural gas in the United Kingdom’s energy supply remains important, but gas usage declined across all sectors.
Source: IEA (2019a), World Energy Balances 2019 First edition (database), www.iea.org/statistics/.
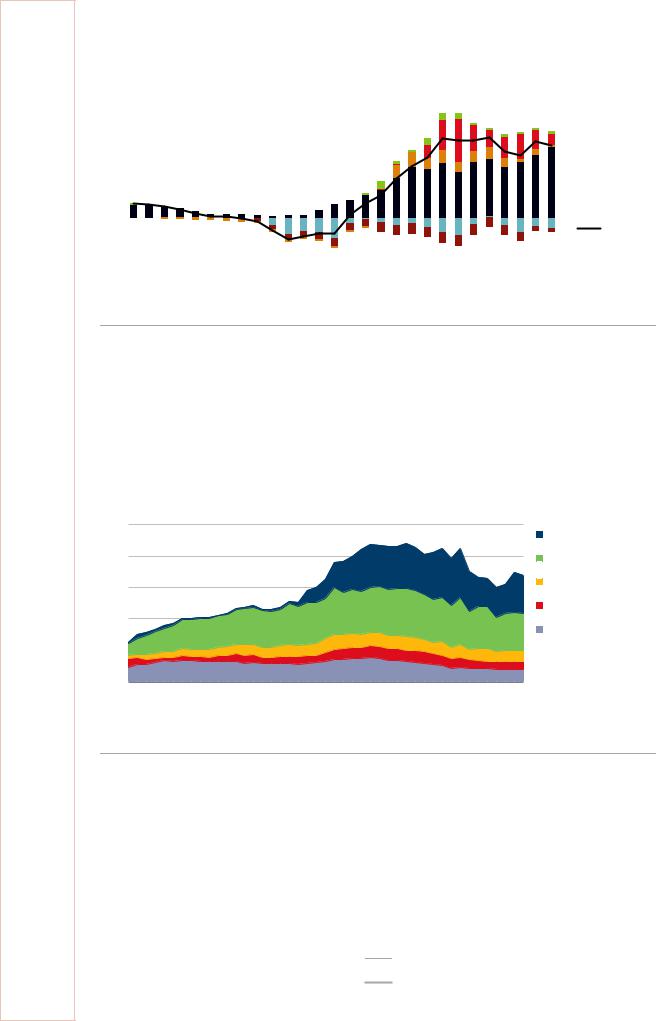
Figure 10.2 Natural gas supply by source, 1973-2017
bcm
120
 Imports
100 |
|
|
|
|
|
|
|
|
|
|
Stock changes |
80 |
|
|
|
|
|
|
|
|
|
|
|
|
|
|
|
|
|
|
|
|
|
Indigenous production |
|
60 |
|
|
|
|
|
|
|
|
|
|
|
|
|
|
|
|
|
|
|
|
|
|
|
40 |
|
|
|
|
|
|
|
|
|
|
Exports |
|
|
|
|
|
|
|
|
|
|
|
|
20 |
|
|
|
|
|
|
|
|
|
|
Inland consumption |
0 |
|
|
|
|
|
|
|
|
|
|
|
-20 |
|
|
|
|
|
|
|
|
|
|
|
1973 |
1977 |
1981 |
1985 |
1989 |
1993 |
1997 |
2001 |
2005 |
2009 |
2013 |
2017 |
Gas imports increased rapidly in the early 2000s as domestic production declined. In recent years imports have stabilised thanks to the maximised recovery of domestic gas.
Source: IEA (2019a), World Energy Balances 2019 First edition (database), www.iea.org/statistics/.
182
IEA. All rights reserved.

10. NATURAL GAS
Domestic gas production
The United Kingdom’s natural gas production increased gradually in the 1990s to peak at 115.4 bcm in 2000, after which it fell rapidly to 36.4 bcm in 2013. From 2014 it picked up slightly to 42.1 bcm in 2017 (Figure 10.2). Despite production decline, the United Kingdom is one of the three major gas-producing nations within IEA-Europe along with Norway and the Netherlands. The majority of the domestic production of natural gas comes from the North Sea and the East Irish Sea. The development of the Laggan field near the Shetland Islands is one of the main contributors to the recent increase.
Recovery has improved in the UK Continental Shelf (UKCS) since 2014 thanks to a strategic reorientation of the upstream policy. The United Kingdom set out a strategy to maximise the economic recovery of petroleum from the UKCS, based on the UKCS Maximising Recovery Review (Wood, 2014). Based on the recommendations of the review, the government established an independent regulator, the Oil and Gas Authority (OGA), which is now a government company with new competences under the Energy Act 2016 to enable Maximising Economic Recovery (MER) Strategy of the UKCS hydrocarbons. OGA issued the MER UK Strategy in March 2016 and supports the costeffective decommissioning of offshore installations (UK Government, 2016).
Among the measures, the government abolished the petroleum revenue tax and cut the supplementary charge from 32% to 10%, and has supported seismic surveys in underexplored areas of the UKCS. Operators in the UKCS will be able to transfer part of their tax history when assets change hands to facilitate the transfer of late-life oil and gas assets. This will allow new investors to benefit from tax relief when assets are eventually decommissioned and help extend field life.
The OGA estimates that there are 279 bcm of proven and probable gas reserves left as at the end of 2017, of which 181 bcm are proven reserves (UK Government, 2018). There has been a steady decline in proven and probable reserves since 1994, initially associated with a higher rate of production.
Natural gas imports and exports
In line with the decline in domestic gas production, the United Kingdom has increased its gas imports since 2002. In 2017, the United Kingdom’s imported 47.4 bcm – an increase of almost 40% on 2007 import levels (Figure 10.3). The United Kingdom has been a net importer since 2004, and the increase in imports has been supported by the development of new interconnector pipelines and LNG import terminals.
In 2017, the main gas imports to the United Kingdom came through pipelines from Norway (75% of total imports) and the Netherlands and Belgium (10%), as well as shipped LNG from Qatar (13%). Imported gas by pipeline had volumes that ranged from 29.4 bcm to 40.4 bcm over the past decade. LNG imports have increased from 1.4 bcm in 2007 to 7.4 bcm in 2017.
The United Kingdom also exported 11.3 bcm in 2017, mainly to Belgium (71% of the total) and Ireland (15%). The overall exported volumes have increased from 2016, partly due to the increased export to Belgium.
183
ENERGY SECURITY
IEA. All rights reserved.
10. NATURAL GAS
Figure 10.3 Natural gas imports and exports by country, 1990-2017
60 |
|
bcm |
|
|
|
|
|
|
|
|
|
|
|
|
|
|
|
|
|
|
|
|
|
|
|
|
|
|
|
|
|
|
|
|
|
|
|
|
|
|
|
|
|
|
|
|
|
|
|
|
|
|
|
|
|
|
|
|
|
|
|
|
|
|
|
|
|
|
|
|
|
|
|
|
|
|
|
|
|
|
|
|
|
Other |
|
|
|
|
|
|
|
|
|
|
|
|
|
|
|
|
|
|
|
|
|
|
|
|
|
|
|
|
|
|
|
|
|
|
|
|
|
|
|
|
|
|
||
50 |
|
|
|
|
|
|
|
|
|
|
|
|
|
|
|
|
|
|
|
|
|
|
|
|
|
|
|
|
|
|
|
|
|
|
|
|
|
|
|
|
|
|
|
|
|
|
|
|
|
|
|
|
|
|
|
|
|
|
|
|
|
|
|
|
|
|
|
|
|
|
|
|
|
|
|
|
|
|
|
|
|
|
|
||
|
|
|
|
|
|
|
|
|
|
|
|
|
|
|
|
|
|
|
|
|
|
|
|
|
|
|
|
|
|
|
|
|
|
|
|
|
|
|
|
|
Qatar |
|
|
|
|
|
|
|
|
|
|
|
|
|
|
|
|
|
|
|
|
|
|
|
|
|
|
|
|
|
|
|
|
|
|
|
|
|
|
|
|
|
|
||
40 |
|
|
|
|
|
|
|
|
|
|
|
|
|
|
|
|
|
|
|
|
|
|
|
|
|
|
|
|
|
|
|
|
|
|
|
|
|
|
|
|
|
|
|
|
|
|
|
|
|
|
|
|
|
|
|
|
|
|
|
|
|
|
|
|
|
|
|
|
|
|
|
|
|
|
|
|
|
|
|
|
|
|
|
||
|
|
|
|
|
|
|
|
|
|
|
|
|
|
|
|
|
|
|
|
|
|
|
|
|
|
|
|
|
|
|
|
|
|
|
|
|
|
|
|
|
Netherlands |
|
|
|
|
|
|
|
|
|
|
|
|
|
|
|
|
|
|
|
|
|
|
|
|
|
|
|
|
|
|
|
|
|
|
|
|
|
|
|
|
|
|
||
30 |
|
|
|
|
|
|
|
|
|
|
|
|
|
|
|
|
|
|
|
|
|
|
|
|
|
|
|
|
|
|
|
|
|
|
|
|
|
|
|
|
|
|
|
|
|
|
|
|
|
|
|
|
|
|
|
|
|
|
|
|
|
|
|
|
|
|
|
|
|
|
|
|
|
|
|
|
|
|
|
|
|
|
|
||
|
|
|
|
|
|
|
|
|
|
|
|
|
|
|
|
|
|
|
|
|
|
|
|
|
|
|
|
|
|
|
|
|
|
|
|
|
|
|
|
|
Norway |
|
|
|
|
|
|
|
|
|
|
|
|
|
|
|
|
|
|
|
|
|
|
|
|
|
|
|
|
|
|
|
|
|
|
|
|
|
|
|
|
|
|
||
20 |
|
|
|
|
|
|
|
|
|
|
|
|
|
|
|
|
|
|
|
|
|
|
|
|
|
|
|
|
|
|
|
|
|
|
|
|
|
|
|
|
|
|
|
|
|
|
|
|
|
|
|
|
|
|
|
|
|
|
|
|
|
|
|
|
|
|
|
|
|
|
|
|
|
|
|
|
|
|
|
|
|
|
|
||
|
|
|
|
|
|
|
|
|
|
|
|
|
|
|
|
|
|
|
|
|
|
|
|
|
|
|
|
|
|
|
|
|
|
|
|
|
|
|
|
|
Ireland |
|
|
|
|
|
|
|
|
|
|
|
|
|
|
|
|
|
|
|
|
|
|
|
|
|
|
|
|
|
|
|
|
|
|
|
|
|
|
|
|
|
|
||
10 |
|
|
|
|
|
|
|
|
|
|
|
|
|
|
|
|
|
|
|
|
|
|
|
|
|
|
|
|
|
|
|
|
|
|
|
|
|
|
|
|
|
|
|
|
|
|
|
|
|
|
|
|
|
|
|
|
|
|
|
|
|
|
|
|
|
|
|
|
|
|
|
|
|
|
|
|
|
|
|
|
|
|
|
||
|
|
|
|
|
|
|
|
|
|
|
|
|
|
|
|
|
|
|
|
|
|
|
|
|
|
|
|
|
|
|
|
|
|
|
|
|
|
|
|
|
Belgium |
|
|
|
|
|
|
|
|
|
|
|
|
|
|
|
|
|
|
|
|
|
|
|
|
|
|
|
|
|
|
|
|
|
|
|
|
|
|
|
|
|
|
||
0 |
|
|
|
|
|
|
|
|
|
|
|
|
|
|
|
|
|
|
|
|
|
|
|
|
|
|
|
|
|
|
|
|
|
|
|
|
|
|
|
|
|
|
|
|
|
|
|
|
|
|
|
|
|
|
|
|
|
|
|
|
|
|
|
|
|
|
|
|
|
|
|
|
|
|
|
|
|
|
|
|
|
|
|
||
|
|
|
|
|
|
|
|
|
|
|
|
|
|
|
|
|
|
|
|
|
|
|
|
|
|
|
|
|
|
|
|
|
|
|
|
|
|
|
|
|
Net trade |
|
|
|
|
|
|
|
|
|
|
|
|
|
|
|
|
|
|
|
|
|
|
|
|
|
|
|
|
|
|
|
|
|
|
|
|
|
|
|
|
|
|
||
-10 |
|
|
|
|
|
|
|
|
|
|
|
|
|
|
|
|
|
|
|
|
|
|
|
|
|
|
|
|
|
|
|
|
|
|
|
|
|
|
|
|
|
|
|
|
|
|
|
|
|
|
|
|
|
|
|
|
|
|
|
|
|
|
|
|
|
|
|
|
|
|
|
|
|
|
|
|
|
|
|
|
|
|
|
|
|
-20 |
|
|
|
|
|
|
|
|
|
|
|
|
|
|
|
|
|
|
|
|
|
|
|
|
|
|
|
|
|
|
|
|
|
|
|
|
|
|
|
|
|
|
1990 |
1993 |
1996 |
1999 |
2002 |
2005 |
2008 |
|
|
2011 |
2014 |
2017 |
|
|
|||||||||||||||||||||||||||||
After a rapid increase, net imports of natural gas have stabilised at around 40 bcm, with most gas supplied by pipeline from Norwegian gas fields and LNG from Qatar.
Source: IEA (2018a), Natural Gas Information 2018, www.iea.org/statistics/.
Largest gas consumption in heat and power sector
The total natural gas consumption peaked at 87.8 Mtoe in 2004. Since that peak, consumption declined until 2014, after which it recovered slightly to 67.8 Mtoe or 79.5 bcm in 2017 (Figure 10.4).
Figure 10.4 Gas consumption by sector, 1973-2017
100 |
Mtoe |
|
|
|
|
|
|
|
|
|
|
Heat and power generation |
|
|
|
|
|
|
|
|
|
|
|
|
|
80 |
|
|
|
|
|
|
|
|
|
|
|
Residential |
60 |
|
|
|
|
|
|
|
|
|
|
|
Commercial* |
|
|
|
|
|
|
|
|
|
|
|
|
|
40 |
|
|
|
|
|
|
|
|
|
|
|
Other energy** |
|
|
|
|
|
|
|
|
|
|
|
Industry*** |
|
|
|
|
|
|
|
|
|
|
|
|
|
|
20 |
|
|
|
|
|
|
|
|
|
|
|
|
0 |
|
|
|
|
|
|
|
|
|
|
|
|
1973 |
1977 |
1981 |
1985 |
1989 |
1993 |
1997 |
2001 |
2005 |
2009 |
2013 |
2017 |
|
Power generation and households account for over two-thirds of the total gas demand, and consumption has recovered slightly in recent years after a sharp decline.
*Commercial includes commercial and public services, agriculture, and forestry.
**Other energy includes the energy sector’s own consumption and losses in gas production and refineries.
***Industry includes non-energy consumption.
Note: TPES of natural gas by consuming sector.
Source: IEA (2019a), World Energy Balances 2019 First edition (database), www.iea.org/statistics/.
The largest consuming sectors are heat and power generation and the residential sector, each of which accounts for more than one-third of the total gas consumption. The consumption of gas in power and heat generation increased by 38% in 2013-17. A range of measures, which include the government’s introduction of the carbon price floor
184
IEA. All rights reserved.