


9. OIL
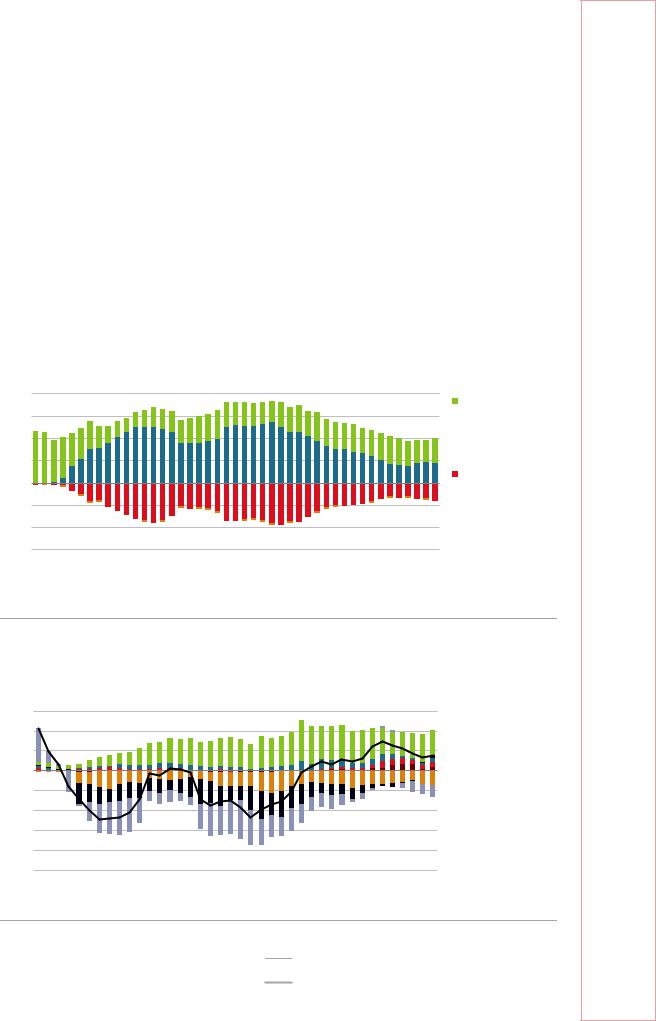
Figure 9.1 Share of oil in different energy metrics, 1977-2017
60% |
Share of oil |
|
|
|
|
|
|
|
|
|
|
|
|
|
1977 |
||
|
|
|
|
|
|
|||
50% |
|
|
|
|
|
|||
|
|
|
|
|||||
|
|
|
|
|
|
1987 |
||
|
|
|
|
|
||||
40% |
|
|
|
|
|
1997 |
||
|
|
|
|
|||||
|
|
|
|
|||||
|
|
|
|
|
|
2007 |
||
30% |
|
|
|
|
|
|||
|
|
|
|
|||||
|
|
|
|
|||||
|
|
|
|
|
|
2017 |
||
|
|
|
|
|
|
|||
20% |
|
|
|
|
|
|||
|
|
|
|
|||||
|
|
|
|
|
|
|
||
|
|
|
|
|
|
|
||
10% |
|
|
|
|
|
|
|
|
|
|
|
|
|
|
|
||
0% |
|
|
|
|
|
|
|
|
Domestic energy production |
TPES |
Electricity generation |
TFC |
|||||
|
||||||||
Domestic oil production has decreased over the past decades, while the shares of oil in TPES and TFC have remained relatively stable.
Note: TPES does not include bunkering fuel.
Source: IEA (2019a), World Energy Balances 2019 First edition (database), www.iea.org/statistics/.
Supply and demand
Production, import, and export
The United Kingdom has significant levels of domestic crude oil production – it ranks highest in the European Union and fourth among the International Energy Agency (IEA) member countries, after the United States, Canada, and Norway. However, the country’s oil production is on a long-term declining trend at an average rate of 6% per annum since its peak at 137 million tonnes (Mt) (2.8 million barrels per day [mb/d]) in 1999. Bucking the trend, thanks to government interventions and higher oil prices, recent production increased slightly to 46.5 Mt (1 mb/d) in 2017 from 40 Mt (0.8 mb/d) in 2014 (Figure 9.2), but in the longer run a further decline seems unavoidable due to the lack of new investments. Almost all UK oil is produced from offshore fields, mainly in the North Sea where petroleum development projects generally have long lead times. Despite the large drop over the past decades, in 2017 the United Kingdom’s domestic crude oil production still corresponded to around two-thirds of its total consumption and more than 70% of its refinery intake.
The latest estimates of the remaining recoverable hydrocarbon resources from the United Kingdom’s offshore resources is in the range of 10-20 billion barrels of oilequivalent, which could potentially sustain production for the next 20 years and beyond. Compared with historical oil and gas exploitation, to extract the remaining reserves is likely to be more technically challenging and therefore expensive. In response to this challenge, the government established the Oil and Gas Authority (OGA), with the objective to maximise economic recovery from the UK continental shelf (UKCS). In 2016, the OGA released the strategy for enhanced oil recovery (EOR) with a monitoring system to support the Maximising Economic Recovery (MER) Strategy (UK Government, 2016). The government also provided several packages of fiscal support and funding, including effectively abolishing the petroleum revenue tax and reducing the marginal rate of tax levied on company’s upstream profits from 81% to 40% to attract more upstream investments. A unique mechanism, the transferable tax history, was also introduced to
168
IEA. All rights reserved.
9. OIL
give companies that buy UK oil and gas fields greater certainty that they will be able to obtain tax relief to decommission the field at the end of its life.
The United Kingdom became a net importer of crude oil in late 2005 due to decreasing production; by 2017 its import dependency accounted for 36% with net imports of 571 kilobarrels per day (kb/d) (which includes both crude and products). As for its crude oil imports, Norwegian oil from pipelines in the North Sea represented around 44%, followed by Nigeria (8%), the Russia Federation (8%), and Algeria (8%) (Figure 9.3).
The United Kingdom is also producing fewer oil products in domestic refineries. In 2017, the gross refinery output was 60 Mt, down from 82 Mt in 2007. The United Kingdom became a net importer of refined products in 2013 for the first time – with a net 1.5 Mt (31 kb/d) that year, which increased to 10 Mt (210 kb/d) in 2017 (Figure 9.4). The United Kingdom has a well-developed infrastructure for the trade of oil products from a diverse range of countries. The largest trading partners are the Netherlands, Russia (mainly imports), Ireland (mainly exports), the United States, Sweden, and Belgium.
Figure 9.2 Crude oil supply by source, 1973-2017
200 |
Mt |
|
Import |
||
|
150
 Indigenous production
100
 Stock changes
50
Exports
0 -50 -100 -150
1973 |
1977 |
1981 |
1985 |
1989 |
1993 |
1997 |
2001 |
2005 |
2009 |
2013 |
2017 |
The United Kingdom’s oil production has decreased since 1999, and the country has become more dependent on imports of crude oil.
Source: IEA (2018a), Oil Information 2018, www.iea.org/statistics/.
Figure 9.3 Crude oil imports by country, 1978-2017
60 Mt |
|
|
|
|
|
|
|
|
|
|
|
Net imports |
|
|
|
|
|
|
|
|
|
|
|
|
|
|
|
40 |
|
|
|
|
|
|
|
|
|
|
|
|
|
20 |
|
|
|
|
|
|
|
|
|
|
|
|
|
0 |
|
|
|
|
|
|
|
|
|
|
|
|
|
- 20 |
|
|
|
|
|
|
|
|
|
|
|
|
|
- 40 |
|
|
|
|
|
|
|
|
|
|
|
|
|
- 60 |
|
|
|
|
|
|
|
|
|
|
|
|
|
- 80 |
|
|
|
|
|
|
|
|
|
|
|
Net exports |
|
- 100 1978 |
|
|
|
|
|
|
|
|
|
|
|
||
1981 |
1984 |
1987 |
1990 |
1993 |
1996 |
1999 |
2002 |
2005 |
2008 |
2011 |
2014 |
2017 |
|
 Other
Other
 Norway
 United States
 Russian
Federation
 Nigeria
 Algeria
 Netherlands
Crude oil imports have increased with the largest source consistently from Norway.
Source: IEA (2018a), Oil Information 2018, www.iea.org/statistics/.
169
ENERGY SECURITY
IEA. All rights reserved.
9. OIL
Figure 9.4 Oil product imports and exports by country, 1978-2017
20 |
Mt |
|
|
|
|
|
|
|
|
|
Net imports |
|
Other |
|
|
|
|
|
|
|
|
|
|
|
|
Sweden |
|||
|
|
|
|
|
|
|
|
|
|
|
|
|||
10 |
|
|
|
|
|
|
|
|
|
|
|
|
|
Ireland |
|
|
|
|
|
|
|
|
|
|
|
|
|
Netherlands |
|
|
|
|
|
|
|
|
|
|
|
|
|
|
|
Russian Federation |
0 |
|
|
|
|
|
|
|
|
|
|
|
|
|
United States |
|
|
|
|
|
|
|
|
|
|
|
|
|
|
Belgium |
- 10 |
|
|
|
|
|
|
|
|
|
|
|
|
|
Net trade |
|
|
|
|
|
|
|
|
|
|
|
|
|
|
|
- 20 1978 |
|
|
|
|
|
|
|
|
|
Net exports |
|
|
||
1981 |
1984 |
1987 |
1990 |
1993 |
1996 |
1999 |
2002 |
2005 |
2008 |
2011 |
2014 |
2017 |
||
The United Kingdom became a net importer of oil products in 2013, and has a well-diversified trade.
Source: IEA (2018a), Oil Information 2018, www.iea.org/statistics/.
Oil consumption
Oil consumption in the United Kingdom has declined over the past decade, but it has picked up slightly since 2013. In 2017, the total oil consumption was 71.0 Mt, a 9% decrease from 2007 (Figure 9.5). The transport sector is the largest oil-consuming sector at 72% of the total in 2016. Road transport accounts for more than half of the total consumption (54%) and aviation also accounts for a significant share (17%, more than doubled from the share of 8% in 1990). Oil use for transport has been relatively stable, while consumption in other sectors has declined.
The industry sector was a distant second at 15% of the total oil consumption. In the past decade, oil use in industry decreased by 22% in line with an overall decline in industrial energy consumption. The rest of the oil is used in the energy transformation sector (7%), the residential sector (3%) and the commercial sector (3%).
Figure 9.5 Oil consumption by sector, 1977-2017
100 |
Mt |
|
|
|
|
|
|
|
|
|
|
|
|
|
|
|
|
|
|
|
|
Transport |
|
|
|
|
|
|
|
|
|
|
|
|
|
80 |
|
|
|
|
|
|
|
|
|
|
Commercial* |
|
|
|
|
|
|
|
|
|
|
|
|
|
|
|
|
|
|
|
|
|
|
|
Residential |
60 |
|
|
|
|
|
|
|
|
|
|
Energy sectors |
|
|
|
|
|
|
|
|
|
|
|
|
40 |
|
|
|
|
|
|
|
|
|
|
Industry |
|
|
|
|
|
|
|
|
|
|
|
|
20 |
|
|
|
|
|
|
|
|
|
|
|
0 |
|
|
|
|
|
|
|
|
|
|
|
1977 |
1981 |
1985 |
1989 |
1993 |
1997 |
2001 |
2005 |
2009 |
2013 |
2017 |
|
Recent increase in oil consumption was mainly driven by the demand for transport fuels.
* Includes agriculture, forestry and fishing.
Note: Total consumption comprises refinery fuels, bunker backflows from the petrochemical sector, and international aviation (which does not appear in the TPES) and excludes international marine bunkers.
Source: IEA (2018a) Oil Information 2018, www.iea.org/statistics/.
170
IEA. All rights reserved.