


8. ELECTRICITY
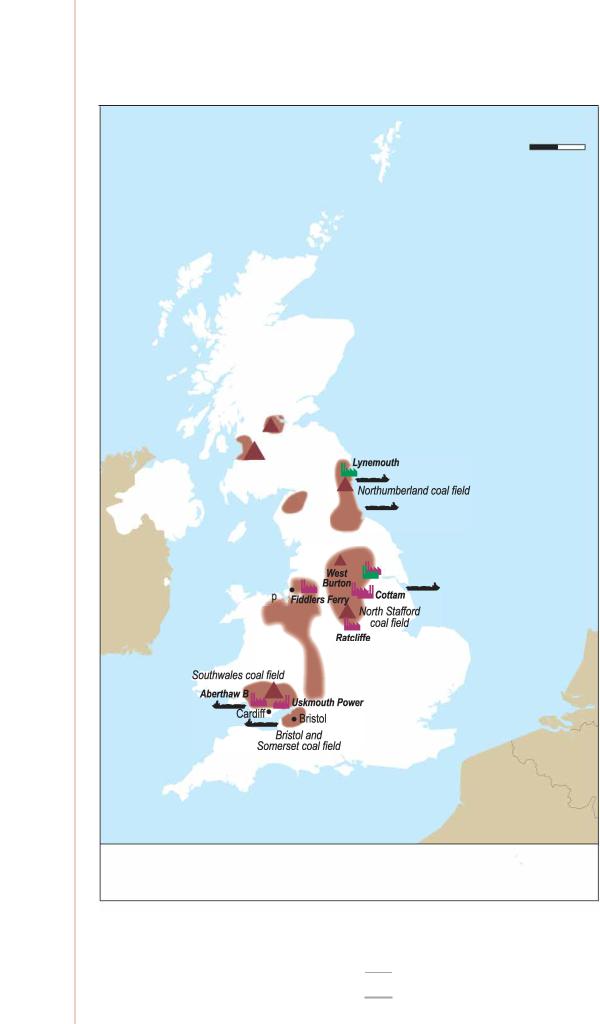
closed by the end of 2014 and 4.8 GW closed since. In 2016, three power stations closed (Rugeley, Ferrybridge, and Longannet). Kilroot in Northern Ireland and Eggborough announced plans to close during 2018, but Kilroot was not granted the permit to close by the UR. Both Uskmouth and Lynemouth stations are being converted to run on biomass and waste. The United Kingdom’s largest power plant and emitter, the Drax station, converted its four coal units to biomass and plans to convert its remaining two coal units to 3.6 GW closed-cycle gas turbine units and 200 MW battery storage. In 2017, there were eight active coal-fired power stations operating in the United Kingdom with a total capacity of 14 257 MW (Table 8.3).
A power market for business and consumers
The wholesale electricity market in the United Kingdom is dominated by vertically integrated companies, the “Big Six”, who are engaged in power generation and the supply and/or retail of electricity (and gas). The Big Six are the former gas and/or electricity monopoly suppliers, Centrica, Électricité de France (EDF) Energy, Uniper, RWE Npower, SSE, and Scottish Power. Their share has come down over time. By the end of 2017, the Big Six owned about 50% of the total installed capacity of around 100 GW. By installed capacity at the end of 2016, RWE Npower, British Energy, SSE, Uniper, EDF Energy, Drax Power, and ENGIE were the largest generators (Table 8.4).
Table 8.4 Ownership structure of generation (2016)
Owner |
Total maximum capacity (MW) |
Share (%) |
|
|
|
RWE Npower |
9 909 |
10.1 |
|
|
|
British Energy |
8 918 |
9.1 |
|
|
|
SSE |
6 802 |
7.0 |
|
|
|
Uniper |
6 421 |
6.6 |
|
|
|
EDF Energy |
5 402 |
5.5 |
|
|
|
Drax |
4 035 |
4.1 |
|
|
|
ENGIE |
4 015 |
4.1 |
|
|
|
Centrica |
2 840 |
2.9 |
|
|
|
Intergen |
2 490 |
2.6 |
|
|
|
Others |
46 808 |
47.9 |
|
|
|
EDF Energy, owned by the French company EDF, accounted for 24% of the GB electricity supply, RWE Npower for 14%, Scottish Power (owned by the Spanish company Iberdrola) accounted for 8%, Drax for 7% followed by Centrica and E.ON UK (owned by the Germany company Uniper) with 5% each. SSE and Centrica are United Kingdom-listed companies.
The Big Six are all partially vertically integrated in electricity (active in generation and retail). Centrica is vertically integrated in the gas segment, as the company is active in upstream and generation. Both SSE and Scottish Power also have interests in electricity transmission and gas and electricity distribution.
143
ENERGY SECURITY
IEA. All rights reserved.
8. ELECTRICITY
Figure 8.10 UK coal sector, 2018
km
0 50 100
|
|
• |
Clackmannan coalfield |
|
||
|
|
Glasgow |
|
.Edinburgh |
|
|
|
|
41-- |
|
|
|
|
|
|
Ayrshire coalfield |
|
|
|
|
|
Kilrootllllli |
|
|
|
|
|
|
Belfast• |
|
|
|
|
|
|
|
Cumberland |
|
|
||
|
|
coalfield |
|
|
||
IRELAND |
|
|
|
East Pennine coalfield |
|
|
|
|
|
Drax |
|
||
|
|
Burnley coal field |
|
|
||
Dublin@ |
41- |
|
|
|
|
|
|
|
|
|
|
|
|
|
|
Liver ool |
|
|
|
|
|
|
Southlancaster |
|
|
|
|
|
|
coalfield |
|
|
|
|
|
|
|
|
Oxfordshire coalfield |
THE |
|
|
|
|
|
NETHERLANDS |
||
|
|
|
|
|
@ |
|
|
|
|
|
|
London |
|
|
|
• |
|
|
|
BELGIUM |
|
|
|
|
|
|
|
|
|
Plymouth |
|
|
|
|
|
|
|
|
|
|
FRANCE |
41-- |
Major coal import terminais |
|
llllli |
Coal-fired power plant |
• Hard coal |
|
.A. |
Surface mine area |
|
llllli |
With biomass conversion |
|
|
This map is without prejudice to the status of or sovereignty over any territory, to the delimitation of international frontiers and boundanes and to the name of any terntory, city or area.
Note: km = kilometre.
144
IEA. All rights reserved.

8. ELECTRICITY
The wholesale market is moderately concentrated as eight generators provide 71% of metered volumes in 2017. The index of market concentration, the Herfindahl-Hirschman Index (HHI)1, fell from 1 267 in 2015 to 1 117 in 2016 and a historic low of 1 034 in 2017.
The most recent inquiry into the energy market was carried out by the CMA from 2014 to 2016. The CMA found that vertical integration was not a concern and that generators’ profits were not excessive (CMA, 2016) and that no generator would be pivotal in clearing demand in limited periods, notably amid declining coal-fired generation. The CMA judged competition in the wholesale electricity market to be satisfactory, but proposed a set of recommendations and remedies to improve retail competition to avoid weak consumer response that would indirectly provide market power to the major suppliers (CMA, 2016).
In 2014, Ofgem introduced a requirement on eight large generators to provide better access to hedging products for smaller companies, with a view to increase the market access and liquidity. Ofgem has reviewed this market-making obligation, introduced under the Secure and Promote policy, and proposes to suspend it as it beleave the liquidity and forward trades have improved. The CM, which started operations in 2015, has also offered forward liquidity (four-years ahead).
In recent years, electricity imports increased and new entrants entered the market. However, no small player has reached a 5% market share, despite a simplified “Licence Lite” introduced by Ofgem in 2015 to reduce barriers to entry into the supply market and enable greater third-party participation. In 2018, seven suppliers had a wholesale market share between 1% and 5% and 60 suppliers below 1% (Ofgem, 2018a). However, several new entrants have not been able to sustain their business and exited the market.
In 2018, there were 170 licensed electricity generators and 73 suppliers active in the GB electricity market, which is considered as liquid with a churn rate2 of 3.7, below that of Germany (14.6), but at the same level as that of the Nordic markets (3.9) (EC, 2018).
Wholesale electricity prices in Great Britain were low between 2012 and 2016 but have increased since (Figure 8.11). Prices are, in general, higher than the European average, with resource and system costs included. The UK electricity prices reflect the levies and cost of low carbon schemes (CPF, CFDs, feed-in tariffs, and the CM), according to a review of the energy costs in the United Kingdom (Helm, 2017). These environmental costs are contained in the wholesale price. The wholesale electricity price also reflects the fact that Great Britain has limited interconnection to continental Europe and a broad set of generation technologies.
According to Ofgem, during 2010-17, households spent a total of GBP 39 billion on the power sector decarbonisation, with a net cost of carbon saving of 27 GBP/tCO2 and 101 GBP/tCO2 for large-scale and 315 GBP/tCO2 for small-scale renewable subsidies (see the assessment of the cost of decarbonisation policies by Ofgem [2018a]).
1HHI is a measure for industry concentration that takes into account the size of firms in relation to the industry. It is calculated by adding the sum of the squares of the percentage market shares of each market participant. For example, a market that consists of five competing firms, each with a 20% share of the market, would have an HHI
score of 2 000 (i.e. 400 × 5). HHI is typically used to help assess the degree of market dominance and potential for market power abuse. Views vary on the interpretation of HHI scores. This study uses the scale developed by the European Union, with scores of 750 1 800 considered indicative of moderate concentration, scores of 1 800-5 000 indicative of high levels of concentration, and scores above 5 000 indicative of a very high concentration consistent with the presence of substantial potential market power.
2The churn rate measures the liquidity of the wholesale market as a ratio of the total volume of power trade (including exchange executed and over-the-counter markets on the spot and the curve) and electricity consumption in a given time period.
145
ENERGY SECURITY
IEA. All rights reserved.
8. ELECTRICITY
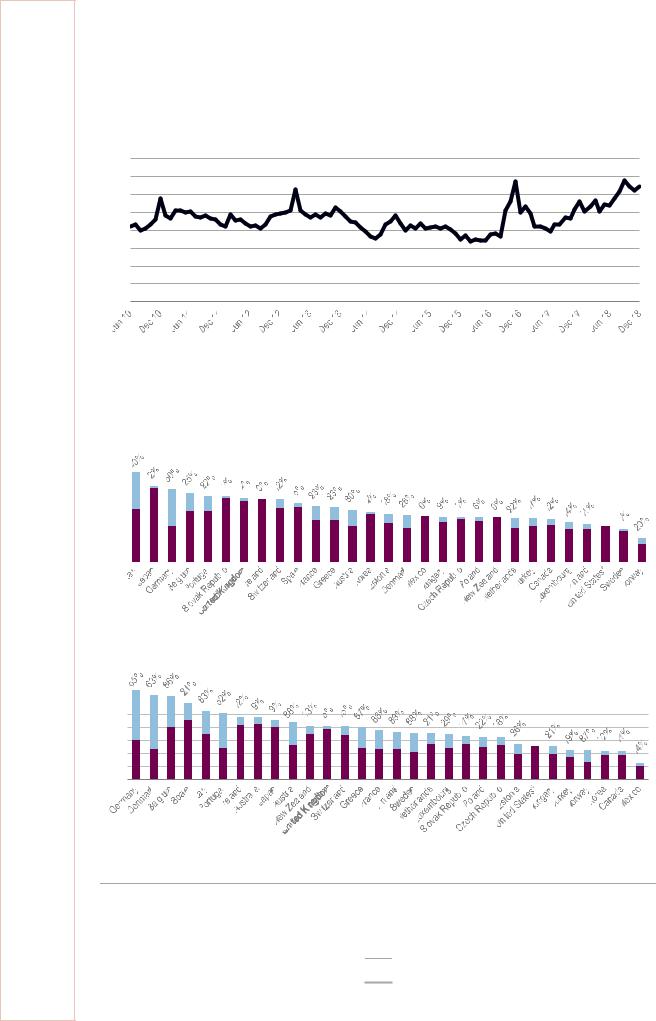
In 2017, the United Kingdom’s electricity price for industries was the seventh-highest price by international comparison among IEA member countries (Figure 8.12).
Figure 8.11 Electricity prices in GB, day-ahead baseload monthly average, 2010-18
GBP/MWh
80
70
60
50
40
30
20
10
0
Source: Ofgem, Dataportal (accessed 29 April 2019), www.ofgem.gov.uk/data-portal/electricity-prices-day-ahead- baseload-contracts-monthly-average-gb.
Figure 8.12 Industry and household electricity prices in IEA countries, 2017
|
|
|
|
|
|
|
|
|
|
|
|
|
|
|
|
|
|
|
|
|
|
|
|
|
|
Industries |
||||||||||||||||||||||||||||||||||||
|
|
|
|
|
|
|
|
|
|
|
|
|
|
|
|
|
|
|
|
|
|
|
|
|
|
|
|
|
|
|
|
|
|
|
|
|
|
|
|
|
|
|
|
|
|
|
|
|
|
|
|
|
|
|
|
|
|
|
|
|
|
|
200 |
USD/MWh |
|
|
|
|
|
|
|
|
|
|
|
|
|
|
|
|
|
|
|
|
|
|
|
|
|
|
|
|
|
|
|
|
|
|
Tax component |
||||||||||||||||||||||||||
|
|
|
|
|
|
|
|
|
|
|
|
|
|
|
|
|
|
|
|
|
|
|
|
|
|
|
|
|
|
|
|
|
|
|||||||||||||||||||||||||||||
|
|
|
|
|
|
|
|
|
|
|
|
|
|
|
|
|
|
|
|
|
|
|
|
|
|
|
|
|
|
|
|
|
|
|||||||||||||||||||||||||||||
|
|
|
|
|
|
|
|
|
|
|
|
|
|
|
|
|
|
|
|
|
|
|
|
|
|
|
|
|
|
|
|
|
|
|
|
|
|
|
|
|
|
|
|
|
|
|
|
|
|
|
|
|
|
|
|
|
|
|
|
|
|
|
180 |
|
|
|
|
|
|
|
|
|
|
|
|
|
|
|
|
|
|
|
|
|
|
|
|
|
|
|
|
|
|
|
|
|
|
|
|
|
|
|
|
|
|
|
|
|
|
|
|
|
|
|
|
|
|
|
|
|
|
|
|
|
|
|
|
|
|
|
|
|
|
|
|
|
|
|
|
|
|
|
|
|
|
|
|
|
|
|
|
|
|
|
|
|
|
|
|
|
|
|
|
|
|
|
|
|
|
|
|
|
|
|
|
|
|
|
|
|
|
|
|
|
|
|
|
|
160 |
|
|
|
|
|
|
|
|
|
|
|
|
|
|
|
|
|
|
|
|
|
|
|
|
|
|
|
|
|
|
|
|
|
|
|
|
|
|
|
|
|
|
|
|
|
|
|
|
|
|
|
|
|
|
|
|
|
|
|
|
|
|
|
|
|
|
|
|
|
|
|
|
|
|
|
|
|
|
|
|
|
|
|
|
|
|
|
|
|
|
|
|
|
|
|
|
|
|
|
|
|
|
|
|
|
|
|
|
|
|
|
|
|
|
|
|
|
|
|
|
|
|
|
|
|
140 |
|
|
|
|
|
|
|
|
|
|
|
|
|
|
|
|
|
|
|
|
|
|
|
|
|
|
|
|
|
|
|
|
|
|
|
|
|
|
|
|
|
|
|
|
|
|
|
|
|
|
|
|
|
|
|
|
|
|
|
|
|
|
|
|
|
|
|
|
|
|
|
|
|
|
|
|
|
|
|
|
|
|
|
|
|
|
|
|
|
|
|
|
|
|
|
|
|
|
|
|
|
|
|
|
|
|
|
|
|
|
|
|
|
|
|
|
|
|
|
|
|
|
|
|
|
120 |
|
|
|
|
|
|
|
|
|
|
|
|
|
|
|
|
|
|
|
|
|
|
|
|
|
|
|
|
|
|
|
|
|
|
|
|
|
|
|
|
|
|
|
|
|
|
|
|
|
|
|
|
|
|
|
|
|
|
|
|
|
|
|
|
|
|
|
|
|
|
|
|
|
|
|
|
|
|
|
|
|
|
|
|
|
|
|
|
|
|
|
|
|
|
|
|
|
|
|
|
|
|
|
|
|
|
|
|
|
|
|
|
|
|
|
|
|
|
|
|
|
|
|
|
|
100 |
|
|
|
|
|
|
|
|
|
|
|
|
|
|
|
|
|
|
|
|
|
|
|
|
|
|
|
|
|
|
|
|
|
|
|
|
|
|
|
|
|
|
|
|
|
|
|
|
|
|
|
|
|
|
|
|
|
|
|
|
|
|
|
|
|
|
|
|
|
|
|
|
|
|
|
|
|
|
|
|
|
|
|
|
|
|
|
|
|
|
|
|
|
|
|
|
|
|
|
|
|
|
|
|
|
|
|
|
|
|
|
|
|
|
|
|
|
|
|
|
|
|
|
|
|
80 |
|
|
|
|
|
|
|
|
|
|
|
|
|
|
|
|
|
|
|
|
|
|
|
|
|
|
|
|
|
|
|
|
|
|
|
|
|
|
|
|
|
|
|
|
|
|
|
|
|
|
|
|
|
|
|
|
|
|
|
|
|
|
|
|
|
|
|
|
|
|
|
|
|
|
|
|
|
|
|
|
|
|
|
|
|
|
|
|
|
|
|
|
|
|
|
|
|
|
|
|
|
|
|
|
|
|
|
|
|
|
|
|
|
|
|
|
|
|
|
|
|
|
|
|
|
60 |
|
|
|
|
|
|
|
|
|
|
|
|
|
|
|
|
|
|
|
|
|
|
|
|
|
|
|
|
|
|
|
|
|
|
|
|
|
|
|
|
|
|
|
|
|
|
|
|
|
|
|
|
|
|
|
|
|
|
|
|
|
|
|
|
|
|
|
|
|
|
|
|
|
|
|
|
|
|
|
|
|
|
|
|
|
|
|
|
|
|
|
|
|
|
|
|
|
|
|
|
|
|
|
|
|
|
|
|
|
|
|
|
|
|
|
|
|
|
|
|
|
|
|
|
|
40 |
|
|
|
|
|
|
|
|
|
|
|
|
|
|
|
|
|
|
|
|
|
|
|
|
|
|
|
|
|
|
|
|
|
|
|
|
|
|
|
|
|
|
|
|
|
|
|
|
|
|
|
|
|
|
|
|
|
|
|
|
|
|
|
|
|
|
|
|
|
|
|
|
|
|
|
|
|
|
|
|
|
|
|
|
|
|
|
|
|
|
|
|
|
|
|
|
|
|
|
|
|
|
|
|
|
|
|
|
|
|
|
|
|
|
|
|
|
|
|
|
|
|
|
|
|
20 |
|
|
|
|
|
|
|
|
|
|
|
|
|
|
|
|
|
|
|
|
|
|
|
|
|
|
|
|
|
|
|
|
|
|
|
|
|
|
|
|
|
|
|
|
|
|
|
|
|
|
|
|
|
|
|
|
|
|
|
|
|
|
|
|
|
|
|
|
|
|
|
|
|
|
|
|
|
|
|
|
|
|
|
|
|
|
|
|
|
|
|
|
|
|
|
|
|
|
|
|
|
|
|
|
|
|
|
|
|
|
|
|
|
|
|
|
|
|
|
|
|
|
|
|
|
0 |
|
|
|
|
|
|
|
|
|
|
|
|
|
|
|
|
|
|
|
|
|
|
|
|
|
|
|
|
|
|
|
|
|
|
|
|
|
|
|
|
|
|
|
|
|
|
|
|
|
|
|
|
|
|
|
|
|
|
|
|
|
|
|
|
|
|
|
|
|
|
|
|
|
|
|
|
|
|
|
|
|
|
|
|
|
|
|
|
|
|
|
|
|
|
|
|
|
|
|
|
|
|
|
|
|
|
|
|
|
|
|
|
|
|
|
|
|
|
|
|
|
|
|
|
|
|
|
|
|
|
|
|
|
Households |
|||
|
|
|
|
|
|
|
|
|
|
|
|
400 |
USD/MWh |
|
|
Tax component |
|||||||
|
|
||||||||||
|
|
||||||||||
|
|
|
|
|
|
|
|
|
|
|
|
350 |
|
|
|
|
|
|
|
|
|
|
|
|
|
|
|
|
|
|
|
|
|
|
|
300 |
|
|
|
|
|
|
|
|
|
|
|
|
|
|
|
|
|
|
|
|
|
|
|
250
200
150
100
50
0
Despite low taxes on electricity, UK industries pay the seventh-highest price in an IEA comparison and the UK household price ranks the twelfth highest.
*Tax information not available for the United States. Note: Data missing for industry in Australia.
Source: IEA (2018b), Prices and Taxes 2018, www.iea.org/statistics/.
146
IEA. All rights reserved.