

8. ELECTRICITY
*** The Capacity Allocation and Congestion Management Guideline (Commission Regulation 2015/1222) introduces a new regional process for congestion management called the Coordinated Capacity Calculator.
Notes: CACM = capacity allocation and congestion management; CCC = coordinated capacity calculator; ECA = explicit capacity allocation; HVDC = high voltage direct current; ICA = implicit capacity allocation; kV = kilovolts.
Towards a low-carbon electricity sector
The share of variable renewables (wind and solar) in total installed capacity has nearly doubled from 18% in 2006 to 29% in 2016. Although the total installed power-generating capacity reached 97.6 GW in 2016, up from 83.6 GW a decade ago (Table 8.2), wind power capacity amounted to 16.2 GW and solar power to 11.2 GW. In November 2018, for the first time, the installed RES capacity in Great Britain has overtaken that of fossil fuels. The capacity of wind, solar, biomass, and hydropower reached 41.9 GW, above the 41.2 GW capacity of coal, gas, and oil-fired power plants. However, in terms of electricity generation, RES only accounted for 28% in 2018 (Imperial College/Drax, 2018).
The carbon dioxide (CO2) intensity in power and heat generation in the United Kingdom has rapidly decreased in recent years, compared to that neighbouring countries (Chapter 3) to 280.7 grammes of carbon dioxide per kilowatt-hour (gCO2/kWh), a 46% decline since 2006. Although this trend is consistent with that of other IEA member countries, the decline was much more rapid in the United Kingdom after 2012 (Figure 8.9). New regulations introduced under the EMR were a strong driver and, combined with low gas prices, the CPF has made coal unprofitable to operate since 2015.
Table 8.2 Installed electricity-generating capacity, 1995-2016 (MW)
Energy source |
1995 |
2000 |
2006 |
2011 |
2012 |
2013 |
2014 |
2015 |
2016 |
|
|
|
|
|
|
|
|
|
|
Nuclear |
12 762 |
12 486 |
10 969 |
10 663 |
9 946 |
9 906 |
9 937 |
9 487 |
9 497 |
|
|
|
|
|
|
|
|
|
|
Hydro |
4 220 |
4273 |
4 131 |
4 423 |
4 437 |
4 453 |
4 474 |
4 521 |
4 579 |
Solar |
0 |
2 |
14 |
1 000 |
1 753 |
2 937 |
5 528 |
9 535 |
11 899 |
|
|
|
|
|
|
|
|
|
|
Wind |
200 |
412 |
1 955 |
6 596 |
9 030 |
11 282 |
1 3074 |
14 316 |
16 217 |
Tide |
0 |
1 |
0 |
4 |
9 |
8 |
9 |
9 |
13 |
|
|
|
|
|
|
|
|
|
|
Total combustible |
52 943 |
61 219 |
66 453 |
71 141 |
70 872 |
65 034 |
63 600 |
59 431 |
55 435 |
fuels |
|
|
|
|
|
|
|
|
|
Steam |
40 795 |
36 504 |
33 608 |
32 053 |
28 816 |
23 449 |
21 672 |
19 144 |
15 070 |
|
|
|
|
|
|
|
|
|
|
Internal combustion |
166 |
177 |
153 |
122 |
119 |
102 |
105 |
109 |
105 |
Gas turbine |
2 552 |
2 556 |
1 918 |
2 022 |
1 959 |
1 927 |
1 934 |
1 725 |
1 799 |
|
|
|
|
|
|
|
|
|
|
Combined cycle |
9 185 |
21 138 |
26 965 |
32 188 |
35 150 |
34 872 |
33 807 |
31 696 |
31 766 |
Other generations |
245 |
844 |
3 366 |
4 756 |
4 828 |
4 684 |
6 082 |
6 757 |
6 695 |
|
|
|
|
|
|
|
|
|
|
Total capacity |
70 125 |
78 393 |
83 632 |
93 827 |
96 047 |
93 620 |
96 622 |
97 299 |
97 640 |
|
|
|
|
|
|
|
|
|
|
Source: IEA (2019), World Energy Balances 2019 First edition (database), www.iea.org/statistics/.
140
IEA. All rights reserved.
8. ELECTRICITY
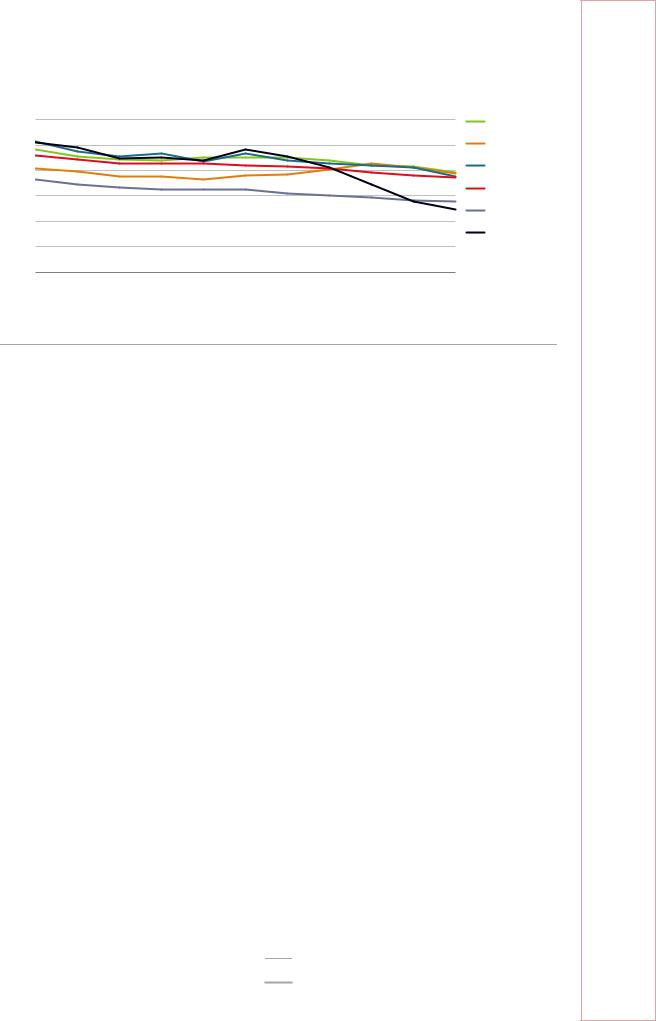
Figure 8.9 CO2 intensity of power and heat generation in the United Kingdom and in other selected IEA member countries, 2007-17
600 |
gCO2/kWh |
|
|
|
|
|
|
|
|
Germany |
|
|
|
|
|
|
|
|
|
|
|
||
500 |
|
|
|
|
|
|
|
|
|
|
Netherlands |
400 |
|
|
|
|
|
|
|
|
|
|
Ireland |
|
|
|
|
|
|
|
|
|
|
|
|
300 |
|
|
|
|
|
|
|
|
|
|
IEA30 |
|
|
|
|
|
|
|
|
|
|
IEA Europe |
|
200 |
|
|
|
|
|
|
|
|
|
|
|
|
|
|
|
|
|
|
|
|
|
United Kingdom |
|
100 |
|
|
|
|
|
|
|
|
|
|
|
|
|
|
|
|
|
|
|
|
|
|
|
0 |
|
|
|
|
|
|
|
|
|
|
|
2007 |
2008 |
2009 |
2010 |
2011 |
2012 |
2013 |
2014 |
2015 |
2016 |
2017 |
|
United Kingdom’s CO2 intensity in the power sector fell by 45% in the past four years, and in 2017 the United Kingdom ranked below neighbouring countries and the IEA Europe average.
Source: IEA (2019b), CO Emissions from Fuel Combustion 2019, www.iea.org/statistics/.
Carbon price floor
In 2013, the government introduced the CPF in Great Britain composed of two components: 1) the EU Emissions Trading System (EU ETS) allowance price and 2) the Carbon Price Support (CPS), which tops up the EU ETS allowance prices. The CPF helped in making coal less profitable than gas for power generation. Every year, the UK Treasury confirms CPS rates in advance of delivery at the budget. The CPS was set at British pounds (GBP) 4.94 per tonne of carbon dioxide-equivalent (GBP/tCO2) for 2013/14, 9.55 GBP/tCO2 for 2014/15, and 18.08 GBP/tCO2 for 2015/16. At the 2014 Budget, the government confirmed that it would freeze the CPS rate at 18 GBP/tCO2 from 2016/17 to 2019/20 due to competitiveness concerns, despite the initial intention to raise the CPF to 30 GBP/tCO2 in 2020 and 70 GBP/tCO2 in 2030. Budget 2016 maintained the cap at 18.08 GBP/tCO2 from 2016/17 to 2019/20. At Budget 2018, the government announced that CPS rates will be frozen at 18.08 GBP/CO2 in 2020/21 following the rise in the EU ETS price. From 2021/22 the government will seek to reduce CPS rates if the total carbon price (TCP) remains high.
Contracts for difference
CFDs were created to incentivise investment in low-carbon electricity generation (nuclear and renewables). A generator party to a CFD is paid the difference between the “strike price” (a price for electricity that reflects the cost of investing in a particular low-carbon technology) and the “reference price” (a measure of the average market price for electricity in the GB wholesale market). The first CFDs were concluded based on an administered strike price, decided by the government – this included the Hinkley Point C (HPC) nuclear plant. On the government side, the Low Carbon Contracts Company is the CFD counterparty and consumers pay for the difference. In 2016, the nuclear power plant (NPP) project HPC (3 200 megawatts electrical) was awarded a CFD for 60 years at a strike price of GBP 92.50 per megawatt hour (GBP/MWh). The government moved to competitive auctions in 2015 (established technologies in “pot 1” and less-established technologies in “pot 2”) and in 2017 (less-established technologies only). The next auction is set to take place in May 2019. CFDs have brought about investment in
141
ENERGY SECURITY
IEA. All rights reserved.

8. ELECTRICITY
renewables and nuclear generation. Although the early CFDs with administered prices led to high costs for consumers, competitive auctions contributed to scale with lower strike prices and lower cost of capital for investors, notably for offshore wind (Chapter on Renewable Energy and Grubb and Newbery [2018]). Plants that receive CFDs are not allowed to participate in the capacity market (which is described in detail in “Security of supply” below).
Emissions performance standards
Under the Energy Act of 2013 and the Emissions Performance Regulations of 2015, the EPS for new fossil fuel capacity is set at an equivalent rate of 450 gCO2/kWh of “base load generation”. The EPS also complements the National Planning Policy, which requires new coal-fired power stations to be equipped with carbon capture and storage (CCS). The EPS provides a regulatory backstop to prevent the construction of new carbon-intensive forms of electricity generation, such as unabated coal-fired power stations. In August 2018, the government announced the five-year review of the EPS.
In addition, the government set the goal of ending unabated coal power generation in Great Britain by 2025. In January 2018, the government responded to its coal closure consultation “Implementing the End of Unabated Coal by 2025”. The government is developing legislation for a similar 450 gCO2/kWh emissions limit to apply to existing plants from 1 October 2025. The remaining coal-fired plants will most likely reduce operations by 2023 and close by October 2025 when the government intends to implement new CO2 emissions limits for UK power plants.
Table 8.3 Operational and closed coal plants in the United Kingdom
Station |
Owner |
Capacity (MW) |
Status |
Ratcliffe |
Uniper UK Limited |
2 000 |
No plans to close |
|
|
|
|
Drax |
Drax Power Ltd |
1 980 |
No plans to close |
Cottam |
EDF Energy |
2 008 |
No plans to close |
|
|
|
|
West Burton |
EDF Energy |
2 012 |
No plans to close |
Eggborough |
Eggborough Power |
1 960 |
Stopped operations and plans to close in |
|
Lit |
|
September 2018 |
|
|
|
|
Aberthaw B |
RWE Npower Plc |
1 586 |
Reduced running |
Uskmouth Power |
SIMEC |
230 |
Mothballed April 2017 |
|
|
|
|
Fiddlers Ferry |
SSE |
1 961 |
Contracts up to 2019 |
Kilroot |
AES |
520 |
Plans to close but not authorised |
|
|
|
|
Lynemouth |
Lynemouth Power |
420 |
Closed pending biomass conversion |
Rugeley |
ENGIE |
1 006 |
Closed |
|
|
|
|
Ferrybridge C |
SSE |
980 |
Closed |
Longannet |
Scottish Power |
2 260 |
Closed |
Note: SSE = Scottish and Southern Energy.
In November 2017, the government initiated the international “Powering Past Coal Alliance”, which in 2019 totals 80 members, including 30 national governments, 22 subnational governments and 28 businesses.
Most of the United Kingdom’s coal-fired power plants underwent air pollution upgrades, were converted to biomass or closed (Figure 8.10 and Table 8.3). All the coal-fired capacity that had opted out of the EU Large Combustion Plants Directive had been
142
IEA. All rights reserved.