

8. ELECTRICITY
Electricity consumption
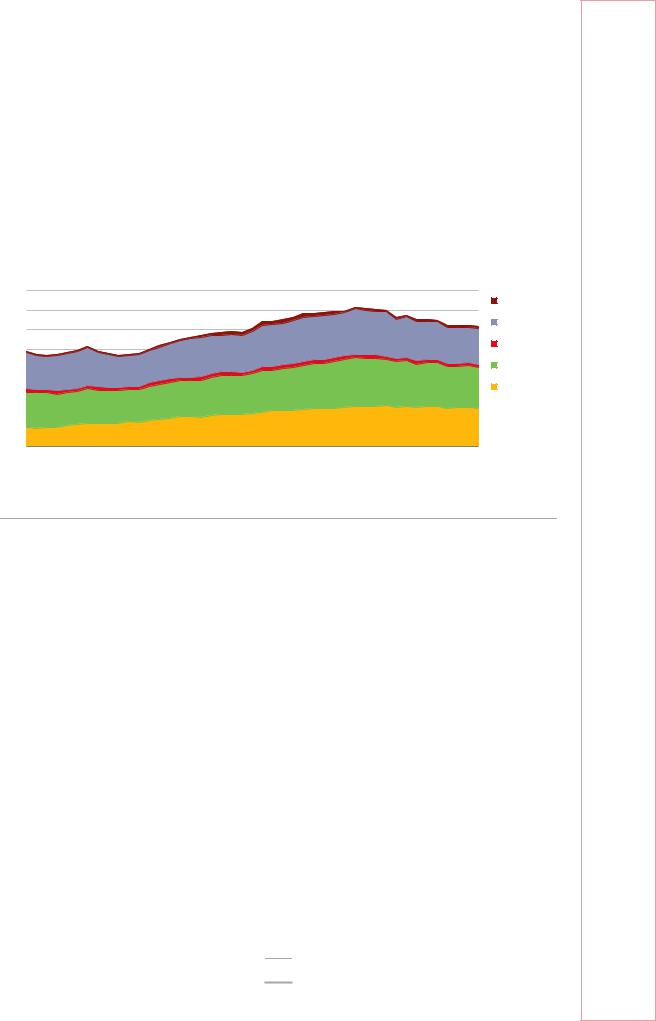
Electricity demand growth has flattened out. In 2017, the United Kingdom consumed 307.9 TWh of electricity, 12% below the level in 2007 (Figure 8.6). The sectoral proportion of consumption is fairly balanced with residential, commercial, and industry sectors each accounting for around one-third of the total consumption. One driver of the decline was the decrease in industrial consumption, down 18% from 113 TWh in 2007 to 93 TWh in 2017. Amid higher prices and more energy-efficient appliances, the residential sector’s consumption declined by 14% over the past decade, whereas the commercial sector’s consumption declined by 4%.
Figure 8.6 Electricity consumption (TFC) by consuming sector, 1973-2017
400 |
TWh |
|
|
|
|
|
|
|
|
|
|
Transport |
350 |
|
|
|
|
|
|
|
|
|
|
|
|
|
|
|
|
|
|
|
|
|
|
|
Industry |
|
300 |
|
|
|
|
|
|
|
|
|
|
|
|
|
|
|
|
|
|
|
|
|
|
|
|
|
250 |
|
|
|
|
|
|
|
|
|
|
|
Energy* |
|
|
|
|
|
|
|
|
|
|
|
|
|
200 |
|
|
|
|
|
|
|
|
|
|
|
Residential |
150 |
|
|
|
|
|
|
|
|
|
|
|
Commercial** |
100 |
|
|
|
|
|
|
|
|
|
|
|
|
50 |
|
|
|
|
|
|
|
|
|
|
|
|
0 |
|
|
|
|
|
|
|
|
|
|
|
|
1973 |
1977 |
1981 |
1985 |
1989 |
1993 |
1997 |
2001 |
2005 |
2009 |
2013 |
2017 |
|
The total electricity consumption has decreased since 2005, mostly due to a decline by nearly 20% in the industry sector and higher energy efficiency in the residential sector.
*Energy includes petroleum refineries, coke ovens, and other energy sector consumption.
**Commercial includes commercial and public services, agriculture, and forestry.
Source: IEA (2019), World Energy Balances 2019 First edition (database), www.iea.org/statistics/.
Institutional and regulatory framework
The Department for Business, Energy and Industrial Strategy (BEIS) retains broad responsibility for policies on energy, climate and electricity market design. Owned by BEIS, the Low Carbon Contracts Company (LCCC) signs and manages contracts for difference (CFDs) for low-carbon generation, forecasts CFD payments and sets Supplier Obligations.
The Office of Gas and Electricity Markets (Ofgem) is the national regulatory authority responsible for licensing energy companies, designing the rules for gas and electricity markets, and regulating gas and electricity network monopolies. Ofgem regulates regional transmission and distribution companies (see below) through price controls that limit how much can be charged to system users. Ofgem statutory principle objective is to protect the interests of consumers by promoting sustainability, competition, and security of supply in the energy market. Although it is independent of the government, it is accountable to the parliament. Ofgem is funded based on revenues from license holders.
The Competition and Markets Authority (CMA) is the UK’s primary competition and consumer authority, which took over many of the functions of the Competition
133
ENERGY SECURITY
IEA. All rights reserved.
8. ELECTRICITY
Commission and the Office of Fair Trading. It is an independent non-ministerial government department with responsibility for carrying out investigations into mergers, markets, and the regulated industries and for enforcing competition law, which includes in relation to energy.
The UK electricity market policy framework is set out in the Energy Act 2013 and the Electricity Act 1989 (as amended in April 2017), which also transpose EU directives, and EU networks codes and EU Electricity Regulations apply directly.
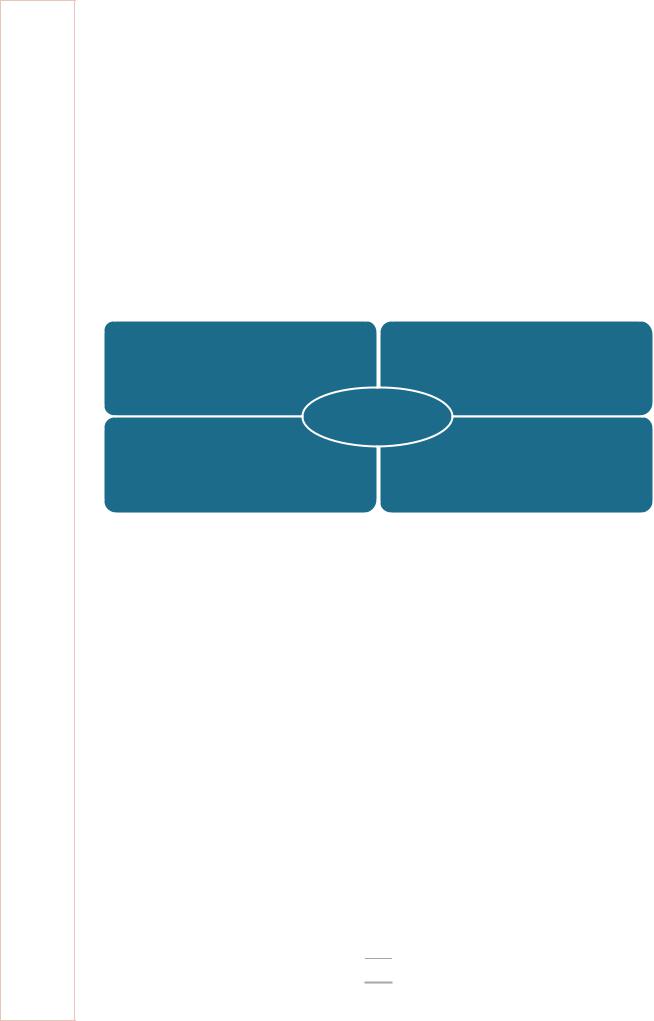
Based on the 2011 White Paper (UK Government, 2011), the UK Electricity Market Reform (EMR) introduced a carbon price floor (CPF), CFDs, an emissions performance standard (EPS), and the capacity market (CM) (Figure 8.7). The EMR framework is set out in the Energy Act 2013 and is examined in the following sections.
Figure 8.7 Electricity Market Reform
Contracts for difference |
Capacity market |
|
|
EMR |
|
Carbon price floor |
Emissions |
|
performance standard |
||
|
Source: IEA, 2019. All rights reserved.
Wholesale market design
The UK power market is the electricity market of Great Britain. Northern Ireland, part of the United Kingdom, operates a joint wholesale electricity market with the Republic of Ireland, the so-called single electricity market (SEM), in place since 2007.
Northern Ireland
The system operator for Northern Ireland is SONI and the Northern Ireland Electricity Networks owns the transmission and distribution network. The independent Utility Regulator (UR) is responsible for regulating the electricity (and water) utilities and promoting consumer interests. Northern Ireland has independent power producers that own three fossil fuel generation plants: AES Corporation owns Ballylumford (~1 000 MW) and Kilroot (~650 MW), and the Coolkeeragh (~450 MW) plant is owned by ENSBNI (a subsidiary of the Republic of Ireland’s Electricity Supply Board. In 2018, 1 523 MW of renewable generation was connected to the grid in Northern Ireland, with the majority from onshore wind.
The SEM is facilitated by the single electricity market operator (SEMO), a joint venture between EirGrid plc (the transmission system operator [TSO] in the Republic of Ireland) and SONI. SEMO is licensed and regulated co-operatively by the Commission for Regulation of Utilities in Ireland and the UR. The SEM was reformed as the integrated single electricity market (I-SEM) in May 2018 aimed at improvements to the efficiencies
134
IEA. All rights reserved.

8. ELECTRICITY
of interconnector flows, investment, affordability, and trading through the introduction of continuous trading in the intraday, day-ahead, forwards, and balancing timeframes.
Great Britain wholesale electricity market
The Great Britain (GB) wholesale electricity market is based on “self-dispatch”, in which suppliers and generators contract to buy and sell power and have to pay balancing costs if they under or over deliver. Besides the energy market, Great Britain also has a capacity market. Under the British Electricity Trading and Transmission Arrangements, Great Britain is now a SEM with a single price zone, despite congestion between Scotland and England and Wales. (This brings about high costs of countertrading and renders the integration of wind power a challenge.)
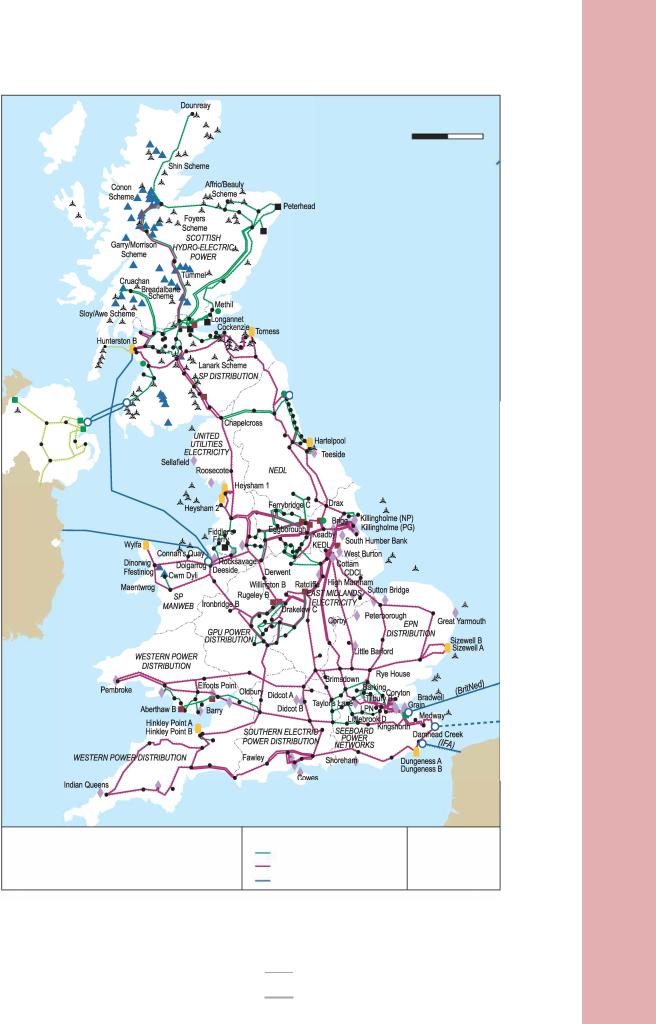
Generation and supply are unbundled from transmission and distribution and from the system operation. The National Electricity Transmission System (NETS) is owned and maintained by different regional transmission companies. Scottish Power is the transmission owner for Central and Southern Scotland. Scottish Hydro Electric Transmission owns the transmission network of North Scotland. National Grid Electricity Transmission (National Grid (NG)) is the transmission owner for England and Wales, but also the electricity system operator (ESO) in GB responsible for the balance of supply and demand, and system safety and security. A process of legal separation is underway to split the transmission function from the ESO role of NG. In April 2019, separate legal companies within the NG Group will be created (ESO and Electricity Transmission (ET)); stopping short of full separation. Outside NG’s ET remit, offshore transmission networks are owned by a variety of offshore transmission owners (OFTOs) which follow a dedicated regulatory framework devised by Ofgem. Transmission operators charge connection charges and transmission network use of system (TNUoS) and NG collects the balancing service use of system charges. NG’s subsidiary ELEXON carries out the balancing and settlement requirements (financial reconciliation of the estimated and actual physical positions of market participants) under the Balancing and Settlement Code.
There are 14 licensed distribution network operators (DNOs), each responsible for planning, constructing, operating, and maintaining the network in their geographical areas (Figure 8.8). The 14 DNOs are owned by six different groups. There are also 14 licensed independent DNOs responsible for network extensions in commercial areas. The regulator, Ofgem, approves the connection and use of system charges that are published by the DNO. The Figure 8.8. shows the distribution areas (NEDL is now NPg, United Utilities is now ENWL, Southern Electric now SSE, SEEBOARD now UKPN).
Network regulation
Ofgem regulates the transmission and distribution tariffs through incentive regulation. In 2010 the United Kingdom pioneered a new output-based method with the revenue = incentives + innovation + outputs (RIIO) model (Box 8.1) with an eight-year regulatory period which started in 2013. RIIO focuses on the delivery of a specified range of outcomes for customers, which encourages distributors through a regime of incentives with rewards and penalties to achieve an efficient and cost-effective delivery of the specified services. It also provides opportunities for distributors to profit from innovation and incorporating third parties in the delivery of energy services. RIIO is being used to facilitate the delivery of public policy outcomes in relation to reliability, vulnerable customers, and the environment. Performance-based regulatory regimes are designed to
135
ENERGY SECURITY
IEA. All rights reserved.

8. ELECTRICITY
promote timely and efficient investment and innovation that benefits consumers, while providing distributors with the ability to respond to a complex business environment.
Across GB, the latest distribution price control for 2015-23 allowed around GBP 24.6 billion in funding for the distribution network. Ofgem incentivises DNOs to minimise losses on their networks. The DNO performance is assessed against four criteria – understanding of losses, stakeholder engagement, processes for managing losses, and innovative approaches to managing losses.
Interconnectors
The GB electricity system is connected with North-West Europe via 4 000 MW of interconnector capacity – 2 000 MW with France (IFA) and 1 000 MW with the Netherlands (BritNed) and 1 000 MW with Belgium (Nemo Link) (Table 8.1). Two interconnections link Great Britain and the SEM – the 500 MW Moyle interconnects Great Britain with Northern Ireland and an East-West interconnector of 500 MW capacity links Great Britain to the Republic of Ireland. An additional 3.4 gigawatts (GW) of capacity is under construction to link Great Britain with Norway (North Sea Link) and France (GridLink) by 2021. A further 9.5 GW of projects have sought regulatory approval, and the government has stated its support for at least 9 GW more than is currently operational.
Ofgem’s “cap and floor” regime offers revenue for interconnectors from the allocation of capacity to users who want to flow electricity between Great Britain and its neighbours. The cap and floor regime was developed by Ofgem in collaboration with Belgium’s regulator CREG.
The floor is the minimum amount of revenue that an interconnector can earn, which means that if an interconnector does not receive enough revenue from its operations, its revenue will be “topped up” to the floor level from national transmission revenues. NG will, in turn, recover them from transmission charges applied to all users, and thus consumers may pay part of the commercial risk of an otherwise merchant project. The cap is the maximum amount of revenue an interconnector can earn. Should an interconnector’s revenue exceed the cap, it will transfer the excess revenue to NG, which will, in turn, reduce transmission charges. For consumers, the cap on revenues provides benefits in return for their exposure in underwriting the floor. For each interconnector project, the cap and floor values are calculated ex ante for the project lifetime of 20+ years based on operational expenditure (opex) and capital expenditure (capex), and cap/floor returns approved and scrutinised by Ofgem.
Offshore transmission regime
The government developed a competitive offshore transmission regulatory regime that supports the renewable energy targets. The Electricity Act 1989 allows Ofgem to adopt regulations for competitive tenders for OFTOs. The Electricity (Competitive Tender for Offshore Transmission Licences) Regulations 2015 set out the process that is to be followed by all parties involved in the tenders managed by Ofgem.
136
IEA. All rights reserved.
8. ELECTRICITY
Figure 8.8 Electricity transmission networks in the United Kingdom
km
0 50 100
,,,,,,,,,,,,,,,,,,,,,,,,,,,,,,,,,,,,
Lynemouth
Dublin@
IRELAND
|
|
|
|
|
|
|
FRANCE |
Power plants |
♦ |
CCGT/CHP |
Power lines |
|
|
Others |
|
1 |
Nuclear |
... |
Hydro/pumped storage |
275kV |
|
|
• Substation |
|
...... |
Double circuit |
|||||
■ |
Coal |
-4_ |
Wind |
400kV |
|
||
|
|
0 Converter station |
|||||
■ |
Oil |
• |
Biomass |
HVDC |
|
|
|
|
|
|
|||||
|
|
|
|
||||
This map is without prejudice to the status of or sovereignty over any territory, to the delimitation of international frontiers and boundaries and to the name of any territory, city or area.
Note: km = kilometre.
137
ENERGY SECURITY
IEA. All rights reserved.

8. ELECTRICITY
Box 8.1 Overview of the United Kingdom’s RIIO performance-based regulatory framework
RIIO is Ofgem’s new performance-based framework for setting price controls for regulated energy businesses. The new regulatory period for distributors commenced in 2015. RIIO encourages distributors to: 1) put stakeholders at the heart of their decisionmaking process, 2) invest efficiently to ensure continued safe and reliable services, 3) innovate to reduce network costs for current and future consumers, and 4) play a full role in delivering a low-carbon economy and wider environmental objectives. Key elements of the regime include:
Eight-year regulatory period: the extended regulatory period provides more regulatory stability and encourages longer-term focus.
Upfront (ex ante) assessment: sets the base revenues and basis for changes in the revenues over the subsequent eight-year period with limited possible reopeners that provide a high level of certainty for regulated distributors.
Cost-sharing mechanism: if the distributor spends less than the target set, the savings are shared between the distributor and customers. This produces strong incentives to outperform. Conversely, if the distributor overspends, the extra costs are shared between the distributor and its customers in the same way. This mitigates the impact of cost overruns.
Weighted average cost of capital approach: reimburses debt and equity investors at an appropriate level. The cost of debt is updated annually.
Comprehensive quality outputs: distributors’ business plans need to be informed by and tailored to their customers’ needs, e.g. level of network reliability, availability, and environmental impacts.
Regulatory asset value (RAV) approach: outlays for long-term investments are recovered over lifetime revenues as a return on the RAV so the costs are shared between all the customers who benefit from the investment.
Totex approach: assesses the total expenditure (totex), taking opex and capex together. This provides the company with incentives to choose the most economic option when deciding between opex and capex solutions.
Uncertainty mechanisms: limited provisions to manage specific cases of uncertainty risk through possible revenue changes during the period, e.g. extra revenues to provide a greater network capacity.
Promoting innovation: encourages distributors to consider different ways to achieve greater cost savings or increase the scope of future delivery.
Under RIIO, Ofgem asks distributors to submit business plans on how they intend to meet the RIIO established by Ofgem. RIIO places a strong emphasis on stakeholder engagement and distributors must obtain stakeholders’ input and use in the plans. Ofgem reviews the plans. Where a distributor’s business plan is considered of high quality, its new price control settlement may be fast tracked.
138
IEA. All rights reserved.

|
|
|
|
|
|
8. ELECTRICITY |
|
Table 8.1 Interconnectors of the United Kingdom |
|
|
|
||||
|
|
|
|
|
|
|
|
Interconnector |
Connection |
Completion/ |
Capacity |
Voltage |
Capacity |
Congestion |
|
|
|
Due |
|
|
allocation* |
management*** |
|
|
|
Interconnectors in operation |
|
|
|||
|
|
|
|
|
|
|
|
IFA |
France |
1986 |
2 000 MW |
270 kV |
Forwards ECA |
Electricity Regulation |
|
|
|
|
|
|
Day-ahead ICA |
714/2009 with |
|
|
|
|
|
|
(ECA if not ICA ) |
maximisation of capacity |
|
|
|
|
|
|
Intraday ICA |
available to the market |
|
Moyle |
Northern |
2002 |
500 MW |
250 kV |
** Forwards ECA |
Day-ahead capacity is |
|
|
Ireland |
|
|
|
Day-ahead ICA |
calculated and released |
|
|
|
|
|
|
(ECA if not ICA ) |
ahead of time |
|
|
|
|
|
|
Intraday ICA |
|
|
BritNed |
The |
2011 |
2000 MW |
450 kV |
Forwards ECA |
Electricity Regulation |
|
|
Netherlands |
|
|
|
Day-ahead ICA |
714/2009 with |
|
|
|
|
|
|
(ECA if not ICA ) |
maximisation of capacity |
|
|
|
|
|
|
Intraday ECA |
available to the market |
|
East-West |
Republic of |
2012 |
500 MW |
200 kV |
** Forwards ECA |
Electricity Regulation |
|
|
Ireland |
|
|
|
Day-ahead ICA |
714/2009 with |
|
|
|
|
|
|
(ECA if not ICA ) |
maximisation of capacity |
|
|
|
|
|
|
Intraday ICA |
available to the market |
|
NEMO |
Belgium |
2019 |
1 000 MW |
HVDC |
Forwards ECA |
Observer CACM for |
|
|
|
|
|
400 kV |
Day-ahead ICA |
CCC |
|
|
|
|
|
|
(ECA if not ICA ) |
|
|
|
|
|
|
|
Intraday ECA |
|
|
|
|
Interconnector under construction |
|
|
|||
|
|
|
|
|
|
|
|
GridLink |
France |
2022 |
1 400 MW |
HVDC |
Forwards ECA |
Observer CACM for |
|
|
|
|
|
|
Day-ahead ICA |
CCC |
|
|
|
|
|
|
(ECA if not ICA ) |
|
|
|
|
|
|
|
Intraday ECA |
|
|
ElecLink |
France |
2019 |
1 000 MW |
HVDC |
Forwards ECA |
Observer CACM for |
|
|
|
|
|
320 kV |
Day-ahead ICA |
CCC |
|
|
|
|
|
|
(ECA if not ICA ) |
|
|
|
|
|
|
|
Intraday ECA |
|
|
IFA2 |
France |
2020 |
1 000 MW |
HVDC |
Forwards ECA |
Observer CACM for |
|
|
|
|
|
320 kV |
Day-ahead ICA |
CCC |
|
|
|
|
|
|
(ECA if not ICA ) |
|
|
|
|
|
|
|
Intraday ECA |
|
|
North Sea Link |
Norway |
2020 |
1 976- |
HVDC |
Forwards ECA |
Observer CACM for |
|
(NSL) |
|
|
82 MW |
525 kV |
Day-ahead ICA |
CCC |
|
|
|
|
|
|
(ECA if not ICA ) |
|
|
|
|
|
|
|
Intraday ECA |
|
|
|
|
||||||
|
Interconnector with regulatory approval and advanced development |
|
|||||
NorthConnect |
Norway |
2022 |
1 400 MW |
HVDC |
UK regulatory approval received |
||
|
|
|
|
525 kV |
|
|
|
|
|
|
|
|
|
||
GreenLink |
Ireland |
2021 |
500 MW |
HVDC |
UK regulatory approval received |
|
|
|
|
|
|
320 kV |
|
|
|
VikingLink |
Denmark |
2022 |
1 400 MW |
HVDC |
UK regulatory approval received |
||
|
|
|
|
400 kV |
|
|
|
FABLink |
France |
2022 |
1 400 MW |
HVDC |
UK regulatory approval received |
|
|
|
|
|
|
320 kV |
|
|
|
NeuConnect |
Germany |
NN |
1 400 MW |
|
UK regulatory approval received |
||
|
|
|
|
|
|
||
Aquind |
France |
NN |
2 000 MW |
HVDC |
Exemption request not granted by ACER, |
|
|
|
|
|
|
320 kV |
decision 22 June 2018 |
|
|
|
|
|
|
|
|
|
|
*The introduction of the Cross-Border Intraday Market Project, which is due to have both phases completed in 2019, will introduce intraday implicit capacity allocation in line with provisions of the CACM Guideline (Commission Regulation 2015/1222).
**On completion of the I-SEM on the island of Ireland, the East-West and Moyle interconnectors will allocate capacity on the forwards market through financial contracts, while day-ahead allocation will be implicit, and intraday will be implicit allocation and market coupled.
139
ENERGY SECURITY
IEA. All rights reserved.