

8. ELECTRICITY
Supply and demand
Electricity supply and generation
Since peaking at 395 terawatt hours (TWh) in 2003, the UK’s electricity generation has declined. In 2017, the total generation was 335 TWh, 15% less than that in 2007 (Figure 8.1). The largest reduction was in coal-fired power generation, which declined by 83% from 2007.
Figure 8.1 Electricity generation by source, 1973-2017
450 |
TWh |
|
|
|
|
|
|
|
|
|
|
Solar |
|
|
|
|
|
|
|
|
|
|
|
||
400 |
|
|
|
|
|
|
|
|
|
|
|
Wind |
350 |
|
|
|
|
|
|
|
|
|
|
|
Hydro |
300 |
|
|
|
|
|
|
|
|
|
|
|
Bioenergy and waste |
|
|
|
|
|
|
|
|
|
|
|
Natural gas |
|
250 |
|
|
|
|
|
|
|
|
|
|
|
|
|
|
|
|
|
|
|
|
|
|
|
Oil |
|
200 |
|
|
|
|
|
|
|
|
|
|
|
|
|
|
|
|
|
|
|
|
|
|
|
Coal |
|
150 |
|
|
|
|
|
|
|
|
|
|
|
|
|
|
|
|
|
|
|
|
|
|
|
Nuclear |
|
100 |
|
|
|
|
|
|
|
|
|
|
|
|
50 |
|
|
|
|
|
|
|
|
|
|
|
|
0 |
1973 |
1977 |
1981 |
1985 |
1989 |
1993 |
1997 |
2001 |
2005 |
2009 |
2013 |
2017 |
|
The shares of natural gas, nuclear, and renewable energies have increased, whereas the contribution of coal has sharply declined in recent years.
Source: IEA (2019), World Energy Balances 2019 First edition (database), www.iea.org/statistics/.
Natural gas and renewables are replacing the shares of oil and coal. In 2017, natural gas accounted for 41% of the total generation, up from 20% in 2007 (Figure 8.2). Nuclear accounted for 21% of the electricity mix and delivers a stable base load to the grid. Several of the nuclear reactors are getting old, and the government is planning for new nuclear power plants to replace them (Chapter on Nuclear Energy).
Figure 8.2 Electricity supply by source, 2017
3% 2% |
|
|
|
7% |
|
|
Natural gas |
|
|
||
|
|
||
|
|
Nuclear |
|
|
|
|
|
11% |
41% |
|
Wind |
|
|
Biofuels and waste |
|
|
|
|
|
15% |
|
|
Coal |
|
|
|
Solar* |
21% |
|
|
Others |
Natural gas dominates the United Kingdom’s electricity supply, followed by nuclear power and an increasing share of renewable energy sources, which are replacing coal power.
* Others includes small shares of hydro and oil.
Source: IEA (2019), World Energy Balances 2019 First edition (database), www.iea.org/statistics/.
130
IEA. All rights reserved.

8. ELECTRICITY
In the past decade, RES have increased rapidly, particularly wind and biofuels, to account for 30% in 2017, fully in line with its national electricity from RES target under the EC Renewable Energy Directive (2009/28/EC). Together with nuclear power, the share of low-carbon power generation is over 50%, which places the United Kingdom around the median among International Energy Agency (IEA) member countries (Figure 8.3). The share of natural gas in the UK’s power supply is the fifth highest, after Mexico, Ireland, the Netherlands, and Italy.
Figure 8.3 Electricity generation by source in IEA countries, 2017
Poland |
|
|
|
|
|
Estonia* |
|
|
|
|
|
Australia |
|
|
|
|
|
Netherlands |
|
|
|
|
|
Mexico |
|
|
|
|
|
Japan |
|
|
|
|
|
Greece |
|
|
|
|
|
Ireland |
|
|
|
|
|
Turkey |
|
|
|
|
|
Korea |
|
|
|
|
|
Italy |
|
|
|
|
|
United States |
|
|
|
|
|
Portugal |
|
|
|
|
|
Czech Republic |
|
|
|
|
|
Germany |
|
|
|
|
|
UnitedUnitedKingdomKingdom |
|
|
|
|
|
Spain |
|
|
|
|
|
Hungary |
|
|
|
|
|
Belgium |
|
|
|
|
|
Denmark |
|
|
|
|
|
Luxembourg |
|
|
|
|
|
Austria |
|
|
|
|
|
Slovak Republic |
|
|
|
|
|
Canada |
|
|
|
|
|
Finland |
|
|
|
|
|
New Zealand |
|
|
|
|
|
France |
|
|
|
|
|
Norway |
|
|
|
|
|
Switzerland |
|
|
|
|
|
Sweden |
|
|
|
|
|
0% |
20% |
40% |
60% |
80% |
100% |
Oil |
Natural gas Coal |
Peat Nuclear |
Biofuels and waste Hydro |
Wind Solar |
Geothermal |
The United Kingdom has around the median share of fossil fuels in electricity generation among IEA countries, with the fifth-highest share of natural gas.
*Estonia’s coal represents oil shale.
Source: IEA (2019), World Energy Balances 2019 First edition (database), www.iea.org/statistics/.
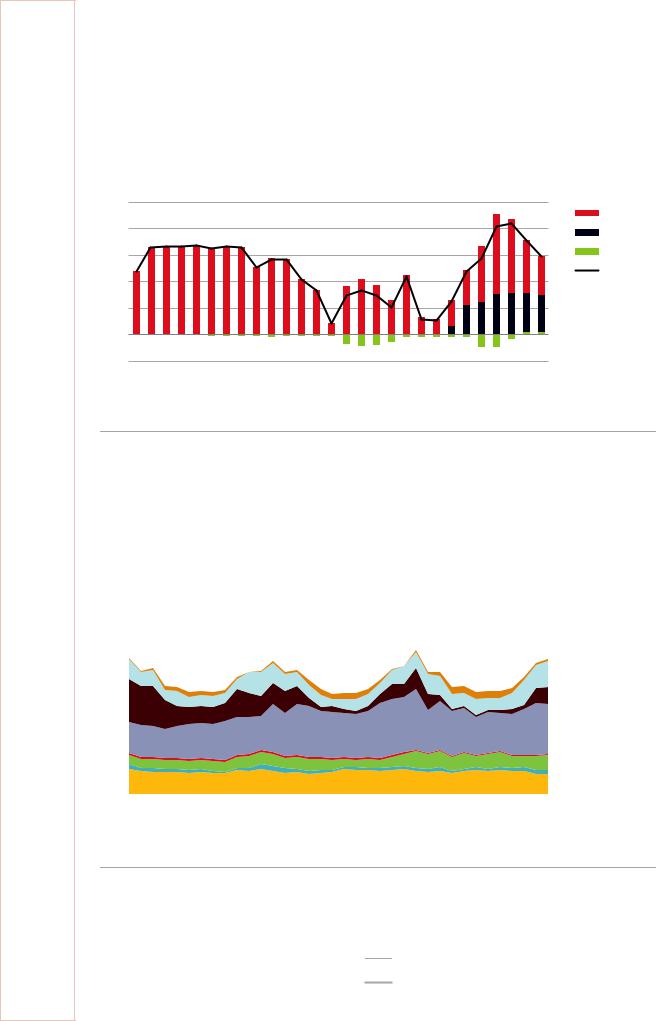
Electricity imports
The United Kingdom is interconnected with France, Belgium, Ireland, and the Netherlands through five interconnectors with a total capacity of 5 000 megawatts (MW). In recent years, electricity imports have become more important. In 2017, the United Kingdom imported 18.2 TWh and exported 3.4 TWh. Nearly all the trade is with France and the Netherlands, in total 14.0 TWh net imports (Figure 8.4). UK wholesale prices have been on the average higher than those on the European continent, and thereby attract an increasing power trade to the United Kingdom. Many new
131
ENERGY SECURITY
IEA. All rights reserved.
8. ELECTRICITY
interconnections have been proposed thanks to high day-ahead price differentials, which would raise the low interconnection levels (see Network adequacy below).
Seasonal variation in the production and consumption of electricity is crucially important for the security of supply.
Figure 8.4 Electricity imports and exports by country, 1990-2017
25 |
TWh |
|
|
|
Imports |
|
|
|
|
France |
|
|
|
|
|
|
|
|
|
||
20 |
|
|
|
|
|
|
|
|
|
Netherlands |
15 |
|
|
|
|
|
|
|
|
|
Ireland |
|
|
|
|
|
|
|
|
|
Net trade |
|
10 |
|
|
|
|
|
|
|
|
|
|
|
|
|
|
|
|
|
|
|
|
|
5 |
|
|
|
|
|
|
|
|
|
|
0 |
|
|
|
|
|
|
|
|
|
|
-5 |
|
|
|
|
Exports |
|
|
|
|
|
1990 |
1993 |
1996 |
1999 |
2002 |
2005 |
2008 |
2011 |
2014 |
2017 |
The level of interconnection between the United Kingdom and neighbouring markets is relatively low, but electricity trade has increased and new interconnectors are proposed.
Note: Data are provisional for 2017. Data on import/export country are not available for 2017. Source: IEA (2018a), Electricity Information, 2018, www.iea.org/statistics/.
Electricity production and consumption peak in the winter, with a higher demand for heating (Figure 8.5). The monthly electricity production profile shows that power generation from nuclear energy and biomass and waste is stable over the year, whereas coal and natural gas power are used as flexibles sources to cover the variations in demand. Solar and wind power are variable sources.
Figure 8.5 Monthly electricity generation by source, 2015-17
35 |
TWh |
|
|
|
|
|
|
|
|
Solar |
|
|
|
|
|
||
30 |
|
|
|
|
|
|
|
|
|
||
|
|
|
|
Wind |
|
|
|
|
|
||
25 |
|
|
|
|
|
|
|
|
|
Coal* |
|
|
|
|
|
||
|
|
|
|
||
20 |
|
|
|
|
Natural Gas |
|
|
|
|
||
|
|
|
|
||
15 |
|
|
|
|
Other fossil fuels** |
|
|
|
|
||
|
|
|
|
||
10 |
|
|
|
|
Biofuels*** |
|
|
|
|
||
|
|
|
|
||
5 |
|
|
|
|
Hydro |
|
|
|
|
||
|
|
|
|
||
|
|
|
|
Nuclear |
|
0 |
|
|
|
|
|
|
|
|
|
||
|
|
|
|
||
|
|
|
|
|
|
Jan-15 Apr-15 Jul-15 Oct-15 Jan-16 Apr-16 Jul-16 Oct-16 Jan-17 Apr-17 Jul-17 |
Oct-17 |
||||
The monthly electricity generation of nuclear and biofuels is stable over the year, whereas coal and natural gas power are used to cover seasonal demand variations.
*Coal includes peat and manufacturing gases.
**Other fossil fuels includes oil products and fossil waste.
***Biofuels includes renewable waste.
Source: IEA (2018a), Electricity Information 2018, www.iea.org/statistics/.
132
IEA. All rights reserved.