

5. ENERGY EFFICIENCY
old (UK Government, 2017a). Since 2005, the standards for gas boilers in the United Kingdom have been among the highest in the world.
More stringent standards for domestic heating came into force in April 2018 under the so-called policy (which amended the Domestic Building Services Compliance Guide). The standards apply in England only, whenever a new boiler is installed in an existing system. They require all gas boilers installed into existing systems to have an Energyrelated Products (ErP) directive (ErP) (Eco-design)4 efficiency of at least 92%, have time and temperature controls installed at the same time, and additional energy efficiency measures (weather compensation, load compensation, flue gas heat recovery, and smart controls) when replacing the boiler. This is estimated to improve the efficiency and control of around 1.2 million heating systems every year. The broader Boiler Plus policy does not apply to oil boilers; however, the policy did introduce a requirement for time and temperature controls to be installed alongside oil boilers in the rare cases where those controls are not yet in place.
As described in the Chapter 4, the Renewable Heat Incentive (RHI) supports renewable heat technologies, such as biomass, biomass combined heat and power, biomethane, biogas, heat pumps, solar thermal, and geothermal. Under the Clean Growth Strategy, the government aims to boost the development of heat networks to drive the long-term decarbonisation of heating. District heating represents only 2% of the total heat demand.
The UK gas distribution companies in the North of England (Northern Gas Networks and Cadent, together with Norway’s Equinor) have studied the potential of converting natural gas into hydrogen (and CO2, which could be stored offshore) to decarbonise heat with detailed plans for the switch to hydrogen in 2028 and a seven-year programme to convert 3.7 million homes and 40 000 businesses in cities such as Leeds, Newcastle, York, Manchester, and Liverpool (both using existing gas pipelines and building new ones).
The government aims to phase out the installation of high-carbon fossil fuel heating in new and existing buildings off the gas grid during the 2020s, initially with new buildings. As a first step towards this commitment, the government published the Future Framework for Heat in Buildings: Call for Evidence in March 2018 (UK Government, 2018b), with the objective to seek views on measures the government could take during the 2020s to phase out high-carbon fossil fuel heating in off gas grid buildings and recognised the importance of both heat decarbonisation and improving the energy efficiency of buildings.
Transport
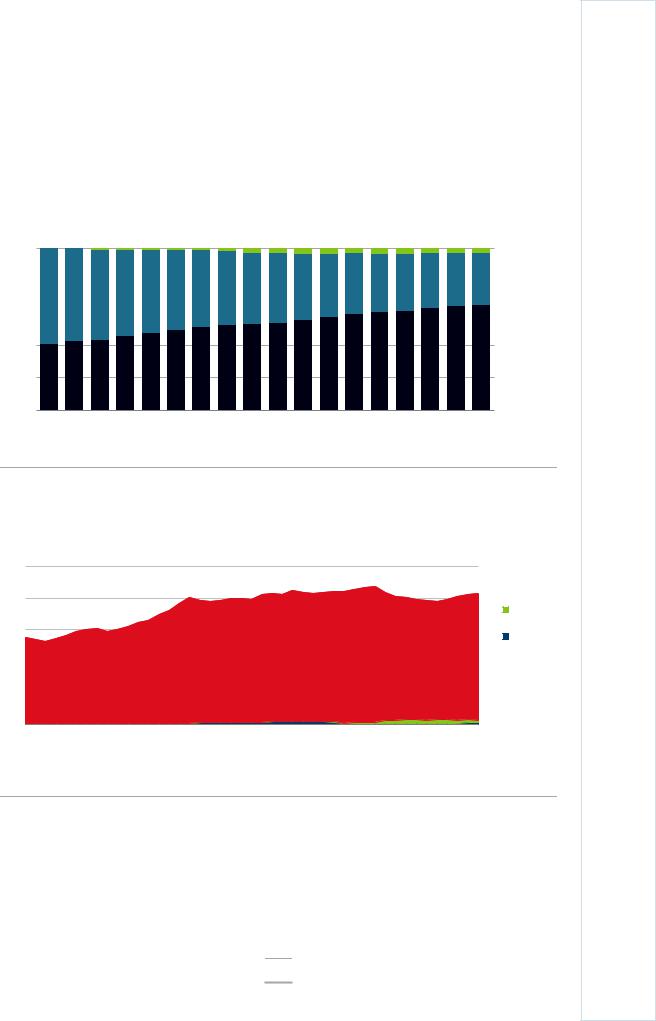
Transport accounts for around one-third of the TFC, and the share is increasing. In 2017, the transport sector consumed 41.5 Mtoe, up by 4% in the previous three years. Oil fuels accounted for 97% of total transport consumption in 2017, mainly diesel (65%) and gasoline (30%) and 2% from kerosene-type jet fuel in domestic aviation (Figure 5.10).
4 The ErP is an energy efficiency rating system introduced by the European Union in September 2015 and replaced the United Kingdom’s Seasonal Efficiency of Domestic Boilers UK rating system.
More information on the Boiler Plus policy is available at: https://assets.publishing.service.gov.uk/government/uploads/system/uploads/attachment_data/file/718569/Boiler_Plus_Fact sheet_v3.pdf
90
IEA. All rights reserved.
5. ENERGY EFFICIENCY
Biodiesel and biogasoline accounted for 1% each and electricity used in trains accounted for the remaining1% of transport energy demand (Figure 5.11).
Road transport made up 93% of the energy demand in transport in 2017 (IEA, 2019). The rest is consumed in rail, domestic navigation, and domestic aviation, with around 2% each (international navigation and aviation are not included in TFC). Of the total road transport, passenger vehicles, which include buses, account for around two-thirds of energy consumption and freight trucks for the remaining third (IEA, 2018).
Figure 5.10 Energy consumption in road transport by fuel, 2000-17
100%
80% |
|
|
|
Biofuels |
|
|
|
||
|
|
|
||
|
|
|
Gasoline |
|
|
|
|
||
|
|
|
||
60% |
|
|
|
Diesel |
|
|
|
||
|
|
|
||
|
|
|
|
40%
20%
0%
2000 2001 2002 2003 2004 2005 2006 2007 2008 2009 2010 2011 2012 2013 2014 2015 2016 2017
The share of diesel in road transport increased from 42% in 2000 to 65% in 2016.
Source: IEA (2019), World Energy Balances 2019 First edition (database), www.iea.org/statistics/.
Figure 5.11 TFC in transport by source, 1973-2017
Mtoe
50

 Oil
Oil
40 |
|
|
|
|
|
|
|
|
|
|
Biofuels |
|
|
|
|
|
|
|
|
|
|
|
|
30 |
|
|
|
|
|
|
|
|
|
|
Electricity |
|
|
|
|
|
|
|
|
|
|
|
|
20 |
|
|
|
|
|
|
|
|
|
|
|
10 |
|
|
|
|
|
|
|
|
|
|
|
0 |
|
|
|
|
|
|
|
|
|
|
|
1973 |
1977 |
1981 |
1985 |
1989 |
1993 |
1997 |
2001 |
2005 |
2009 |
2013 |
2017 |
Transport energy demand is relatively stable at around 40 Mtoe, and nearly completely dependent on oil-based fuels.
Note: The transport sector demand excludes international aviation and navigation.
Source: IEA (2019), World Energy Balances 2019 First edition (database), www.iea.org/statistics/.
Overall new car registrations have increased (Figure 5.12). The number of diesel cars has increased steadily since the 1980s, and in the past decade gasoline consumption has declined significantly in passenger cars and road transport as a whole (Figure 5.10). In 2017, diesel accounted for nearly half of the energy consumption in passenger cars and 65% of the total road transport energy use.
91
ENERGY SYSTEM TRANSFORMATION
IEA. All rights reserved.

5. ENERGY EFFICIENCY
Biofuels have also increased in the past decade, thanks to the biofuels blending policy, but accounts for only around 2% of energy use in road transport. The shift from gasoline to diesel in passenger cars contributed to improving the energy efficiency of the vehicle fleet. Between 2000 and 2016, energy consumption per travelled personal kilometre in passenger transport was reduced by 15%. However, an increased reliance on diesel vehicles also has a negative effect in terms of more local air pollution. Energy efficiency efforts are mainly expected to come from the further decarbonisation of the vehicle fleet (see Chapter on Energy and Climate Change).
Figure 5.12 New registered buses and passenger cars, 2004-17
18 000 |
Buses |
|
|
|
|
|
|
|
|
Vehicles (thousands) |
3 000 |
|
Buses, new |
||||
|
|
|
|
|
|
|
|
|
|
|
|||||||
|
|
|
|
|
|
|
|
|
|
|
|
|
|
|
|||
15 000 |
|
|
|
|
|
|
|
|
|
|
|
|
|
|
2 500 |
|
registrations (left |
|
|
|
|
|
|
|
|
|
|
|
|
|
|
|
axis) |
||
|
|
|
|
|
|
|
|
|
|
|
|
|
|
|
|||
|
|
|
|
|
|
|
|
|
|
|
|
|
|
|
|
|
|
12 000 |
|
|
|
|
|
|
|
|
|
|
|
|
|
|
2 000 |
|
Passenger cars, |
|
|
|
|
|
|
|
|
|
|
|
|
|
|
|
|||
|
|
|
|
|
|
|
|
|
|
|
|
|
|
|
|
|
new registrations |
9 000 |
|
|
|
|
|
|
|
|
|
|
|
|
|
|
1 500 |
|
(right axis) |
|
|
|
|
|
|
|
|
|
|
|
|
|
|
||||
6 000 |
|
|
|
|
|
|
|
|
|
|
|
|
|
|
1 000 |
|
Goods vehicles, |
|
|
|
|
|
|
|
|
|
|
|
|
|
|
|
|||
|
|
|
|
|
|
|
|
|
|
|
|
|
|
|
new registrations |
||
|
|
|
|
|
|
|
|
|
|
|
|
|
|
|
|||
|
|
|
|
|
|
|
|
|
|
|
|
|
|
|
|
|
|
3 000 |
|
|
|
|
|
|
|
|
|
|
|
|
|
|
500 |
|
(right axis) |
|
|
|
|
|
|
|
|
|
|
|
|
|
|
|
|
||
0 |
|
|
|
|
|
|
|
|
|
|
|
|
|
|
0 |
|
|
2004 |
2005 |
2006 |
2007 |
2008 |
2009 |
2010 |
2011 |
2012 |
2013 |
2014 |
2015 |
2016 |
2017 |
|
|
||
|
|
|
|
||||||||||||||
New registrations for both passenger cars and buses fell after the financial crisis of 2008, but buses have not recovered in the same way as new cars.
Source: European Commission (2018), Statistical Pocketbook 2018, DG Transport, https://ec.europa.eu/transport/facts-fundings/statistics/pocketbook-2018_en.
Industry
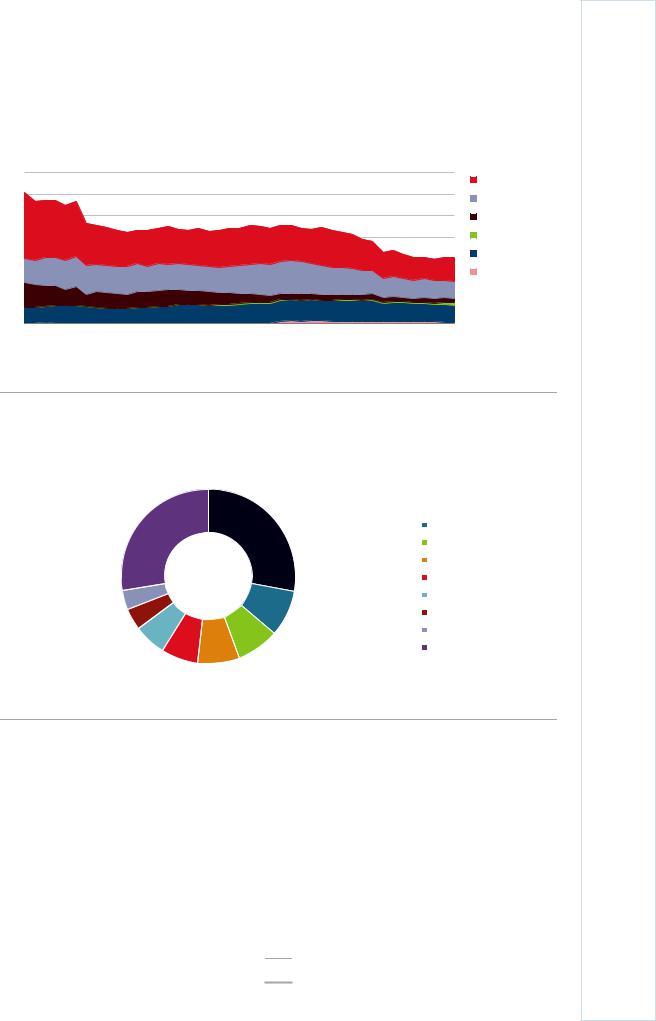
The industry sector has gone through the largest changes in the recent decade in terms of final energy consumption. From 2007 to 2017, industry energy consumption fell by 22%, but in recent years it has stabilised at around 30 Mtoe (Figure 5.13). In 2017, the total industry energy consumption was 30.3 Mtoe, of which 24% was the non-energy use of oil and gas in process industries.
Compared to other sectors, industrial energy consumption is more divergent in terms of fuels. In 2017, oil accounted for 36% of the industry energy demand. Two-thirds of the oil was used in non-energy purposes. Natural gas each accounted for 27% and electricity for 26% of the total energy consumption in industry, and the rest was coal (5%), bioenergy and waste (3%), and district heating (2%). Whereas all the other fuels have decreased in recent years, bioenergy and waste more than doubled between 2014 and 2017, in the attempt to decarbonise energy consumption in the sector.
The United Kingdom has a large chemical and petrochemical industry sector, which accounted for 28% of total energy consumption in industry in 2016 (Figure 5.14). Largest share of the chemical and petrochemical consumption was oil products (mainly liquefied petroleum gases, naphtha and ethane) used as feedstock in the processes. Other large energy consuming industries mostly use natural gas and electricity. Energy consumption has fallen across most industries in recent years. From 2006 to 2016, construction was the only industry sector to increase its energy consumption.
92
IEA. All rights reserved.
5. ENERGY EFFICIENCY
In 2017, industry accounted for 27% of the UK energy-related CO2 emissions and, therefore, energy efficiency and decarbonisation are mutually supportive (see also Chapter on Energy and Climate Change).
Figure 5.13 TFC in industry by source, 1974-2016
70 |
Mtoe |
|
|
|
|
|
|
|
|
|
|
|
|
|
|
|
|
|
|
|
|
|
|
|
|
|
|
|
|
Oil |
|
60 |
|
|
|
|
|
|
|
|
|
|
|
|
|
|
|
|
|
|
|
|
|
|
|
|
|
|
|
|
|
Natural gas |
|
|
|
|
|
|
|
|
|
|
|
|
|
|
|
|
|
50 |
|
|
|
|
|
|
|
|
|
|
|
|
|
|
Coal |
40 |
|
|
|
|
|
|
|
|
|
|
|
|
|
|
Biofuels and waste |
30 |
|
|
|
|
|
|
|
|
|
|
|
|
|
|
Electricity |
|
|
|
|
|
|
|
|
|
|
|
|
|
|
Heat |
|
20 |
|
|
|
|
|
|
|
|
|
|
|
|
|
|
|
|
|
|
|
|
|
|
|
|
|
|
|
|
|
|
|
10 |
|
|
|
|
|
|
|
|
|
|
|
|
|
|
|
0 |
|
|
|
|
|
|
|
|
|
|
|
|
|
|
|
1974 |
1977 |
1980 |
1983 |
1986 |
1989 |
1992 |
1995 |
1998 |
2001 |
2004 |
2007 |
2010 |
2013 |
2016 |
|
The industry sector’s energy consumption has declined by 25% over the past decade, but has stabilised at around 30 Mtoe in recent years.
Notes: Includes non-energy consumption.
Source: IEA (2019), World Energy Balances 2019 First edition (database), www.iea.org/statistics/.
Figure 5.14 Energy consumption in manufacturing industry sectors, 2017
|
|
|
Chemical and petrochemical* |
|
|
|
|
|
|
|
|
27% |
28% |
|
Food and tobacco |
|
Machinery* |
||
|
|
|
|
|
|
|
Non-metallic minerals |
|
|
|
Construction* |
4% |
8% |
|
Paper |
4% |
|
Transport equipment* |
|
|
|
||
6% |
8% |
|
Iron and steel |
7% |
|
||
8% |
|
Other** |
|
|
|
|
The chemical and petrochemical industry stands out as the industry with the highest fuel consumption, most of which is oil products used as feedstock in the processes.
*Includes fuels for non-energy use.
**Other industries include non-ferrous metals, wood and wood products, mining and quarrying, textile and leather, and non-specified industry consumption.
Source: IEA (2019), World Energy Balances 2019 First edition (database), www.iea.org/statistics/.
Policies
Energy efficiency improvements in industry are encouraged through several schemes, which include the Climate Change Agreement (CCA) scheme, the Carbon Reduction Commitment CRC Energy Efficiency Scheme (CRCEES), and the Energy Savings Opportunity Scheme (ESOS).
93
ENERGY SYSTEM TRANSFORMATION
IEA. All rights reserved.

5. ENERGY EFFICIENCY
The CCA scheme, which is voluntary, has been in place since 2001 and allows energyintensive participants in 53 sectors a reduced Climate Change Levy (CCL) in exchange for signing up to energy efficiency or carbon reduction targets. In 2015 and 2016, the number of industrial facilities that participated in the voluntary scheme fell slightly from 3 416 to 3 186. It was estimated at the start of the current scheme in 2013 that CCAs accounted for 13% of the total UK energy use, and 56% of the UK industrial energy use.
The CRCEES, based on the Carbon Reduction Commitment from April 2010, aims to improve energy efficiency and cut emissions for large public and private companies. There were 1 915 participants registered for 2016-17. The scheme features a range of drivers (information, reputational, and financial) that aim to encourage organisations to develop energy management strategies. The government has decided to close the CRCEES after the current phase (covering emissions to March 2019) ends, citing efforts to reduce red tape for industry and announcing that the reporting elements would be taken forward from April 2019 through a new streamlined energy and carbon framework extending to an estimated 11,900 participants. The UK central government departments and devolved administration also have to participate in the CRCEES.
The ESOS was launched in July 2014 and requires large companies (including electricity generators) to perform energy audits to meet the requirements of Article 8 in the EU EED. There are no exemptions from ESOS based on participation in the CCA scheme. The government estimates that ESOS covers around 50% of non-domestic electricity use and 60% of non-domestic gas use.
The Industrial Energy Efficiency Accelerator (IEEA) supports, with a total budget of GBP 9.2 million funding, innovation pilots in industry to lower the cost of near-market energy-efficient technologies for a range of industrial sectors through demonstration projects. IEEA is delivered by the Carbon Trust.
The CCAs and ESOS provide United Kingdom companies with an incentive to improve their energy management and performance. In the case of the ESOS, this incentive extends to the implementation of an energy management system certified to the ISO 50001 global standard. If at least 90% of a company’s energy use is covered by an ISO 50001 certification, it is seen to have complied with the obligations of the ESOS. There were 3 078 UK ISO 50001 certifications in 2017, which was 13% of the global total and made the United Kingdom second only to Germany in terms of number of certifications globally. After the introduction of the ESOS, ISO 50001 certifications in the United Kingdom nearly quadrupled from 376 in 2014 to 1 464 in 2015, with this number nearly doubling again in 2016. Although growth slowed in 2017 (only a 9% increase), the incentive provided by the ESOS for ISO 50001 certification does appear to have had some impact.
The Clean Growth Strategy commits to improving business energy efficiency at least by 20% by 2030 through a package of measures that includes: improved energy efficiency regulations for new and existing commercial buildings, raising minimum energy performance standards for rented property, introducing an industrial energy efficiency scheme, joint industrial energy efficiency and decarbonisation plans in seven areas, international leadership on carbon capture, usage, and storage (CCUS), while deploying CCUS at scale in the United Kingdom, phasing out fossil fuel heating in new and existing businesses that are not connected to the gas grid and encouraging the decarbonisation of industrial heat.
94
IEA. All rights reserved.

5. ENERGY EFFICIENCY
Industrial decarbonisation and energy efficiency action plans
Alongside the Clean Growth Strategy, BEIS announced seven action plans for energyintensive sectors (cement, ceramics, chemicals, food and drink, glass, oil refining, and pulp and paper), developed by government and industry together in the coming years to identify voluntary commitments (see Table 5.2). The plans build on the Industrial Decarbonisation and Energy Efficiency Roadmaps to 2050 (UK Government, 2015), which set out a series of potential pathways for emissions reductions that could be achieved in different decarbonisation scenarios. The action plans extend beyond energyintensive manufacturing sectors to capture less-intensive sectors, such as food and beverage manufacturing. These sectors have been identified by the IEA as a potential source of future energy savings as a result of measures to improve the efficiency of lowtemperature process heating through the deployment of electric heat pumps and to improve electric motor-driven systems through strengthened standards and increased adoption of energy management systems, such as ISO 50001. UK companies subject to the ESOS can obtain an exemption from the audit requirement if they obtain ISO 50001 certification, which provides some level of incentive for adoption.
Table 5.2 Seven industrial decarbonisation and energy efficiency action plans
|
Sector |
|
Pathway |
|
Base year |
|
|
Relative |
|
|
Absolute |
|
Technology groups |
|
|
|
|
|
|
|
|
|
|
|
|||||||
|
|
|
|
|
emissions |
|
|
emission |
|
|
emission |
|
|
|
|
|
|
|
|
|
(MtCO2e) |
|
|
reduction |
|
|
reduction in |
|
|
|
|
|
|
|
|
|
|
|
|
in 2050 |
|
2050 (MtCO2e) |
|
|
|
||
|
Cement |
BAU |
|
|
|
12% |
|
|
0.9 |
|
Others: energy efficiency |
||||
|
|
|
Max Tech – with |
7.5 |
|
33-62% |
|
|
2.5-4.7 |
|
CCS, fuel switching to biomass, |
||||
|
|
|
or without carbon |
|
|
|
|
|
|
|
|
|
|
others, and cementitious |
|
|
|
|
capture |
|
|
|
|
|
|
|
|
|
|
substitution |
|
|
|
|
|
|
|
|
|
|
|
|
|
||||
|
Ceramics |
|
BAU |
|
|
|
|
27% |
|
|
0.3 |
|
Energy efficiency, others, material |
|
|
|
|
|
|
|
|
|
|
|
|
|
|
|
|
efficiency, fuel switching, biomass |
|
|
|
|
Max Tech |
|
1.3 |
|
|
60% |
|
|
0.8 |
|
Electrification of heat, CCS, |
|
|
|
|
|
|
|
|
|
|
|
|
|
|
|
|
energy efficiency, biomass, |
|
|
|
|
|
|
|
|
|
|
|
|
|
|
|
others, material efficiency, fuel |
|
|
|
|
|
|
|
|
|
|
|
|
|
|
|
switching |
|
|
Chemicals |
BAU |
|
|
|
31% |
|
|
5.8 |
|
Biomass, energy efficiency, CCS, |
||||
|
|
|
|
|
|
|
|
|
|
|
|
|
|
fuel switching, clustering, others |
|
|
|
|
Max Tech – with |
18.4 |
|
79-88% |
|
|
14.6-16.1 |
|
CCS, biomass, others, energy |
||||
|
|
|
|
|
|
|
|
|
|||||||
|
|
|
and without |
|
|
|
|
|
|
|
|
|
|
efficiency, clustering, fuel |
|
|
|
|
biomass |
|
|
|
|
|
|
|
|
|
|
switching |
|
|
|
|
|
|
|
|
|
|
|
|
|
||||
|
Food and |
|
BAU |
|
|
|
|
40% |
|
|
3.8 |
|
Energy efficiency, biomass, |
|
|
|
drink |
|
|
|
|
|
|
|
|
|
|
|
|
electrification of heat, material |
|
|
|
|
|
|
|
|
|
|
|
|
|
|
|
efficiency, CCS, other, fuel |
|
|
|
|
Max Tech – with |
|
9.5 |
|
|
66-75% |
|
|
6.2-7.2 |
|
switching |
|
|
|
|
|
|
|
|
|
|
|
|
|
|||||
|
|
|
and without |
|
|
|
|
|
|
|
|
|
|
Electrification of heat, energy |
|
|
|
|
electrification of |
|
|
|
|
|
|
|
|
|
|
efficiency, biomass, other, |
|
|
|
|
heat |
|
|
|
|
|
|
|
|
|
|
material efficiency, CCS, fuel |
|
|
|
|
|
|
|
|
|
|
|
|
|
|
|
switching |
|
|
Glass |
BAU |
2.2 |
|
36% |
|
|
0.8 |
|
Energy efficiency, material |
|||||
|
|
|
|
|
|
|
|
|
|
|
|
efficiency, other, fuel switching |
|||
|
|
|
|
|
|
|
|
|
|
|
|
|
|
||
|
|
|
|
|
|
|
|
|
|
|
|
|
|
|
|
|
|
|
|
|
|
|
|
|
|
|
|
|
|
|
|
|
|
|
|
|
|
|
95 |
|
|
|
|
|
|||
|
|
|
|
|
|
|
|
|
|
|
|
|
|
|
|
ENERGY SYSTEM TRANSFORMATION
IEA. All rights reserved.