

5. ENERGY EFFICIENCY
Energy consumption trends, efficiency, and policies
In 2017, the residential and commercial sectors (including small shares for agriculture, forestry, and fishing) together accounted for 44% of the TFC in the United Kingdom. Transport consumed the second largest share with 33% of the TFC. Industry, including the non-energy use of fuels, accounted for the remaining 24%.
Residential and commercial
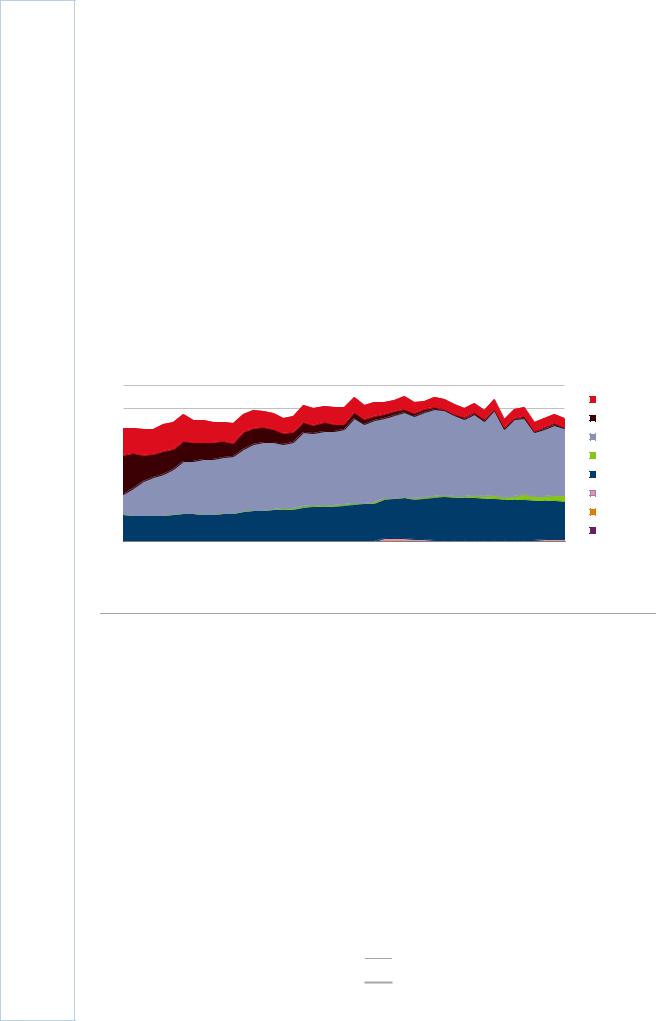
Residential and commercial energy consumption consists mainly of energy use in buildings, largely for heating. The long-term trend in building energy consumption has been a shift from oil and coal consumption towards natural gas and electricity (Figure 5.6). In 2017, the residential and commercial sectors consumed 55.5 Mtoe, of which 54% was natural gas and 31% electricity. The rest was mainly oil (8%) and biofuels (4%), and small shares of coal, district heating, solar, and geothermal.
Figure 5.6 TFC in residential and commercial sectors by source, 1973-2017
70 |
Mtoe |
|
|
|
|
|
|
|
|
|
|
|
|
|
|
|
|
|
|
|
|
|
|
Oil |
|
60 |
|
|
|
|
|
|
|
|
|
|
|
|
|
|
|
|
|
|
|
|
|
|
|
Coal |
|
50 |
|
|
|
|
|
|
|
|
|
|
|
|
|
|
|
|
|
|
|
|
|
|
|
Natural gas |
|
|
|
|
|
|
|
|
|
|
|
|
|
|
40 |
|
|
|
|
|
|
|
|
|
|
|
Bioenergy |
30 |
|
|
|
|
|
|
|
|
|
|
|
Electricity |
20 |
|
|
|
|
|
|
|
|
|
|
|
Heat* |
|
|
|
|
|
|
|
|
|
|
|
|
|
10 |
|
|
|
|
|
|
|
|
|
|
|
Solar* |
|
|
|
|
|
|
|
|
|
|
|
Geothermal* |
|
0 |
|
|
|
|
|
|
|
|
|
|
|
|
|
|
|
|
|
|
|
|
|
|
|
|
|
1973 |
1977 |
1981 |
1985 |
1989 |
1993 |
1997 |
2001 |
2005 |
2009 |
2013 |
2017 |
|
Natural gas and electricity together accounted for 86% of the total energy consumption in the residential and commercial sectors in 2017.
* Negligible.
Note: The commercial sector includes commercial and public services, agriculture, forestry, and fishing. Source: IEA (2019), World Energy Balances 2019 First edition (database), www.iea.org/statistics/.
Improved energy efficiency in buildings has contributed to a reduction in the total energy consumption in the residential and commercial sectors. From 2007 to 2017, energy consumption declined by 7% (as shown in Figure 5.4). However, despite recent improvements, the United Kingdom is still among the highest energy consumption per floor area for residential space heating in the IEA. In 2015, buildings in the United Kingdom consumed on average 0.49 gigajoules per square metre (GJ/m2), which was the fourth-highest level among IEA member countries and shows the potential for further improvements (IEA, 2018).
Space and water heating account for most of energy consumption in buildings. In the residential sector, nearly 80% of energy consumption is for heating, and the remaining mostly household appliances (Figure 5.7). The main source of heating in the United Kingdom is natural gas.
86
IEA. All rights reserved.

5. ENERGY EFFICIENCY
Thanks to the improved energy efficiency in buildings, residential space heating demand has reduced significantly (see details on building stock in Box 5.1 and Figure 5.8). Between 2000 and 2015, energy use for space heating of one square metre fell by 28% (after temperature corrections) thanks to a switch to high-efficiency condensing boilers.
Unlike heating, energy consumption for appliances has increased slightly in recent decade because efficiency improvements have been outpaced by the growth in energy consumption in personal computers (PCs) and other devices.
Figure 5.7 Breakdown of the TFC in the residential sector, 2016
Lighting |
Cooking |
|
|
3% |
2% |
|
|
|
|
|
|
|
Water |
Refrigerators |
|
|
3% |
||
heating |
|
||
Washing |
|||
|
12% |
||
|
equipment |
||
|
|
||
|
Residential |
3% |
|
Space heating |
appliances |
|
|
16% |
|
||
71% |
|
TVs 5% |
|
|
|
|
|
|
|
PCs 1% |
|
Most of the energy consumption in residential buildings is for heating purposes, and space and water heating together account for over 80% of the total energy demand in the sector.
Source: IEA (2018), Energy Efficiency Indicators 2018, www.iea.org/statistics/.
Figure 5.8 Residential energy intensity, 2000 and 2016 |
|
|
GJ/m2 |
GJ/dwelling |
|
0.6 |
12 |
2000 |
|
|
|
0.5 |
10 |
2016 |
0.4 |
8 |
|
0.3 |
6 |
|
0.2 |
4 |
|
0.1 |
2 |
|
0 |
0 |
|
Space heating (TC*) |
Water heating |
Residential appliances |
The United Kingdom has significantly improved energy intensity for space and water heating in residential buildings, but still has among the least-energy-efficient buildings in the IEA.
Source: IEA (2018), Energy Efficiency Indicators 2018, www.iea.org/statistics/.
87
ENERGY SYSTEM TRANSFORMATION
IEA. All rights reserved.

5. ENERGY EFFICIENCY
Box 5.1 Housing stock in the United Kingdom
The United Kingdom has one of the oldest housing stocks in Europe with over one-third of homes built before 1945 and less than a quarter built since 1980. The commercial building stock is more modern with 40% of the stock built in the past 30 years (UK Government, 2017c and 2017d). The UK housing stock is growing by around 150-200 thousand new permanent dwellings per year (Figure 5.9). This corresponds to roughly 0.5% of the total housing stock in the United Kingdom. The number of new dwellings fell in 2008-10 during the financial crisis, but has picked up in recent years. However, the construction rate is significantly lower than in the 1950-70s, when local authorities investedd in housing. Most new dwellings are built by private enterprises and a smaller share by housing associations. In 2017, private enterprises accounted for 82% of the total 195 000 new dwellings.
Figure 5.9 New completed permanent dwellings in the United Kingdom by tenure, 1949-2017
450 000 |
New permanent dwellings |
||||||||||||||||
|
|
|
|
|
|
|
|
|
|
|
|
|
|
|
|
Local authorities |
|
|
|
|
|
|
|
|
|
|
|
|
|
|
|
|
|
||
400 000 |
|
|
|
|
|
|
|
|
|
|
|
|
|
|
|
|
|
|
|
|
|
|
|
|
|
|
|
|
|
|
|
|
|
||
|
|
|
|
|
|
|
|
|
|
|
|
|
|
|
|
Housing associations |
|
350 000 |
|
|
|
|
|
|
|
|
|
|
|
|
|
|
|
|
|
|
|
|
|
|
|
|
|
|
|
|
|
|
|
|
|
||
|
|
|
|
|
|
|
|
|
|
|
|
|
|
|
|
||
300 000 |
|
|
|
|
|
|
|
|
|
|
|
|
|
|
|
|
Private enterprises |
|
|
|
|
|
|
|
|
|
|
|
|
|
|
|
|
||
250 000
200 000
150 000
100 000
50 000
0
1949 1953 1957 1961 1965 1969 1973 1977 1981 1985 1989 1993 1997 2001 2005 2009 2013 2017
Around 200 000 new dwellings are built in the United Kingdom every year, mostly by private companies.
Source: UK Government (2018a), Live Tables on Housing Supply: Net Additional Dwellings”, www.gov.uk/government/statistical-data-sets/live-tables-on-house-building;
MHCLG (2017b), Dwelling Stock Estimates: 2017, England, https://assets.publishing.service.gov.uk/government/uploads/system/uploads/attachment_data/file/710382/Dwellin g_Stock_Estimates_2017_England.pdf.
Buildings
The United Kingdom has been implementing energy performance certificates (EPCs) for buildings that are bought, sold, or rented to provide certificates graded on a scale of A (most efficient) to G (least efficient).
The Energy Efficiency (Private Rented Property) (England and Wales) Regulations 2015 set new standards for energy efficiency in rented property. As of 1 April 2018, such property must be at minimum EPC band E before they can be let on a new tenancy. Part L (Conservation of fuel and power) of the Building Regulations sets minimum energy performance standards for new buildings and for works to existing buildings (i.e. extensions, conversions, and replacement windows and boilers).
Since 1996, the proportion of dwellings in the lowest energy efficiency bands F or G has decreased to 5% or 1 in 20 homes, most of them being rented property or social housing.
88
IEA. All rights reserved.

5. ENERGY EFFICIENCY
Over half of the social housing dwellings have standards below EPC band C (MHCLG, 2017a). Therefore, recent government efforts focus on upgrading the performance of houses for the fuel poor3 and for rental property (EPC E as of April 2018) as well as social housing.
The Clean Growth Strategy (UK Government, 2017b) aims to upgrade the energy performance of buildings of all the fuel poor to EPC band C by 2030 and as many homes as possible by 2035, where practical, cost-effective, and affordable. The Committee on Climate Change (CCC) flagged in their assessment of the Clean Growth Strategy the need to improve significantly the energy efficiency standards for new buildings to avoid costly retrofitting (CCC, 2018). The buildings mission, announced through the Clean Growth Grand Challenge, aims to at least halve the energy use of new buildings by 2030 using new technologies and modern construction practices. This includes a building’s use of energy for heating, cooling, and appliances.
An independent review of building regulations and fire safety, led by Dame Judith Hackitt, concluded that “what is being designed is not what is being built” and that a new system approach to buildings regulations design, implementation, and compliance was needed with a focus on the health and safety of multi-occupancy higher-risk residential buildings that are ten storeys or more in height (Hackitt, 2018). The government intends to consult on amending the building regulations to promote low-carbon and higherenergy efficiency heating, ventilation, and air conditioning.
The United Kingdom was the first country to introduce, in 1994, an obligation on suppliers to meet energy efficiency targets by upgrading insulation or appliances (through the Energy Efficiency Standards Performance and later the Energy Efficiency Commitment). Today, the ECO requires large energy suppliers to deliver energy efficiency improvements, such as insulation and heating system upgrades. ECO focuses on the poorest and most vulnerable households. Since ECO was introduced in 2013, it has installed over 2.4 million measures in over 1.8 million homes. Final costs are paid by the consumers with an estimated total cost of British pounds (GBP) 640 million per year. ECO is set to continue until 2022 (Clean Growth Strategy).
Several other energy efficiency schemes were funded through general taxation, which included the Green Deal Home Improvement Fund (2014-15), the Green Deal Communities Fund (2014), the Central Heating Fund (2015), and the Thermal Efficiency Innovation Fund (2017-18). A green deal loan scheme (pay as you save) did not get the level of take up that was hoped for and the government investment in it ended in 2015, although the statutory framework remains and new owners bought the Green Deal Finance Company in 2017.
Heat
In the United Kingdom, 85% of dwellings had gas central heating in 2016 (UK Government, 2017a). One-third of the boilers in these systems are less than three years old, but almost two-thirds of warm air systems and storage radiators are over 12 years
3 The definition of fuel poor differs across the UK. In England, a household is deemed to be in fuel poverty if it has required heating costs that are above the national median, and meeting these costs places the household below the official poverty line (60% of median income). In 2015, around 11% of households were in fuel poverty in England.
89
ENERGY SYSTEM TRANSFORMATION
IEA. All rights reserved.