


5. Energy efficiency
Key data
(2017)
TFC: 127.3 Mtoe (oil 43.4%, natural gas 30.1%, electricity 20.3%, biofuels and waste 3.4%, coal 1.7%, heat 1.0%) -11% since 2007.
Consumption by sector: transport 32.6%, residential 29.0%, industry 23.8%, commercial 14.6%.
Energy consumption (TFC) per capita: 1.9 toe (IEA average: 2.9 toe), -17% since 2007.
Energy intensity (TFC/GDP PPP): 49.0 toe/USD million PPP (IEA average: 73.9), -20% since 2007.
Overview
Improving energy efficiency is central to meeting the United Kingdom’s long-term goal of cutting greenhouse gas (GHG) emissions by at least 80% from 1990 to 2050. In the past decade, the United Kingdom has managed to decouple its total final consumption (TFC) of energy from its economic growth and increasing population (Figure 5.1), thanks to energy efficiency improvements and structural changes in the economy.
Figure 5.1 Energy consumption and drivers, 1990-2017
Index 1990 |
|
|
|
|
|
|
|
|
|
1.8 |
|
|
|
|
|
|
|
|
GDP |
1.6 |
|
|
|
|
|
|
|
|
|
|
|
|
|
|
|
|
|
Population |
|
|
|
|
|
|
|
|
|
|
|
1.4 |
|
|
|
|
|
|
|
|
TFC |
|
|
|
|
|
|
|
|
|
|
1.2 |
|
|
|
|
|
|
|
|
TFC/capita |
|
|
|
|
|
|
|
|
|
|
1.0 |
|
|
|
|
|
|
|
|
TFC/GDP |
0.8 |
|
|
|
|
|
|
|
|
|
0.6 |
|
|
|
|
|
|
|
|
|
0.4 |
|
|
|
|
|
|
|
|
|
1990 |
1993 |
1996 |
1999 |
2002 |
2005 |
2008 |
2011 |
2014 |
2017 |
Despite a 72% increase in gross domestic product (GDP PPP) and 15% growth in population from 1990 to 2017, the TFC has declined by 8%, illustrating their decoupling.
Note: GDP data are in US dollars (USD) 2010 prices and Purchase Power Parity (PPP).
Source: IEA (2019), World Energy Balances 2019 First edition (database), www.iea.org/statistics/.
79
ENERGY SYSTEM TRANSFORMATION
IEA. All rights reserved.
5. ENERGY EFFICIENCY
Total final energy consumption
In 2017, the United Kingdom’s TFC was 127 million tonnes of oil equivalent (Mtoe), 11% lower than in 2007. The largest drop in TFC was in the industry sector, which fell by 22% between 2007 and 2017, whereas the residential sector decreased its consumption by 11% and the transport and commercial sectors remained relatively stable.
The transport sector is the largest energy-consuming sector (33% of the TFC in 2017), mainly road transport. The residential sector is the second largest (29%) with industry the third (24%), as illustrated in Figure 5.2.
Figure 5.2 TFC by sector, 1973-2017
Mtoe
160 |
|
|
|
|
|
|
|
|
|
|
Residential |
140 |
|
|
|
|
|
|
|
|
|
|
|
|
|
|
|
|
|
|
|
|
|
|
|
120 |
|
|
|
|
|
|
|
|
|
|
Commercial* |
|
|
|
|
|
|
|
|
|
|
|
|
100 |
|
|
|
|
|
|
|
|
|
|
Industry** |
80 |
|
|
|
|
|
|
|
|
|
|
Transport |
|
|
|
|
|
|
|
|
|
|
|
|
60 |
|
|
|
|
|
|
|
|
|
|
|
40 |
|
|
|
|
|
|
|
|
|
|
|
20 |
|
|
|
|
|
|
|
|
|
|
|
0 |
|
|
|
|
|
|
|
|
|
|
|
1973 |
1977 |
1981 |
1985 |
1989 |
1993 |
1997 |
2001 |
2005 |
2009 |
2013 |
2017 |
The transport sector is the largest energy consumer with 32% of the TFC and the total energy consumption slightly increased in recent years.
*Commercial includes commercial and public services, agriculture, and forestry. **Industry includes non-energy consumption.
Source: IEA (2019), World Energy Balances 2019 First edition (database), www.iea.org/statistics/.
Figure 5.3 TFC by source and sector, 2017
Industry* |
|
|
|
|
|
|
|
|
|
|
|
|
|
3% |
|
|
|
|
|
2% |
|
|
Oil |
|
|
|
|
|
|
|
|
|
|
|
|
|
|
|
|
|
|
|
|
|
|||||
|
|
|
36% |
|
|
|
27% |
|
|
5% |
|
|
26% |
|
|
|||||||||
|
|
|
|
|
|
|
|
|
|
Natural gas |
||||||||||||||
|
|
|
|
|
|
|
|
|
|
|
|
|
|
|
|
|
|
|
|
|
2%1% |
|
|
|
Transport |
|
|
|
|
|
|
|
|
|
|
|
|
|
|
|
|
|
|
|
|
|
|
Coal |
|
|
|
|
|
|
|
|
|
97% |
|
|
|
|
|
|
|
|
|
|
|
|
|
|||
|
|
|
|
|
|
|
|
|
|
|
|
|
|
|
|
|
|
|
|
|
||||
|
|
|
|
|
|
|
|
|
|
|
|
|
|
|
|
|
|
|
|
|
Bioenergy and waste |
|||
|
|
|
|
|
|
|
|
|
|
|
|
|
|
1% |
|
|
|
|
|
|
|
|
||
|
|
|
|
|
|
|
|
|
|
|
|
|
|
|
|
|
|
|
|
|
|
|||
Residential |
|
6% |
|
|
|
62% |
|
|
|
|
|
|
|
5% |
|
|
|
25% |
|
|
Electricity |
|||
|
|
|
|
|
|
|
|
|
|
|
|
|
|
|
|
|||||||||
|
|
|
|
|
|
|
|
|
|
|
|
|
|
|
|
|||||||||
Commercial** |
|
|
|
|
|
|
|
|
|
|
|
|
|
|
|
|
|
|
|
|
2% |
|
|
Heat |
|
|
|
|
|
|
|
|
|
|
|
|
|
|
|
|
|
|
|
|
|
|
|||
|
10% |
|
|
39% |
|
|
|
4% |
|
|
|
45% |
|
|
|
|
|
|
||||||
Total |
|
|
|
|
|
|
|
|
|
|
|
|
|
2% 3% |
|
1% |
|
|
|
|||||
|
|
|
43% |
|
|
|
|
|
30% |
|
|
|
|
|
|
|
|
20% |
|
|
|
|||
|
|
|
|
|
|
|
|
|
|
|
|
|
|
|
|
|
|
|
|
|
|
|
|
|
|
0% |
|
20% |
40% |
|
|
60% |
|
80% |
100% |
|
|
||||||||||||
Oil is the largest energy carrier overall and dominates in the transport sector, whereas natural gas and electricity account for considerable shares in all the other sectors.
*Industry includes non-energy consumption.
**Commercial includes commercial and public services, agriculture, and forestry.
Source: IEA (2019), World Energy Balances 2019 First edition (database), www.iea.org/statistics/.
80
IEA. All rights reserved.
5. ENERGY EFFICIENCY
Oil is the largest energy source in the United Kingdom’s final energy consumption, at 43% of TFC in 2016 (Figure 5.3). Most oil is consumed in transport, but it also has a large share in the industry sector. Natural gas is the second-largest source, at 30.8% of TFC. It accounts for the main part of residential energy consumption, and it has the second-largest shares in industry and commercial sectors. Electricity accounts for a considerable share in all the sectors except in transport and it is particularly important in the commercial sector. In recent years, biofuels have increased steadily in the residential and industry sectors.
Energy intensity
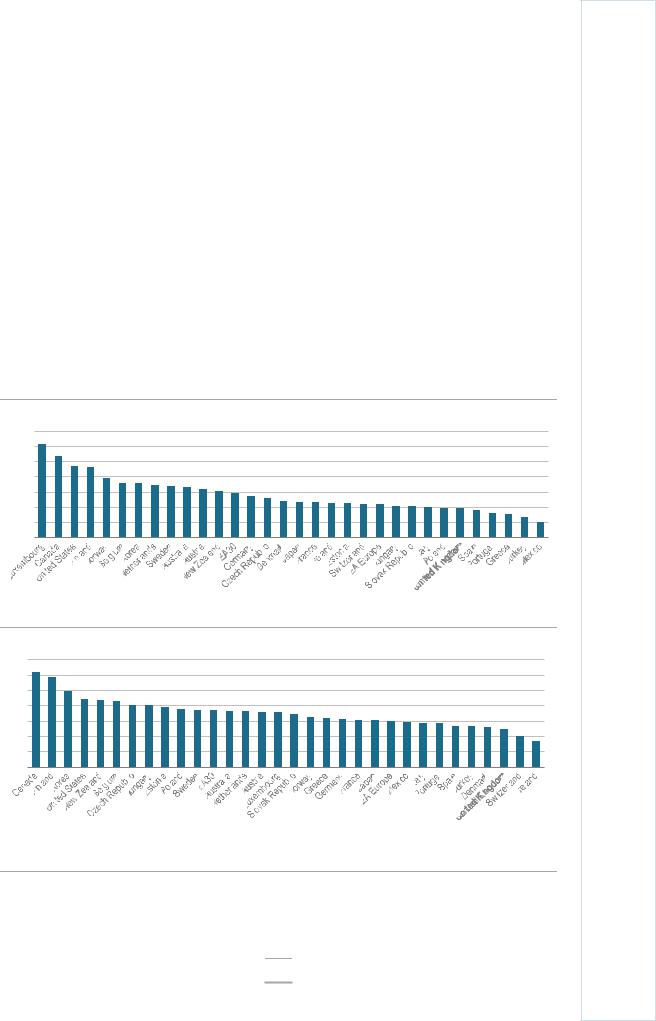
The United Kingdom has a relatively low energy intensity compared to other International Energy Agency (IEA) member countries, both by capita and by GDP (Figure 5.4). In 2017, the United Kingdom had the sixth-lowest TFC per capita, 18% below the IEA median. Furthermore, the United Kingdom had the third-lowest TFC per unit of GDP, 29% below the IEA median.
Figure 5.4 Energy intensity in IEA member countries, 2017
Energy consumption per capita (TFC/CAP)
7 toe/capita
6
5
4
3
2
1
0
Energy consumption per GDP (TFC/GDP)
140 toe/USD million PPP
120
100
80
60
40
20
0
In an IEA comparison, the United Kingdom has the sixth-lowest final energy consumption per capita and the third lowest consumption per GDP.
Notes: toe = tonnes of oil equivalent. Energy intensity in total final energy consumption, not including the energy transformation sector. GDP data are in USD billion 2010 prices and PPP.
Source: IEA (2019), World Energy Balances 2019 First edition (database), www.iea.org/statistics/.
81
ENERGY SYSTEM TRANSFORMATION
IEA. All rights reserved.