

4. RENEWABLE ENERGY
Supply and demand
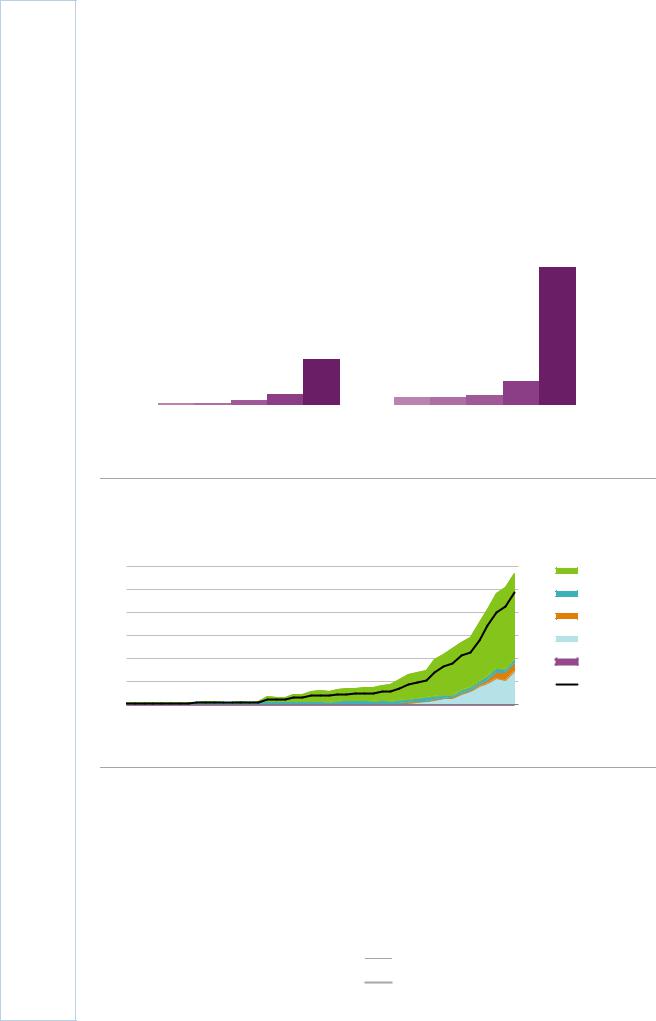
Renewable energy supply has increased significantly in the United Kingdom over the past decade. The share of renewable energy in the total primary energy supply (TPES) has grown from 2% in 2007 to 10% in 2017 and its share in electricity generation increased from 5% to 30% (Figure 4.1).
Figure 4.1 Share of renewable energy in TPES and electricity generation,
1977-2017 |
|
|
|
|
||
35% |
|
|
|
|
1977 |
|
|
|
|
|
|||
30% |
|
|
|
|||
|
|
|
|
1987 |
||
|
|
|
||||
|
|
|||||
|
|
|
||||
25% |
|
|
|
1997 |
||
|
|
|||||
|
|
|
|
2007 |
||
20% |
|
|
|
|||
|
|
|||||
|
|
|||||
|
|
|
|
2017 |
||
|
|
|
|
|||
15% |
|
|
|
|||
|
|
|||||
|
|
|
|
|
||
|
|
|
|
|
||
10% |
|
|
|
|
|
|
|
|
|
|
|
||
5% |
|
|
|
|
|
|
|
|
|
|
|
||
0% |
|
|
|
|
|
|
TPES |
Electricity generation |
|||||
|
||||||
In the past decade, the United Kingdom has sharply increased the share of renewable energy in its primary energy supply and electricity generation.
Source: IEA (2019), World Energy Balances 2019 First edition (database), www.iea.org/statistics/.
Figure 4.2 Renewable energy and waste in TPES, 1990-2017
18 |
Mtoe |
|
|
|
|
|
|
|
|
|
|
12% |
Bioenergy* |
|
|
|
|
|
|
|
|
|
|
|
|||
|
|
|
|
|
|
|
|
|
|
|
|
|
|
15 |
|
|
|
|
|
|
|
|
|
|
|
10% |
Hydro |
|
|
|
|
|
|
|
|
|
|
|
|
|
|
12 |
|
|
|
|
|
|
|
|
|
|
|
8% |
Solar |
|
|
|
|
|
|
|
|
|
|
|
|
|
|
9 |
|
|
|
|
|
|
|
|
|
|
|
6% |
Wind |
6 |
|
|
|
|
|
|
|
|
|
|
|
4% |
Geothermal** |
3 |
|
|
|
|
|
|
|
|
|
|
|
2% |
Renewables share |
0 |
|
|
|
|
|
|
|
|
|
|
|
0% |
(right axis) |
|
|
|
|
|
|
|
|
|
|
|
|
||
1973 |
1977 |
1981 |
1985 |
1989 |
1993 |
1997 |
2001 |
2005 |
2009 |
2013 |
2017 |
|
|
Bioenergy and waste is the largest RES in the primary energy supply.
*Bioenergy includes primary solid biofuels, liquid biofuels, biogases and renewable municipal waste.
**Negligible.
Source: IEA (2019), World Energy Balances 2019 First edition (database), www.iea.org/statistics/.
Renewable energy in the TPES
In 2017, the supply of renewable energy in the United Kingdom was 17.1 million tonnes of oil-equivalent (Mtoe), 9.7% of the TPES. The share of renewable energy in the TPES has increased since the 1990s, mostly thanks to the rapid increase of bioenergy and waste supply; the growth has been particularly remarkable since 2009 (Figure 4.2).
56
IEA. All rights reserved.
4. RENEWABLE ENERGY
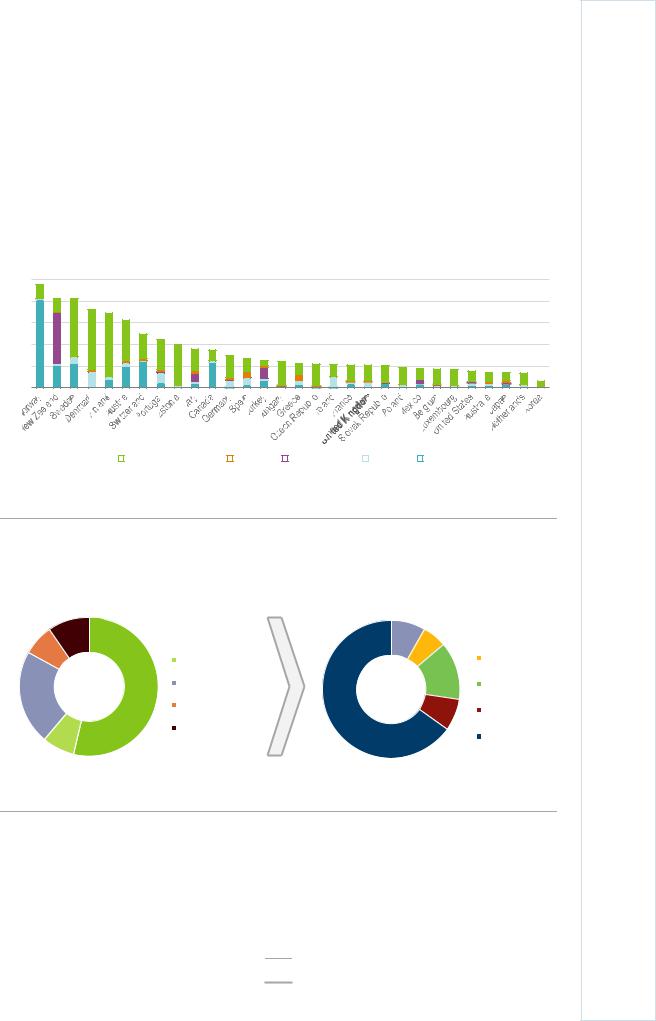
Nevertheless, the United Kingdom has the eleventh lowest share of renewable energy in the TPES among the International Energy Agency (IEA) member countries (Figure 4.3). Bioenergy and waste was the largest source of renewable energy in TPES at 7.1% (including 1.2 Mtoe non-renewable waste). Bioenergy and waste includes primary solid biofuels (54%), biogas (22%), wastes (17%), and transport biofuels (7%) (Figure 4.4). Energy transformation accounts for nearly two-thirds of the biofuel and waste demand, followed by the residential and industry sectors. The second-largest renewable energy is wind, with 2.4% in the TPES in 2017.
Figure 4.3 Renewable energy and waste as a percentage of the TPES in IEA member countries, 2017
50% |
40% |
30% |
20% |
10% |
0% |
|
Biofuels and waste |
|
Solar |
|
Geothermal |
|
Wind |
|
Hydro |
|
|
|
|
|
|||||
|
|
|
|
|
The United Kingdom has the eleventh lowest share of renewable energy in TPES among IEA member countries.
Note: Includes non-renewable waste.
Source: IEA (2019), World Energy Balances 2019 First edition (database), www. |
|
|
|
. |
|
|
|||||
|
|
|
|
|
|
|
|
|
|
||
Figure 4.4 Bioenergy and waste supply by source and |
|
|
sector, 2017 |
||||||||
10% |
|
|
Primary solid biofuels |
|
|
8% |
6% |
|
|
|
Industry |
|
|
|
|
|
|
|
|||||
|
|
|
|
|
|
|
|
||||
7% |
|
|
Liquid biofuels* |
|
|
|
|
|
|
Commercial |
|
|
|
|
|
|
|
|
|
|
|
||
22% |
|
|
Biogases |
|
|
|
14% |
|
|
Residential |
|
54% |
|
|
|
|
|
|
|
|
|||
|
|
|
|
|
|
|
|
|
|
||
|
|
Renewable waste |
|
|
|
7% |
|
|
|
|
|
|
|
|
65% |
|
|
|
|
|
Transport |
||
7% |
|
|
Non-renewable |
|
|
|
|
|
|
|
Energy |
|
|
waste |
|
|
|
|
|
|
|
||
|
|
|
|
|
|
|
|
|
|
||
|
|
|
|
|
|
|
|
|
|
|
transformation** |
In 2017, primary solid biofuels accounted for over half of bioenergy and waste, and around two-thirds of bioenergy and waste were used in heat and power generation.
*Includes biodiesel and biogasoline, e.g. fuel ethanol.
**Energy transformation is mainly electricity and heat generation from primary solid biofuels and wastes. Source: IEA (2019), World Energy Balances 2019 First edition (database), www.iea.org/statistics/.
57
ENERGY SYSTEM TRANSFORMATION
IEA. All rights reserved.
4. RENEWABLE ENERGY
Electricity from renewable energy
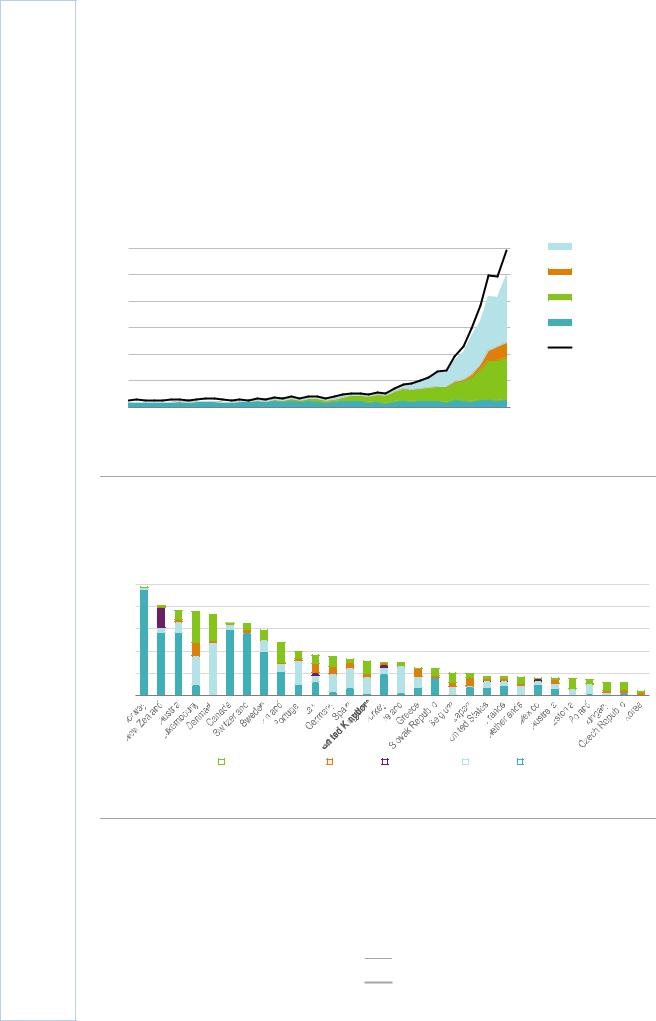
The share of renewable electricity has increased significantly. In 2018, the total installed capacity of variable renewable energy was 32.7 gigawatts (GW), of which 61% was wind and 39% solar photovoltaics (PV). In 2017, renewable energy generated 99 terrawatt hours (TWh), which accounted for 30% of the total electricity generation, up from 5% in 2007 (Figure 4.5). This places the United Kingdom at the median share of renewables in electricity generation among IEA countries (Figure 4.6).
Figure 4.5 Renewable energy and waste in electricity generation, 1990-2017
120 |
TWh |
|
|
|
|
|
|
|
|
|
|
30% |
Wind |
|
|
|
|
|
|
|
|
|
|
|
|||
100 |
|
|
|
|
|
|
|
|
|
|
|
25% |
Solar |
80 |
|
|
|
|
|
|
|
|
|
|
|
20% |
Bioenergy* |
|
|
|
|
|
|
|
|
|
|
|
|
||
60 |
|
|
|
|
|
|
|
|
|
|
|
15% |
Hydro |
|
|
|
|
|
|
|
|
|
|
|
|
||
40 |
|
|
|
|
|
|
|
|
|
|
|
10% |
Renewables share |
|
|
|
|
|
|
|
|
|
|
|
(right axis) |
||
|
|
|
|
|
|
|
|
|
|
|
|
|
|
20 |
|
|
|
|
|
|
|
|
|
|
|
5% |
|
0 |
|
|
|
|
|
|
|
|
|
|
|
0% |
|
1973 |
1977 |
1981 |
1985 |
1989 |
1993 |
1997 |
2001 |
2005 |
2009 |
2013 |
2017 |
|
|
Renewable energies have shown considerable growth, particularly wind and bioenergy and waste, and accounted for 31% of the total electricity generation in 2017.
* Includes primary solid biofuels, liquid biofuels, biogases and renewable municipal waste. Source: IEA (2019), World Energy Balances 2019 First edition (database), www.iea.org/statistics/.
Figure 4.6 Renewable energy as a percentage of electricity generation in IEA member countries, 2017
100% |
80% |
60% |
40% |
20% |
0% |
|
Biofuels and waste |
|
Solar |
|
Geothermal |
|
Wind |
|
Hydro |
|
|
|
|
|
|||||
|
|
|
|
|
The United Kingdom’s share of renewable energy in electricity generation is around the median in the IEA.
Note: Includes non-renewable waste.
Source: IEA (2019), World Energy Balances 2019 First edition (database), www.iea.org/statistics/.
Wind is the largest source of renewable electricity with 14.9% of the total electricity generation in 2017 and wind generation is expected to increase strongly until 2020 at an average annual growth rate of around 13%. The total wind power generation has increased from 5.3 TWh in 2007 to 50.0 TWh in 2017.
58
IEA. All rights reserved.