


3. ENERGY AND CLIMATE CHANGE
Emissions
GHG emissions
In 2016, the total emissions of GHGs without land use, land use change, and forestry (LULUCF) in the United Kingdom amounted to 486.3 million tonnes of carbon dioxideequivalent (MtCO2e). Since 1990, the United Kingdom’s GHG emissions have declined by 39.2%. The largest contributors to the total GHG emissions in 2016 were energyrelated emissions, which accounted for 81% of the total, followed by emissions from the agriculture sector (9%), industrial processes (6%), and the waste sector (4%) (Figure 3.1). The energy sector is responsible for the emissions from energy use in the power and heat generation, transport, industry, household, and commercial sectors. Besides the main GHG, CO2, emissions consist of methane and nitrous oxide, which account for 11% and 5%, respectively.
Figure 3.1 GHG emissions by sector, 1990 and 2016
1990 |
|
2016 |
|
|
|
|
9% |
|
9% |
4% |
|
|
|
6% |
|
|
|
|
Energy* |
|
|
6% |
|
|
|
||
8% |
|
|
|
|
||
|
|
|
|
Industrial processes |
||
|
|
|
|
|
||
799.9 Mt |
|
|
|
|
|
|
77% |
486.3 Mt |
81% |
|
Agriculture |
||
|
|
|
|
|||

 Waste
Waste
The United Kingdom’s total GHG emissions have reduced by 40% since 1990 (without LULUCF), and energy-related emissions dominate the total emissions.
* Energy includes power and heat generation, commercial, households, industrial energy consumption and transport.
Source: UK Government (2018a), Greenhouse Gas Emissions Inventory, 1990 to 2016, https://uk- air.defra.gov.uk/assets/documents/reports/cat07/1804191054_ukghgi-90-16_Main_Issue1.1_UNFCCC.pdf.
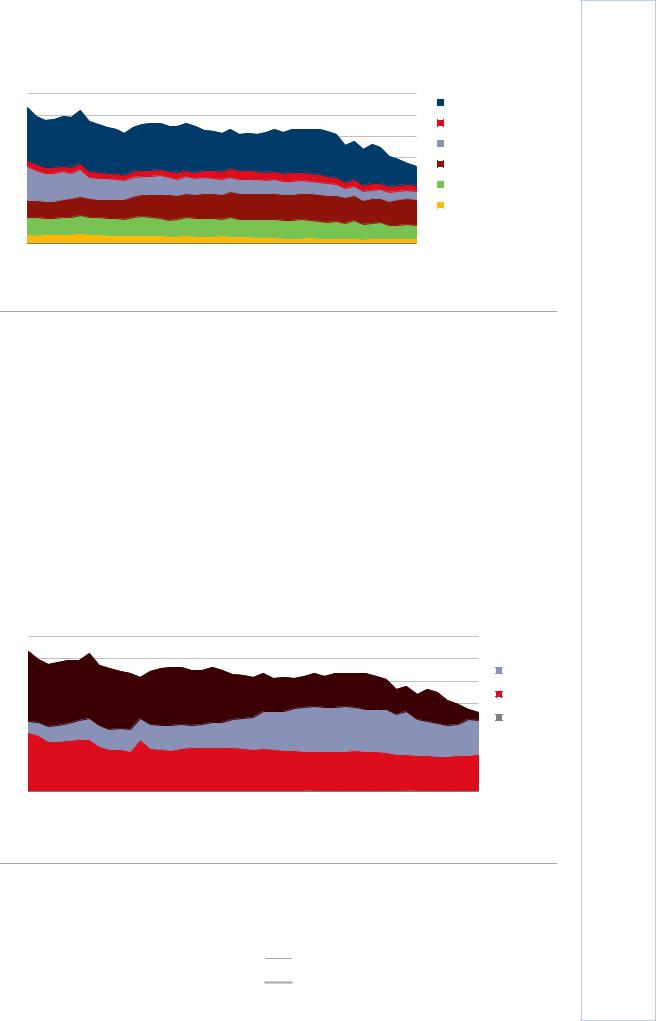
Energy-related CO2 emissions
The United Kingdom’s energy-related CO2 emissions were 359 million tonnes of carbon dioxide (MtCO2) in 2017, a 35% reduction since 1990. As illustrated in Figure 3.2, transport (34% of the total) and power and heat generation (25%) were the main emitters, with the remainder from residential (18%), industries (10%), commercial (6%), and other energy industries (7%), such as oil refineries, coke ovens, and blast furnaces.
Emissions declined in most sectors over recent decades, but most prominently in power and heat production. In power generation, emissions declined as a result of the steady increase of natural gas and renewable energy use, which replaced carbon-intensive coal. Over the past decade, the share of renewables increased to almost 30% in power generation. Furthermore, total electricity generation has declined by 15% since 2007. Thanks to this significant emissions reduction, the power and heat generation sector is no longer the highest emitting sector, but comes second to the transport sector.
34
IEA. All rights reserved.
|
|
|
|
|
|
|
|
|
|
|
3. ENERGY AND CLIMATE CHANGE |
|
Figure 3.2 Energy-related CO2 emissions by sector, 1973-2017 |
||||||||||||
700 |
MtCO |
|
|
|
|
|
|
|
|
|
Power and heat generation |
|
600 |
|
|
|
|
|
|
|
|
|
|
|
Other energy industries* |
500 |
|
|
|
|
|
|
|
|
|
|
|
|
|
|
|
|
|
|
|
|
|
|
|
Industry** |
|
400 |
|
|
|
|
|
|
|
|
|
|
|
|
|
|
|
|
|
|
|
|
|
|
|
Transport |
|
|
|
|
|
|
|
|
|
|
|
|
|
|
300 |
|
|
|
|
|
|
|
|
|
|
|
Residential |
|
|
|
|
|
|
|
|
|
|
|
|
|
200 |
|
|
|
|
|
|
|
|
|
|
|
Commercial*** |
|
|
|
|
|
|
|
|
|
|
|
|
|
100 |
|
|
|
|
|
|
|
|
|
|
|
|
0 |
|
|
|
|
|
|
|
|
|
|
|
|
1973 |
1977 |
1981 |
1985 |
1989 |
1993 |
1997 |
2001 |
2005 |
2009 |
2013 |
2017 |
|
CO2 emissions in power and heat generation have more than halved in a decade, whereas transport emissions have been stable and now account for the largest share.
*Other energy includes emissions from oil refineries, blast furnaces, and coke ovens.
**Industry includes CO emissions from combustion at construction and manufacturing industries.
***Commercial includes commercial and public services, agriculture, forestry, and fishing. Source: IEA (2019a), CO Emissions from Fuel Combustion 2019, www.iea.org/statistics/.
In 2017, oil and natural gas were the two largest sources of energy-related CO2 emissions, at 45% and 44%, respectively. Coal emissions reduced significantly, and in 2017 accounted for a record low of 10% of total CO2 emissions (Figure 3.3). Natural gas and coal-related CO2 emissions stem from electricity generation. Emissions from oil originate mainly in the transport sector. As the share of fossil fuels in the total primary energy supply (TPES) has decreased over the past decade, the emissions from all fossil fuels have also been reduced. From 2007 to 2017, emission from coal declined by 76%, those from natural gas by 17%, and those from oil by 10%.
Figure 3.3 Energy-related CO2 emissions by fuel, 1973-2017
700 MtCO

 Coal
Coal
600
Natural gas
500
Oil
400
300 |
|
|
|
|
|
|
|
|
|
|
Other* |
|
|
|
|
|
|
|
|
|
|
|
|
200 |
|
|
|
|
|
|
|
|
|
|
|
100 |
|
|
|
|
|
|
|
|
|
|
|
0 |
|
|
|
|
|
|
|
|
|
|
|
1973 |
1977 |
1981 |
1985 |
1989 |
1993 |
1997 |
2001 |
2005 |
2009 |
2013 |
2017 |
Total CO2 emissions have dropped by 31% in ten years due to the sharp decline of coalrelated emissions that resulted from the switch from coal power to renewables.
* Other includes emissions from peat and non-renewable waste combustion.
Source: IEA (2019a), CO Emissions from Fuel Combustion 2019, www.iea.org/statistics/.
35
ENERGY SYSTEM TRANSFORMATION
IEA. All rights reserved.

3. ENERGY AND CLIMATE CHANGE
CO2 drivers and carbon intensity
The United Kingdom has decoupled its economic growth from CO2 emissions. From 1990 to 2017, the country’s gross domestic product (GDP) per capita grew by 49%, while energy-related CO2 emissions fell by 35% (Figure 3.4).
Figure 3.4 Energy-related CO2 emissions and main drivers, 1990-2017
Index 1990 |
|
|
|
|
|
|
|
|
|
1.6 |
|
|
|
|
|
|
|
|
GDP/capita |
1.4 |
|
|
|
|
|
|
|
|
Population |
|
|
|
|
|
|
|
|
|
CO /TPES |
1.2 |
|
|
|
|
|
|
|
|
2/ |
|
|
|
|
|
|
|
|
CO2 emissions |
|
1.0 |
|
|
|
|
|
|
|
|
|
|
|
|
|
|
|
|
|
TPES/GDP |
|
|
|
|
|
|
|
|
|
|
|
0.8 |
|
|
|
|
|
|
|
|
|
0.6 |
|
|
|
|
|
|
|
|
|
0.4 |
|
|
|
|
|
|
|
|
|
1990 |
1993 |
1996 |
1999 |
2002 |
2005 |
2008 |
2011 |
2014 |
2017 |
The United Kingdom’s CO2 emissions and TPES have fallen despite strong economic growth.
Notes: Real GDP in USD 2010 prices and purchase power parity (PPP).
Source: IEA (2019a), CO Emissions from Fuel Combustion 2019, www.iea.org/statistics/.
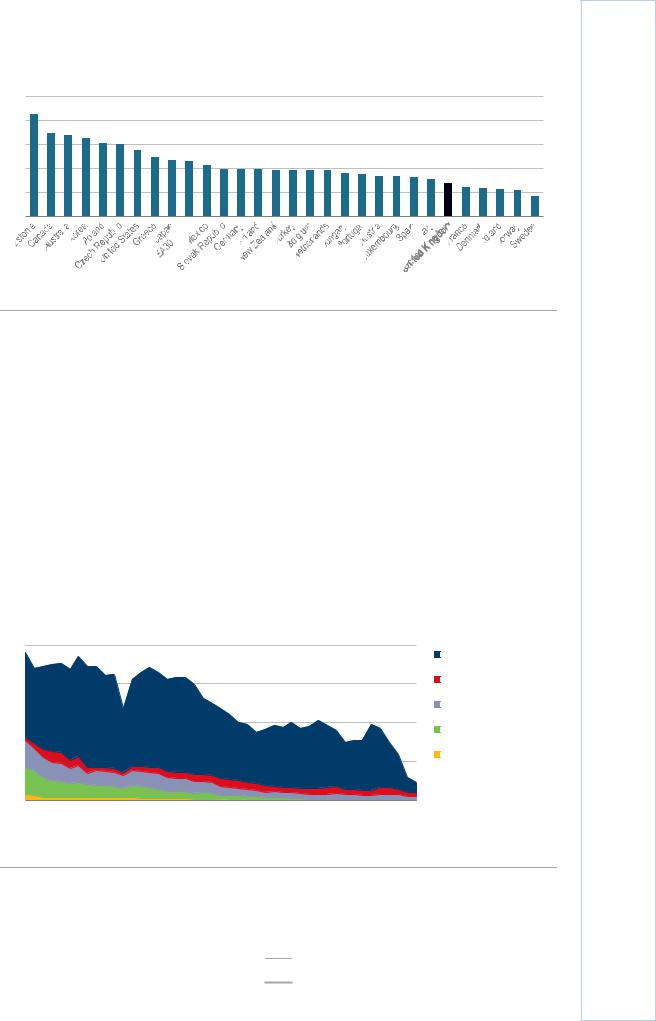
Emissions reductions were driven by the reduced carbon intensity of the energy supply (CO2/TPES) as well as by a significant decline in the energy intensity of the economy (TPES/GDP). Carbon intensity, measured as the ratio of emissions per unit of GDP, was 0.14 kilogrammes of carbon dioxide (kgCO2) per United States Dollar (USD)1 in 2017, a decline by 38% from 2007, which places the United Kingdom sixth-lowest among the International Energy Agency (IEA) countries, almost twice as low as the IEA average (Figure 3.5).
The CO2 intensity in power and heat generation has rapidly decreased in recent years, compared to that of neighbouring countries, to 248 grammes of carbon dioxide per kilowatt-hour (gCO2/kWh), a 51% decline since 2007. Although this trend is consistent with that of other IEA member countries, the decline was more rapid in the United Kingdom after 2012.
1 USD in 2010 real values and PPP.
36
IEA. All rights reserved.
3. ENERGY AND CLIMATE CHANGE
Figure 3.5 CO2 intensity in IEA member countries, 2017
kgCO /USD GDP PPP
0.5
0.4
0.3
0.2
0.1
0
United Kingdom has the seventh-lowest CO intensity among IEA countries.
Source: IEA (2019a), CO Emissions from Fuel Combustion 2019, www.iea.org/statistics/.
2
Emission reductions were achieved mainly thanks to the decreasing use of coal in power generation (Figure 3.6). In 2017, coal made up 5.5% of the TPES and 7% of electricity generation. Coal use in heat and power generation fell by 83.9% between 2007 and 2011 and by 35% in industry (despite a rebound in 2012 because of higher gas prices), thanks to the strong increase of renewables and the strengthened UK carbon price floor (CPF). Several coal-fired power plants closed (Rugeley, Ferrybridge, and Longannet in 2016), several were supposed to close in 2018 (Kilroot will run as a back-up plant until 2019 and Eggborough closed in September 2018), and others are currently being converted to biomass and waste (Uskmouth and Lynemouth). This also includes the conversion of the third unit at Drax power station from coal to high-range co-firing (85% to <100% biomass) in 2015. Coal use in the residential sector fell from 43% in 1973 to just over 1% in 2017, but still 0.5 Mt were consumed in that sector, including in UK homes.
Figure 3.6 Coal consumption by sector, 1973-2017
80 |
Mtoe |
|
|
|
|
|
|
|
|
|
|
|
|
|
|
|
|
|
|
|
|
|
|
Heat and power generation |
|
|
|
|
|
|
|
|
|
|
|
|
|
|
60 |
|
|
|
|
|
|
|
|
|
|
|
Other energy* |
|
|
|
|
|
|
|
|
|
|
|
|
|
|
|
|
|
|
|
|
|
|
|
|
|
Industry** |
40 |
|
|
|
|
|
|
|
|
|
|
|
Residential |
|
|
|
|
|
|
|
|
|
|
|
|
|
20 |
|
|
|
|
|
|
|
|
|
|
|
Commercial*** |
|
|
|
|
|
|
|
|
|
|
|
|
|
0 |
|
|
|
|
|
|
|
|
|
|
|
|
1973 |
1977 |
1981 |
1985 |
1989 |
1993 |
1997 |
2001 |
2005 |
2009 |
2013 |
2017 |
|
Coal is mostly used in power generation, but the share of coal has declined rapidly since 2012 as a result of the strong UK CPF.
*Other energy includes consumption in coke ovens, blast furnaces, and energy industry losses.
**Industry includes non-energy consumption.
***Commercial includes commercial and public services, agriculture, and forestry.
Source: IEA (2019b), World Energy Balances 2019 First edition (database), www.iea.org/statistics/.
37
ENERGY SYSTEM TRANSFORMATION
IEA. All rights reserved.