

The Future of Rail
Opportunities for energy and the environment
IEA 2019. All rights reserved.
Introduction
This chapter provides an overview of the world’s rail transport services, looking at transport networks, activity, energy demand and greenhouse gas (GHG) emissions. It also explores how rail transport systems have developed, offering insights into the main differences across regions
Page | 26 and attempting to identify the key socio-economic forces behind rail development. As well, the chapter provides details of the determinants of the global energy and carbon intensity of passenger and rail transport services.
IEA 2019. All rights reserved.
Rail transport networks
This section considers the evolution of rail networks and the state of past and present infrastructure. Rail infrastructure refers, in particular, to rail tracks and lines (with any one rail line consisting of one or more tracks); the importance of electrical equipment and signalling systems is highlighted in later sections. The overall length of a country’s railway tracks gives some indication of the priority given to investment in rail transportation and the capacity of the network. Three main types of rail infrastructure are discussed: conventional (shared by passenger and freight trains), high-speed and urban (consisting of metro and light rail systems).
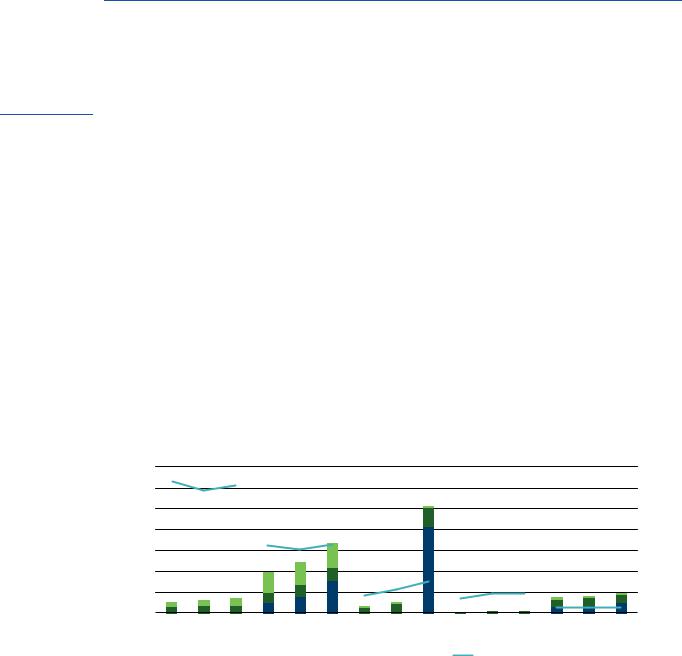
Conventional rail tracks make up 94% of all rail track-kilometres, but their length has grown very little in recent years (Figure 1.1). Urban and high-speed rail networks, on the other hand, have grown significantly, their length having doubled and tripled in several countries in recent years.
Figure 1.1 |
Track length by region and network type, 1995-2016 |
|
|
|
|
|
|
|
|
|
|||||||||||||||||
|
|
|
|
|
|
|
|
|
|
|
|
|
|
|
|
|
|
|
|
|
|
|
|
|
|
|
|
trackslightandmetrospeed,-High km)(thousand |
70 |
|
|
|
|
|
|
|
|
|
|
|
|
|
|
|
|
|
|
|
|
|
|
700 |
(thousandtrackrailConventionalkm) |
||
60 |
|
|
|
|
|
|
|
|
|
|
|
|
|
|
|
|
|
|
|
|
|
|
600 |
||||
|
|
|
|
|
|
|
|
|
|
|
|
|
|
|
|
|
|
|
|
|
|
|
|
||||
|
50 |
|
|
|
|
|
|
|
|
|
|
|
|
|
|
|
|
|
|
|
|
|
|
500 |
|
||
|
40 |
|
|
|
|
|
|
|
|
|
|
|
|
|
|
|
|
|
|
|
|
|
|
400 |
|
||
|
30 |
|
|
|
|
|
|
|
|
|
|
|
|
|
|
|
|
|
|
|
|
|
|
300 |
|
||
|
20 |
|
|
|
|
|
|
|
|
|
|
|
|
|
|
|
|
|
|
|
|
|
|
200 |
|
||
|
10 |
|
|
|
|
|
|
|
|
|
|
|
|
|
|
|
|
|
|
|
|
|
|
100 |
|
||
|
0 |
|
1995 |
2005 |
2016 |
|
1995 |
2005 |
2016 |
|
1995 |
2005 |
2016 |
|
1995 |
2005 |
2016 |
|
1995 |
2005 |
2016 |
|
0 |
|
|||
|
|
|
|
|
|
|
|
||||||||||||||||||||
|
|
|
|
|
|
|
|
|
|
||||||||||||||||||
|
|
|
North America |
|
|
Europe |
|
|
|
|
China |
|
|
|
India |
|
|
|
Japan |
|
|
|
|
||||
|
|
|
|
|
|
Light rail |
|
Metro rail |
|
|
|
High-speed rail |
|
|
Conventional rail (right axis) |
|
|
|
|
||||||||
|
|
|
|
|
|
|
|
|
|
|
|
|
|
|
|
||||||||||||
|
|
|
|
|
|
|
|
|
|
|
|
|
|
|
|
||||||||||||
Note: Conventional rail includes infrastructure used both by conventional passenger and freight rail.
Sources: IEA assessments based on UIC (2018a); UITP (2018a); UITP (2017); ITDP (2018); AAR (2017); Eurostat (2018); Indian Railways (2018a); Japan Ministry of Land, Infrastructure and Tourism (2018); National Bureau of Statistics of China (2018) and Russian Federation State Statistics Service (2018).
Key message • Conventional rail networks have changed little over the past two decades, while metro and high-speed rail have grown strongly.
Even though new metro lines are regularly being opened in the European Union and North America, along with high-speed rail lines in the European Union, Asia is the epicentre of most recent and ongoing developments. The most impressive rail infrastructure expansion in recent years is China’s rapid development of high-speed rail corridors. Non-existent before 2008, the length of China’s high-speed rail network has overtaken that of all other countries in the world combined. Today, nearly two-thirds of the world’s high-speed rail lines are in China.
IEA 2019. All rights reserved.
IEA 2019. All rights reserved. |
The Future of Rail |
|
|
|
|||
|
|
|
Opportunities for energy and the environment |
|
|
|
|
|
|
|
|
|
|
|
|
Box 1.1 |
Technical characteristics of the network and inter-operability of rail services |
|
|
|
|||
|
|
|
|
|
|
||
|
The independent development of railway systems in different countries led to the adoption of a |
|
|
|
|||
|
variety of track gauges (i.e. the spacing between rails), power systems (using alternative or direct |
|
|
|
|||
|
current and voltage) and signalling conventions. These choices have constrained the integration of |
|
|
|
|||
|
railway systems. |
|
|
|
|
|
|
|
|
|
|
|
|
|
|
|
For passenger rail, network integration barriers have been limited. In the case of urban passenger |
|
|
Page | 27 |
|||
|
|
|
|
||||
|
rail services, this is because breaks occur in most cases at railway stations, where passengers |
|
|
|
|||
|
would be likely to transfer in any case. In the case of long-distance rail transport, the constraints |
|
|
|
|||
|
have been fewer because of the timing of high-speed rail development, which occurred once the |
|
|
|
|||
|
importance of network integration and inter-operability had been widely accepted.1 Allowing the |
|
|
|
|||
|
rolling stock to be powered via various electrical systems, new technology permits differences in |
|
|
|
|||
|
drive systems to be overcome. Although there will always be additional administrative cost for trains |
|
|
|
|||
|
operating across borders, if the tracks have the same gauge, the trains can be adapted to different |
|
|
|
|||
|
overhead line characteristics. |
|
|
|
|
|
|
|
Freight rail typically travels long distances and therefore is subject to more significant network |
|
|
|
|||
|
integration barriers than passenger rail. This is especially relevant in Europe and the Eurasian |
|
|
|
|||
|
corridors, where, at switch of gauge locations, cars must exchange their bogies2 for the different |
|
|
|
|||
|
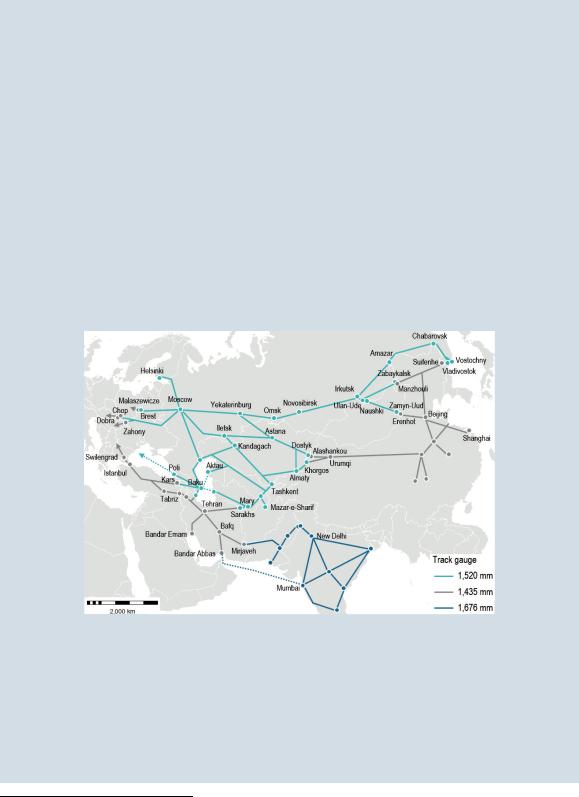
sized tracks (Figure 1.2). If this is not possible, goods are transferred from one train to another. The |
|
|
|
|||
|
use of freight containers facilitates this, but transfers still increase time and cost. |
|
|
|
|||
|
Figure 1.2 |
Eurasian freight rail corridors |
|
|
|
|
|
|
|
|
|
|
|
|
|
Note: This map is without prejudice to the status of or sovereignty over any territory, to the delimitation of international frontiers and boundaries, and to the name of any territory, city or area.
Source: Eurasian Rail Corridors (UIC, 2017a).
European Union
In 2010, European Regulation EU913/2010 created 11 freight rail corridors open to different rail operators (European Union, 2010). The goals of the corridors include the standardisation of operational practices, signalling systems, electrification, increases in the maximum possible length of a train to 740 metres, 100 kilometres per hour operating speed, 22.5 tonnes axle load, loading gauges (allowed height and width of the train) and track gauges by 2030 for the core network and by
1All major high-speed services outside Russia operate on standard gauge, regardless of the gauge used in the conventional network. For future high-speed connections between Russia and China, the railway operator China Rail, is developing an adjustable gauge high-speed train (RT, 2016).
2A bogie is the underframe, or chassis, of a rail vehicle; the axles and attached wheels are contained within the bogie.
The Future of Rail
Opportunities for energy and the environment
IEA 2019. All rights reserved.
|
|
|
2050 for the overall network. However, improvements on this scale are typically slow and require the |
|
|
|
|
|
co-operation of national governments, which is not always a given (European Court of Auditors, |
|
|
|
|
|
2016). |
|
|
|
|
|
Central and Eastern Asia |
|
|
|
|
|
Freight rail traffic between Europe and Asia is growing rapidly, but its modal share remains limited |
|
|
|
|
|
compared with shipping, mostly hampered by issues related to border crossings and inter- |
|
|
Page | 28 |
|||||
|
|
operability. Breaks of gauge occur between China, former Soviet Union countries and Europe, as |
|
||
|
|
|
|
||
|
|
|
well as between Pakistan and Islamic Republic of Iran (“Iran”) on the southern route (Figure 1.2). |
|
|
|
|
|
Other inter-operability issues also exist due to the separate development of the rail networks in each |
|
|
|
|
|
country (UIC, 2017a). |
|
|
|
|
|
North America |
|
|
|
|
|
Inter-operability in North America was achieved rapidly due to the relative simplicity of the rail |
|
|
|
|
|
market. Freight operators own their networks and operate in only three national contexts (Canada, |
|
|
|
|
|
Mexico and United States), facilitating more co-ordination. This is in stark contrast with Europe and |
|
|
|
|
|
Eurasia, where there are many different countries, operators and infrastructure managers to co- |
|
|
|
|
|
ordinate in one corridor. Larger diversity in the services, such as established domestic passenger |
|
|
|
|
|
and freight services for which international standardisation is an additional cost with no direct |
|
|
|
|
|
benefit, is also a hindrance. To increase inter-operability, co-operation and organisation is required |
|
|
|
|
|
between all relevant parties in a network. |
|
|
|
|
|
|
|
Urban rail network
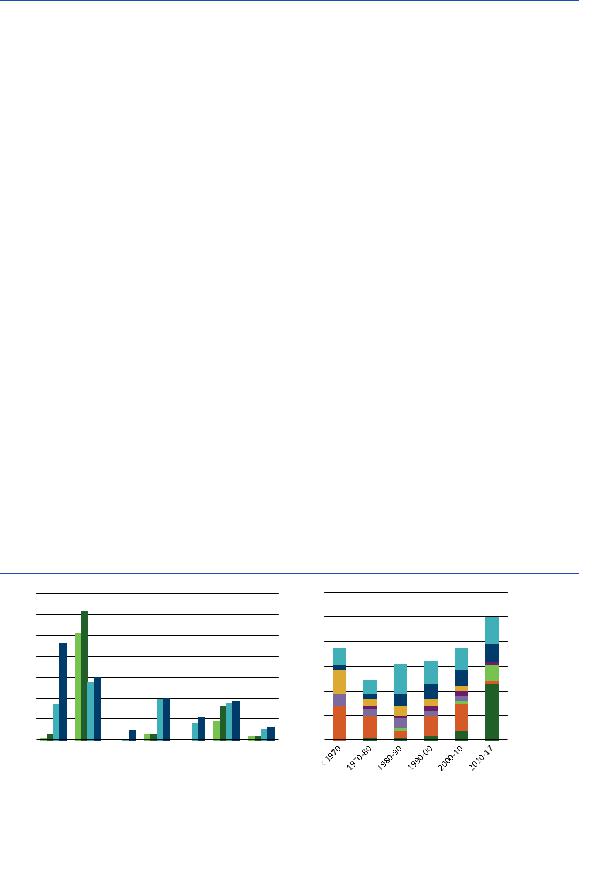
Worldwide in 2017, 194 cities had metro systems and operated over 32 000 kilometres of track (UITP, 2018c; ITDP, 2018). Plus, 221 cities had light rail systems, with 21 000 kilometres of track. Since 2010, new metro systems have opened in 43 cities, 32 of which are in Asia (Figure 1.3). Length of the overall network of metros has increased by 4 800 kilometres since 2000, when the total length was 11 300 kilometres. In the next five years, new lines and extensions are expected to open in many countries, including the first lines to be built in sub-Saharan Africa (in Abidjan, Abuja and Lagos) (UITP, 2018a).
IEA 2019. All rights reserved.
Figure 1.3 Extension of urban rail networks (metro and light rail), 2000-2017 (left) and opening of new metro systems, 1970-2017 (right)
|
14 |
|
|
|
|
|
|
|
|
60 |
|
|
Rest of world |
|
|
|
|
|
|
|
|
|
|
|
|
||||
|
|
|
|
|
|
|
|
|
|
|
||||
km-track |
12 |
|
|
|
|
|
|
|
systemsmetro |
50 |
|
|
Russia |
|
|
|
|
|
|
|
|
|
|
||||||
|
|
|
|
|
|
|
|
|
||||||
|
|
|
|
|
|
|
|
|
|
|||||
|
|
|
|
|
|
|
|
|
|
|
|
|
|
|
|
10 |
|
|
|
|
|
|
|
|
40 |
|
|
North |
|
|
|
|
|
|
|
|
|
|
|
|
||||
|
|
|
|
|
|
|
|
|
|
|
||||
|
|
|
|
|
|
|
|
|
|
|
America |
|||
|
|
|
|
|
|
|
|
|
|
|
|
|
||
|
8 |
|
|
|
|
|
|
|
|
30 |
|
|
Korea |
|
|
|
|
|
|
|
|
|
|
|
|
||||
|
|
|
|
|
|
|
|
|
|
|
|
|||
Thousand |
6 |
|
|
|
|
|
|
|
newofNumber |
|
|
Japan |
||
|
|
|
|
|
|
|
|
|
|
|||||
|
|
|
|
|
|
|
|
|
|
|
||||
|
|
|
|
|
|
|
|
|
|
|
|
|
||
|
4 |
|
|
|
|
|
|
|
|
20 |
|
|
India |
|
|
|
|
|
|
|
|
|
|
|
|
||||
|
|
|
|
|
|
|
|
|
|
|
||||
|
|
|
|
|
|
|
|
|
|
|
|
|
||
|
2 |
|
|
|
|
|
|
|
|
10 |
|
|
Europe |
|
|
|
|
|
|
|
|
|
|
|
|
||||
|
|
|
|
|
|
|
|
|
|
|
|
|||
|
|
|
|
|
|
|
|
|
|
|
|
|
||
|
0 |
China Europe India Japan |
Korea |
0 |
|
|
China |
|||||||
|
|
|
||||||||||||
|
|
|
||||||||||||
|
|
|
|
|||||||||||
|
|
|
|
|
|
|
||||||||
|
|
|
Light rail 2000 |
|
Light rail 2017 |
|
|
Metro 2000 |
|
|
|
|
|
|
|
|
|
|
|
|
|
|
|
|
|||||
Note: The light rail line figures for 2017 are estimates based on UITP |
|
(2018) |
|
|
||||||||||
Sources: IEA analysis based on UITP (2015a), UITP (2018d) and ITDP |
|
|
|
|
||||||||||
Key message • China’s metro network became the |
|
|
in just one |
|||||||||||
decade, overtaking that of the European Union in 2015. |
|
|
|
|||||||||||
The intensity of the use of metro systems is an |
|
their |
|
relevance |
||||||||||
and potential for further growth. A first metric for comparison is the average number of metro trips per urban resident in a year. Figure 1.4 (left) shows how this indicator has evolved over the
IEA 2019. All rights reserved.
IEA 2019. All rights reserved. |
The Future of Rail |
|
Opportunities for energy and the environment |
|
|
past five years in selected regions. There are clear regional differences, reflecting several factors |
|
|
such as the proportion of the city area that is served by a metro system and accessibility to the |
|
|
stations. India and North America have the lowest number of trips per urban resident, indicating |
|
|
that a smaller portion of the urban population uses the metro system compared with countries |
|
|
and regions with more developed urban rail networks, such as Russia, Korea, European Union |
|
|
and Japan. |
|
|
Page | 29 |
||
|
||
A second indicator for the intensity of metro use is the number of passenger-kilometres per |
|
|
kilometre of network length (Figure 1.4, right), which illustrates how busy the existing network |
|
|
lines are. Metro systems have by far the highest utilisation rate of all rail systems (whether |
|
|
measured in train-kilometre or passenger-kilometre) per kilometre of track length. The figure |
|
|
shows that metro systems are much more intensively used in Russia and Japan, where metro |
|
|
occupancy and frequency are extremely high, whereas intensity is lower in the rest of the world, |
|
|
in particular in North America. Figure 1.4 also compares metro with high-speed rail utilisation. |
|
|
On average, a metro system sees 13 million passenger-kilometres per year per kilometre track, |
|
|
compared to 9 million per high-speed rail track. Conventional rail tracks carry much less, though |
|
|
they also transport goods. Advancing traffic management systems may extend the potential |
|
|
utilisation rate of urban rail networks (see Box 1.4). |
|
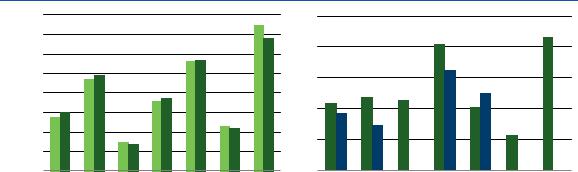
Figure 1.4 Average annual metro trips per urban resident, 2013-2017 (left); and metro network utilisation versus high-speed rail, 2017 (right)
|
160 |
|
25 |
|
140 |
track |
|
|
|
20 |
|
|
120 |
km |
|
|
|
||
Trips / resident |
|
|
|
100 |
passenger-km / |
15 |
|
|
|||
80 |
|
||
60 |
10 |
||
|
|||
|
|
||
|
40 |
Million |
5 |
|
|
||
|
20 |
|
|
|
|
|
|
|
0 |
|
0 |
China Europe India |
Japan Korea North Russia |
China Europe India |
Japan |
Korea |
North Russia |
||||||||
|
|
|
|
|
America |
|
|
|
|
|
|
|
America |
|
|
2013 |
|
|
2017 |
|
|
Metro rail |
|
|
|
High-speed rail |
|
|
|
|
|
|
|
|
|
|
|||||
|
|
|
|
|
|
|
|
|
|||||
Notes: For the figure on the left, results are based on a weighted average of the number of annual trips per city resident (weighted relative to the number of residents per city) taking into account only cities that have a metro system.
Sources: For the figure on the left, data are from the UITP (2018d). The figure on the right represents IEA estimates based on UIC (2018a); UITP (2018a); National Bureau of Statistics of China) (2018); Eurostat (2018); Indian Railways (2018a); Japan Ministry of Land, Infrastructure and Tourism (2018); AAR (2017); and Russian Federation State Statistics Service (2018).
Key message • Russia, Korea and the European Union have the highest levels of metro ridership. Metro network utilisation per kilometre of track is higher in Russia and Asian countries than in Europe and North America. Metro utilisation of rail networks is much higher than high-speed rail.
Conventional rail network for passenger and freight services
The length of tracks used for conventional passenger and freight rail services has hardly grown over the past twenty years, i.e. very little new conventional rail infrastructure was built (Figure 1.5). The longest conventional rail network today is in North America, followed by the European Union, Russia, India and China.
The Future of Rail
Opportunities for energy and the environment
IEA 2019. All rights reserved.
Passenger utilisation of the conventional rail network is more intensive in Japan than in any other country. This is due to the fact that a large number of networks in Japan are suburban, or commuter, rail systems, which have activity patterns closer to those of metros than of intercity trains.3
|
Figure 1.5 |
Conventional rail infrastructure track development, 1995-2016 |
|
||||
Page | 30 |
|
||||||
|
|
|
|
|
|
|
|
|
|
1 800 |
|
|
|
|
|
|
km) |
1 600 |
|
|
|
|
|
|
1 400 |
|
|
|
|
|
|
|
(thousand |
|
|
|
|
|
|
|
1 200 |
|
|
|
|
|
|
|
|
|
|
|
|
|
|
|
length |
1 000 |
|
|
|
|
|
|
800 |
|
|
|
|
|
|
|
|
|
|
|
|
|
|
|
Track |
600 |
|
|
|
|
|
|
400 |
|
|
|
|
|
|
|
|
|
|
|
|
|
|
|
|
200 |
|
|
|
|
|
|
|
0 |
|
|
|
|
|
|
|
|
1995 |
2000 |
2005 |
2010 |
2016 |
 Rest of world
 Japan
Japan
 India
India
 Russia
 China
China
 Europe
 North America
Note: The figure includes all conventional rail tracks, used both for passenger and freight transport.
Sources: IEA assessments based on UIC (2018a); National Bureau of Statistics of China) (2018); Eurostat (2018); Indian Railways (2018a); Japan Ministry of Land, Infrastructure and Tourism (2018); AAR (2017); and Russian Federation State Statistics Service (2018).
Key message • Global conventional rail tracks did not expand significantly over the past twenty years. Figure 1.6 Non-urban rail activity per kilometre of track, passenger and freight, 2000 and 2016
Million passenger-km and tonne-km / km rail track
25
20
15
10
5
0
2000 |
2016 |
2000 |
2016 |
2000 |
2016 |
2000 |
2016 |
2000 |
2016 |
2000 |
2016 |
2000 |
2016 |
2000 |
2016 |
China |
Europe |
India |
Japan |
Korea |
North America |
South America |
World average |
||||||||
|
|
|
|
|
Passenger-km |
Tonne-km |
|
|
|
|
|
|
|||
Sources: IEA assessments based on UIC (2018a); National Bureau of Statistics of China) (2018); Eurostat (2018); Indian Railways (2018a); Japan Ministry of Land, Infrastructure and Tourism (2018); AAR (2017); and Russian Federation State Statistics Service (2018).
Key message • Almost all regions have experienced more intensive rail transport activity per track kilometre, except the European Union and Korea.
IEA 2019. All rights reserved.
Since 2000, almost all countries and regions have experienced intensified use of rail networks as activity levels increased while the networks remained relatively constant in length (Figure 1.6). At the global level, passenger track utilisation (passenger-kilometres per track kilometre) increased by 75% between 2000 and 2016, and freight track utilisation (tonne-kilometres per kilometre track) by 45%. This intensification was strongest in India, with increases of 150% for
3 The UITP estimates that the network length of commuter rail services at 150 000 kilometres (UITP, 2018a).