

- •Foreword
- •Acknowledgements
- •Table of contents
- •Executive summary
- •Introduction
- •Purpose and scope
- •Structure of the report
- •Definitions
- •Classification of rail transport services
- •Key parameters
- •Data sources
- •References
- •1. Status of rail transport
- •Highlights
- •Introduction
- •Rail transport networks
- •Urban rail network
- •Conventional rail network for passenger and freight services
- •High-speed rail network
- •Rail transport activity
- •Passenger rail
- •Urban rail
- •Conventional and high-speed rail
- •Freight rail
- •What shapes rail transport?
- •Passenger rail
- •Freight rail
- •Rail transport and the energy sector
- •Energy demand from rail transport
- •Energy intensity of rail transport services
- •GHG emissions and local pollutants
- •Well-to-wheel GHG emissions in rail transport
- •Additional emissions: Looking at rail from a life-cycle perspective
- •High-speed rail
- •Urban rail
- •Freight rail
- •Conclusions
- •References
- •Introduction
- •Rail network developments
- •Rail transport activity
- •Passenger rail
- •Urban rail
- •Conventional and high-speed rail
- •Freight rail
- •Implications for energy demand
- •Implications for GHG emissions and local pollutants
- •Direct CO2 emissions
- •Well-to-wheel GHG emissions
- •Emissions of local pollutants
- •References
- •3. High Rail Scenario: Unlocking the Benefits of Rail
- •Highlights
- •Introduction
- •Motivations for increasing the role of rail transport
- •Urban rail
- •Conventional and high-speed rail
- •Freight rail
- •Trends in the High Rail Scenario
- •Main assumptions
- •Rail network developments in the High Rail Scenario
- •Rail transport activity
- •Passenger rail in the High Rail Scenario
- •Urban rail
- •Conventional and high-speed rail
- •Freight rail in the High Rail Scenario
- •Implications for energy demand
- •Implications for GHG emissions and local pollutants
- •Direct CO2 emissions in the High Rail Scenario
- •Well-to-wheel GHG emissions
- •Investment requirements in the High Rail Scenario
- •Fuel expenditure
- •Policy opportunities to promote rail
- •Passenger rail
- •Urban rail
- •Conventional and high-speed rail
- •Freight rail
- •Conclusions
- •4. Focus on India
- •Highlights
- •Introduction
- •Status of rail transport
- •Passenger rail
- •Urban rail
- •Conventional passenger rail
- •High-speed rail
- •Freight rail
- •Dedicated freight corridors
- •Rail transport energy demand and emissions
- •Energy demand from rail transport
- •GHG emissions and local pollutants
- •Outlook for rail to 2050
- •Outlook for rail in the Base Scenario
- •Context
- •Trends in the Base Scenario
- •Passenger rail
- •Freight rail
- •Implications for energy demand
- •Implications for GHG and local pollutant emissions
- •Outlook for rail in the High Rail Scenario
- •Key assumptions
- •Trends in the High Rail Scenario
- •Passenger and freight rail activity
- •Implications for energy demand
- •Implications for GHG and local pollutant emissions
- •Conclusions
- •References
- •Acronyms, abbreviations and units of measure
- •Acronyms and abbreviations
- •Units of measure
- •Glossary
The Future of Rail
Opportunities for energy and the environment
IEA 2019. All rights reserved.
Implications for energy demand
In the Base Scenario, energy demand from rail in India in 2050 is about 110% higher than in 2017. A significant increase is no surprise, given the large growth in rail activity during this period (Figure 4.9). However, the growth in energy demand from rail lags appreciably behind the rate of rail activity growth: the combination of the improved energy efficiency of the trains,
Page | 150 network improvements and strong electrification leads to a decrease in the energy intensity of passenger rail. Efforts to increase the electrification of railway lines bear fruit in the Base Scenario, meaning that nearly all rail is electrified by 2050 (Figure 4.10). The share of electricity in the rail fuel mix rises to 95% in 2030 and 98% in 2050 (Box 4.3).25 By 2050, the railways use almost 100 TWh of electricity, up from 22 TWh today. Oil remains part of the rail fuel mix, but consumption declines from 0.04 million barrels per day (mb/d) in 2017 to 0.003 mb/d in 2050. Actual oil use by rail pales in comparison with the oil product demand that is avoided by the omission of road transport, by 2050 rail transport avoids 1.6 mb/d of oil use, compared with a hypothetical case in which all passenger and freight activity that is transported by rail in the Base Scenario is covered by road transport.26
IEA 2019. All rights reserved.
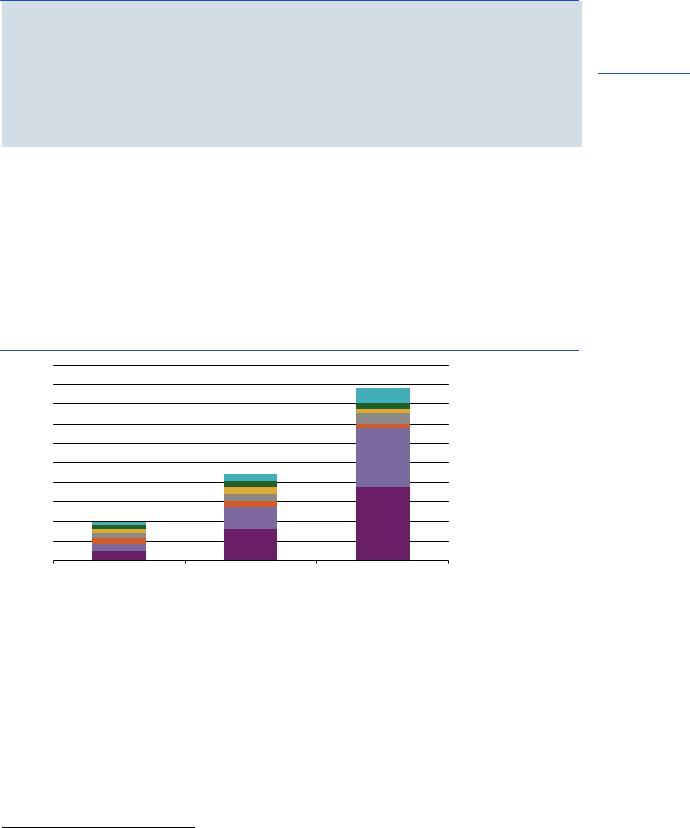
Figure 4.10 Energy demand from passenger and freight rail transport in India in the Base Scenario, 2017, 2030 and 2050
Mtoe |
10 |
|
9 |
||
|
8
7
6
5
4
3
2
1
0
2017 |
2030 |
2050 |
Note: Mtoe = million tonnes of oil equivalent.
Sources: IEA (2018a); Indian Railways (2018b).
100%
90%
80% |
|
Freight rail |
|
||
|
|
|
70% |
|
Metro |
60% |
|
|
50% |
|
High-speed rail |
|
||
|
|
|
40% |
|
Conventional rail |
30% |
|
|
|
||
|
|
|
20% |
|
Electricity share |
10% |
|
|
0% |
|
|
Key message • Total energy demand from railways grows by 110%, and by 2050 electricity accounts for 98% of that energy demand.
25This result is in line with the electrification target described in Table 4.2. The lower share of electricity in energy demand than in rail activity is explained by the higher specific energy consumption of diesel trains compared with electric trains.
26This result is obtained on the assumption that passenger rail would be replaced by aviation, cars, buses and two/threewheelers, that freight rail would be replaced by heavy freight trucks and that all the energy demand is oil. The weighted average fuel economy of passenger transport in India in 2050 is about 11 tonnes of oil equivalent (toe) per million
passenger-kilometres and that for freight trucks is 21 toe/million tonne-kilometre (IEA, 2018a).
IEA 2019. All rights reserved.
IEA 2019. All rights reserved. |
The Future of Rail |
|
Opportunities for energy and the environment |
|
|
Box 4.3 Plans for the continued electrification of the conventional rail network in India
In the wake of investments in network electrification over the past decades, India is aiming at fulfilling the “Mission Electrification” programme. To meet its ambitious electrification targets, Indian Railways set a plan to accelerate the pace of electrification from 2 000 kilometres per year in 2016 to 4 000 kilometres per year in 2017 and increasing to 6 200 kilometres per year in 2019 (Indian Railways, 2016).27 So far Indian Railways has met these targets, with a commensurate increase in
the budget outlay towards traction electrification (Ramji, Nagbhushan and Bharadwaj, 2017). The Page | 151 goal of achieving nearly 100% electrification will require resolute budgetary support over the next
decade.
Implications for GHG and local pollutant emissions
The rapid growth in transport activity and energy use means that well-to-wheel GHG emissions attributable to the entire transport sector in India grow rapidly in the Base Scenario (Figure 4.11). Emissions increase to 1 750 Mt CO2-eqby 2050, approximately a 350% increase over 2017. The largest contributions to GHG emissions growth (both in relative and absolute terms) comes from cars and aviation for passenger transport and from heavy-duty trucks for freight transport.
Figure 4.11 Well-to-wheel GHG emissions from India’s transport sector in the Base Scenario, 2017, 2030 and 2050
equivalent |
2 000 |
|
|
|
|
1 800 |
|
|
|
|
|
|
|
|
|
|
|
|
1 600 |
|
|
|
Aviation |
|
|
|
|
||
|
|
|
|
||
|
|
|
|
|
|
2 |
1 400 |
|
|
|
Rail |
|
|
|
|||
CO |
|
|
|
|
|
Mt |
1 200 |
|
|
|
Two/three-wheelers |
|
|
|
|||
|
|
|
|||
|
1 000 |
|
|
|
Medium trucks |
|
|
|
|
||
|
|
|
|
||
|
800 |
|
|
|
Buses and minibuses |
|
|
|
|
||
|
|
|
|
||
|
600 |
|
|
|
Light-duty vehicles |
|
|
|
|
||
|
400 |
|
|
|
|
|
|
|
|
Heavy trucks |
|
|
200 |
|
|
|
|
|
|
|
|
|
|
|
0 |
|
|
|
|
|
2017 |
2030 |
2050 |
|
|
Notes: Emissions related to shipping activities are not included. Emissions from rail include emissions from conventional rail (both passenger and freight), metro and high-speed rail.
Sources: IEA (2018).
Key message • Transport-related GHG emissions increase by 350% in period to 2050.
Well-to-wheel GHG emissions from rail, in the Base Scenario steadily increase to reach 57 Mt CO -eq in 2050 (Figure 4.12). The well-to-wheel GHG emissions from rail are primarily indirect arising from the power sector – as electrification of the railways increases, so does the weight of power sector emissions in overall rail emissions. Nonetheless, the contribution of railways to transport-related GHG emissions remains low, even on a well-to-wheel basis; by 2050 rail transport contributes to only 2% of overall transport-related GHG emissions, a much smaller than its contribution to overall transport activity. The emissions intensity of rail transport remains lower than for all other motorised modes, saving about 270 Mt of CO2-eq
27 The 90% electrification target aims at cutting Indian Railway’s fuel bill by 40%, from USD 3.6 to 2.2 billion (INR 265 billion to INR 160 billion) per year (Indian Railways, 2016).