

The Future of Rail
Opportunities for energy and the environment
IEA 2019. All rights reserved.
Fuel expenditure
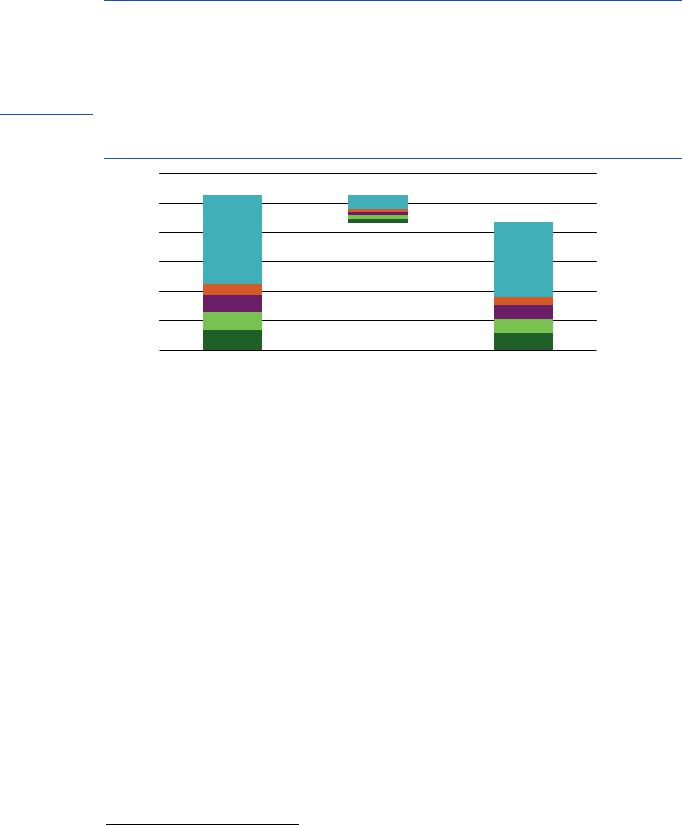
Increased reliance on rail can bring about a reduction in expenditure on road transport fuels, mostly oil. By 2050, worldwide expenditure on fuel is around USD 450 billion lower in the High Rail Scenario than in the Base Scenario. India stands to save USD 65 billion (22% of fuel
Page | 116 expenditure). The global average reduction of fuel expenditure is 15% (Figure 3.21).
Figure 3.21 Fuel expenditure savings in the High Rail Scenario, 2050
IEA 2019. All rights reserved.
|
3.0 |
|
|
|
|
|
|
PPP) |
2.5 |
|
|
|
|
|
Rest of world |
|
|
|
|
|
|||
|
|
|
|
|
|
||
2015 |
2.0 |
|
|
|
|
|
Europe |
|
|
|
|
|
|||
(USD |
|
|
|
|
|
||
|
|
|
|
|
|||
1.5 |
|
|
|
|
|
ASEAN |
|
USD |
|
|
|
|
|
||
|
|
|
|
|
|||
|
|
|
|
|
|
||
1.0 |
|
|
|
|
|
India |
|
Trillion |
|
|
|
|
|
||
|
|
|
|
|
|||
|
|
|
|
|
|
||
0.5 |
|
|
|
|
|
China |
|
|
|
|
|
|
|
||
|
|
|
|
|
|
||
|
|
|
|
|
|
|
|
|
0.0 |
|
|
|
|
|
|
|
Base Scenario |
High Rail Scenario |
|||||
Source: IEA (2018).
Key message • Global fuel expenditure is reduced by 17% in 2050, with disproportionately large savings for India.
Policy opportunities to promote rail
The three pillars that underpin the High Rail Scenario – minimising service costs, maximising revenues and ensuring that the costs of all modes of transport reflect infrastructure needs and societal and environmental impacts – all improve the economic competitiveness of rail. Ensuring high passenger and freight throughput is also instrumental to achieve this condition. As outlined in Chapter 1, high throughput is also key to ensure that rail transport comes with lower energy and carbon intensity per passengerand tonne-kilometre than other transport modes.
Green bonds are a financial instrument that can facilitate the availability of funding and reduce the cost of financing capital-intensive rail projects by lowering interest rates (Box 3.4). Market liberalisation, can improve rail’s economic competitiveness by increasing network utilisation.15 Railways have been liberalised in some advanced economies with developed railway networks, with varying degrees of success in terms of improving railway utilisation. In early stages of planning and constructing a rail network though, development under a dominant operator can avoid costly duplication of infrastructure.
Policy opportunities to promote rail and make it more competitive with other transport modes are highlighted in the next sections. They focus on specific opportunities in rail services in passenger (urban, conventional and high-speed) and freight transport.
15 Market liberalisation gives new market entrants access to networks that in many cases have been previously controlled and operated by a single operator. It can promote vertical separation: the separation of the network manager from its users. In the railway sector, market liberalisation can split the ownership and/or operation of infrastructure functions (network managers) and train operators (network users).

IEA 2019. All rights reserved.
IEA 2019. All rights reserved. |
The Future of Rail |
|
|
|
Opportunities for energy and the environment |
|
|
|
Box 3.4 |
The use of environmentally friendly bonds to finance rail infrastructure |
|
|
||
The bond market is increasingly being used by policy makers and financiers as a source of low cost |
||
financing or refinancing for “green” projects.16 |
Such financing instruments earmark proceeds to |
|
finance projects and activities related to renewable energy, energy efficiency, sustainable waste |
|
management, sustainable land use (forestry and agriculture), biodiversity, clean transportation and |
|
clean water. |
Page | 117 |
|
The Climate Bonds Initiative tracks environmentally friendly bonds in three categories: (1) “fully-aligned” issuers that derive 95% or more of revenues from green business lines; (2) bonds from “strongly-aligned” issuers that derive 75-95% of revenue from green business lines; (3) labelled and certified green bonds, for which certification generally follows the guidelines outlined in the Green Bond Principles (GBP) developed by the International Capital Market Association 17
The market of fullyand strongly-aligned issuers points to significant potential for the green bond market to scale up. Labelling a bond as green provides benefits to issuers: it allows them to reach a wider investor basis and to fund environmentally beneficial projects, while signalling the company’s sustainability credentials. For investors, the green bond label facilitates the identification of green debt products and ensures a higher degree of project transparency.18
Figure 3.22 Breakdown of environmentally friendly bonds by year and type
|
1 400 |
|
|
|
|
|
|
|
|
|
70% |
|
EV |
Other |
|
|
|
|
|
|
|
|
|
|
|
|
|||||
|
|
|
|
|
|
|
|
|
|
|
|
|
|
||
|
1 200 |
|
|
|
|
|
|
|
|
|
60% |
Mass transit |
2% |
||
|
|
|
|
|
|
|
|
|
|
1% |
|||||
|
|
|
|
|
|
|
|
|
|
7% |
|
||||
|
|
|
|
|
|
|
|
|
|
|
|
|
|
|
|
billions |
1 000 |
|
|
|
|
|
|
|
|
|
50% |
|
|
|
|
|
|
|
|
|
|
|
|
|
|
|
|
||||
800 |
|
|
|
|
|
|
|
|
|
40% |
|
|
|
||
USD |
|
|
|
|
|
|
|
|
|
|
|
|
|||
600 |
|
|
|
|
|
|
|
|
|
30% |
|
|
|
||
|
|
|
|
|
|
|
|
|
|
|
|
|
|||
|
400 |
|
|
|
|
|
|
|
|
|
20% |
|
|
Railway |
|
|
|
|
|
|
|
|
|
|
|
|
|
||||
|
|
|
|
|
|
|
|
|
|
|
|
|
|
|
|
|
200 |
|
|
|
|
|
|
|
|
|
10% |
|
|
90% |
|
|
|
|
|
|
|
|
|
|
|
|
|
||||
|
0 |
|
|
|
|
|
|
|
|
0% |
|
|
|
||
|
2013 |
2014 |
2015 |
2016 |
2017 |
2018 |
|
|
|
|
|||||
|
|
Fully-aligned |
|
Strongly-aligned |
|
|
Green bond |
Transport issuance |
|
|
|||||
|
|
|
|
|
|
|
|||||||||
|
|
|
|
|
|
|
|||||||||
Note: EV = electric vehicle.
Source: IEA analysis based on Climate Bonds Initiative (2018).
Key message • Environmentally friendly bond issuance has grown substantially in recent years and the value of green bonds issued has grown particularly rapidly.
Since the first green bond was issued in 2007, the market has grown rapidly. Overall, environmentally friendly bond issuance has more than doubled within the past decade, from USD 600 million in 2007 to USD 1.4 trillion in 2018 (Figure 3.22, left). By 2018, green bonds accounted for roughly one-third of all environmentally friendly bond issuances.
16The main benefits are lower interest rates than those that could typically be obtained from a bank, the potential to raise more capital (e.g. through co-financing) and increased flexibility in the use of capital. In addition, while returns from environmentally friendly bonds have so far proven similar to standard bonds, changes in policy due to climate concerns may influence investor portfolio decisions may be adding to the attractiveness of green bonds.
17The GBP are voluntary process guidelines that recommend transparency and disclosure, and promote integrity in the development of the green bond market by clarifying the approach for issuance of a green bond (International Capital Market Association, 2018).
18Issuers of green bonds can also go a step further and seek to certify their bonds or loans under the Climate Bonds
Standard to demonstrate that the financed assets are aligned with Paris Agreement targets (Climate Bonds Initiative, 2017).