

IEA 2019. All rights reserved.
IEA 2019. All rights reserved. |
The Future of Rail |
|
Opportunities for energy and the environment |
|
|
global GHG emissions. If all passenger and freight transport demand currently satisfied by rail were served by planes and road vehicles (cars and trucks) then global GHG emissions would increase by 1.2 Gt CO2-eq (13% higher than total transport emissions) (IEA, 2018a). Looking forward, efficient electric motors and increasingly low-carbon power mixes could enable rail to contribute substantially to achieving zero-emission mobility from a WTW perspective.
Page | 57
Additional emissions: Looking at rail from a life-cycle perspective
The operation of trains is not the only source of emissions from rail transport. Emissions also arise from the construction of the railway network, the manufacture of the rolling stock, its maintenance and ultimate disposal. These emissions must also be taken into account when assessing the capacity of rail projects to reduce GHG emissions. Environmental life-cycle assessments for rail projects show that the projects best able to deliver net benefits are those having the following characteristics:
•Infrastructure characteristics that minimise the need for large amounts of steel, iron and
concrete per kilometre (required for bridges, viaducts and tunnels) (Figure 1.30). The production of steel and concrete is responsible for a large fraction of embodied emissions.39
•Trains operating high loads that minimise emissions per train-kilometre, thanks to efficient electric motors and a low-carbon power mix.
•High potential for a shift away from those transport modes with high carbon intensities in the use phase: aviation and cars for passenger rail, and trucks for freight rail.
•High passenger or freight throughput to facilitate maximising the emission savings for every passenger/tonne-kilometre switched from road and aviation to rail, so diminishing the relative importance of emissions due to the manufacture and maintenance of transport vehicles and networks.
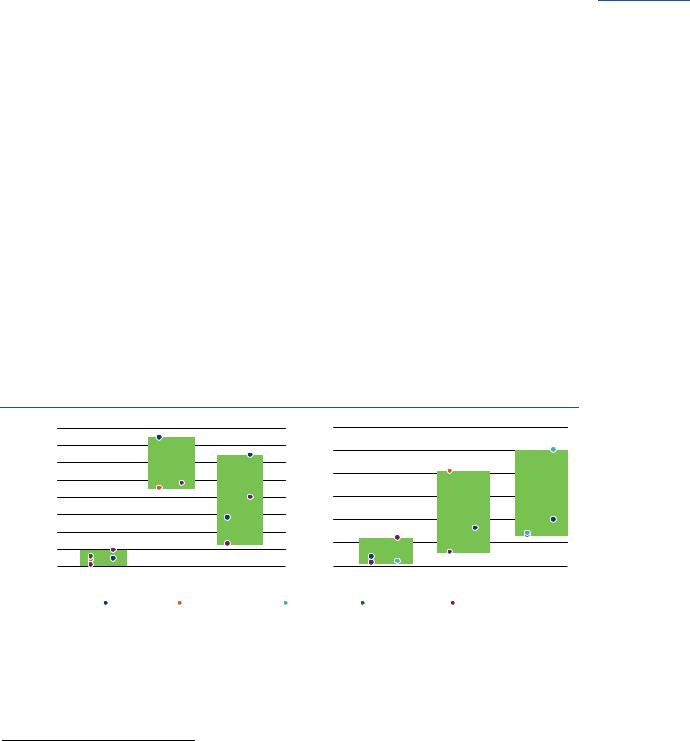
Figure 1.30 Concrete, steel and iron use for one kilometre of conventional rail line (double track)
|
40 000 |
|
|
|
|
|
|
|
|
|
|
|
6 000 |
|
|
|
|
|
|
|
|
|
|
35 000 |
|
|
|
|
|
|
|
|
|
|
km |
5 000 |
|
|
|
|
|
|
|
|
|
|
|
|
|
|
|
|
|
|
|
|
|
|
|
|
|
|
|
|
|
|||
|
|
|
|
|
|
|
|
|
|
|
per |
|
|
|
|
|
|
|
|
|
||
|
30 000 |
|
|
|
|
|
|
|
|
|
|
|
|
|
|
|
|
|
|
|
|
|
km/ |
|
|
|
|
|
|
|
|
|
|
iron |
|
|
|
|
|
|
|
|
|
|
|
25 000 |
|
|
|
|
|
|
|
|
|
|
4 000 |
|
|
|
|
|
|
|
|
|
||
concrete |
|
|
|
|
|
|
|
|
|
|
steeland |
|
|
|
|
|
|
|
|
|
||
|
|
|
|
|
|
|
|
|
|
|
|
|
|
|
|
|
|
|
|
|||
20 000 |
|
|
|
|
|
|
|
|
|
|
3 000 |
|
|
|
|
|
|
|
|
|
||
|
|
|
|
|
|
|
|
|
|
|
|
|
|
|
|
|
|
|
||||
|
|
|
|
|
|
|
|
|
|
|
|
|
|
|
|
|
|
|
|
|
||
m³ |
15 000 |
|
|
|
|
|
|
|
|
|
|
of |
2 000 |
|
|
|
|
|
|
|
|
|
|
|
|
|
|
|
|
|
|
|
|
|
|
|
|
|
|
|
|
|
|||
10 000 |
|
|
|
|
|
|
|
|
|
|
|
|
|
|
|
|
|
|
|
|
||
|
|
|
|
|
|
|
|
|
|
|
Tonnes |
|
|
|
|
|
|
|
|
|
|
|
|
5 000 |
|
|
|
|
|
|
|
|
|
|
1 000 |
|
|
|
|
|
|
|
|
|
|
|
|
|
|
|
|
|
|
|
|
|
|
|
|
|
|
|
|
|
|
|
||
|
|
|
|
|
|
|
|
|
|
|
|
|
|
|
|
|
|
|
|
|
||
|
|
|
|
|
|
|
|
|
|
|
|
0 |
|
|
|
|
|
|
|
|
|
|
|
0 |
|
|
|
|
|
|
|
|
|
|
|
|
|
|
|
|
|
|
|
|
|
|
|
|
|
|
|
|
|
Elevated |
|
Surface |
Tunnel |
Elevated |
||||||||||
|
|
|
|
|
|
|
|
|
||||||||||||||
|
Surface |
|
Tunnel |
|
|
|
||||||||||||||||
|
|
|
|
UIC 2016 |
Asplan-Viak 2001 |
TERI 2012 |
Chester 2010 |
Chester 2018 |
|
|
|
|||||||||||
Note: Boxes represent the range of material use in various projects and points represent values in the academic research mentioned in the cited sources. Elevated structures include bridges and viaducts. It should be noted that the use of tunnels and viaducts may have other important benefits, for example increased safety and less land use, and necessity for additional infrastructure for line crossings.
Sources: Chester and Horvath (2010); UIC (2016) and TERI (2012).
Key message • Railway lines, in particular those with numerous tunnels, viaducts and bridges are concrete and steel intensive.
39 This is true for studies in various regions, for example (Chester and Horvath, 2010). According to TERI (2012), concrete and steel production and their transport account for 70% of CO2 emissions during the railway construction phase, and steel production alone accounts for over 50% of infrastructure GHG emissions (UIC, 2016).

The Future of Rail
Opportunities for energy and the environment
IEA 2019. All rights reserved.
|
High-speed rail |
|
|
A case of two large cities considering a high-speed rail connection in order to mitigate GHG |
|
|
emissions from passenger cars, buses and planes is portrayed in Table 1.2 and Figure 1.31. They |
|
|
assume a 500 kilometre distance between the two cities and 20 million single trips made |
|
|
annually by all means of transport (comparable to the passenger activity between Paris and |
|
Page | 58 |
||
London [Behrens and Pels, 2012]). |
||
|
In order illustrate the impact of different system characteristics on GHG emissions, three cases |
|
|
are considered. The first case, “high potential” for rail to reduce emissions, considers a |
|
|
high-speed rail line with few tunnels and bridges, using efficient electric trains powered by a |
|
|
low-carbon electric system and with high occupancy rates, which is able to effect sizeable modal |
|
|
shifts to rail while leading to only moderate incremental demand. The second case, “medium |
|
|
potential”, assumes characteristics that fall between the high and low cases. The “low |
|
|
potential” case assumes more pessimistic conditions for GHG emission reductions: numerous |
|
|
tunnels and bridges, a carbon-intensive power grid, limited shifts from road and aviation, |
|
|
significant induced demand and low train occupancy. |
Table 1.2 Transport emissions mitigation with high-speed rail: selected variables in three cases
|
|
Category |
|
Variable |
Unit |
|
High |
|
Medium |
|
Low |
|||||
|
|
|
|
potential |
|
potential |
|
potential |
||||||||
|
|
|
|
|
|
|
|
|
|
|
||||||
|
|
|
|
|
|
|
|
|
|
|
|
|
|
|
|
|
|
|
|
|
|
Share of tunnels |
|
Proportion of total track |
|
2% |
|
|
5% |
|
|
10% |
|
|
|
Rail infrastructure |
|
|
|
length |
|
|
|
|
|
|
||||
|
|
|
|
|
|
|
|
|
|
|
|
|
|
|
||
|
|
construction |
|
|
Share of elevated |
Proportion of total track |
5% |
|
10% |
|
40% |
|
||||
|
|
|
|
|
length |
|
|
|
||||||||
|
|
|
|
|
|
|
|
|
|
|
|
|
|
|
|
|
|
|
Train efficiency and |
|
Well-to-wheel |
g CO2-eq/passenger- |
|
3.2 |
|
|
13.5 |
|
|
23.5 |
|
||
|
|
power mix |
|
emission intensity |
kilometre |
|
|
|
|
|
|
|||||
|
|
|
|
|
|
|
|
|
|
|
|
|||||
|
|
|
|
|
|
|
|
|
|
|
|
|
|
|
|
|
|
|
|
|
|
Formerly in aviation |
Share of all trips |
20% |
|
10% |
|
5% |
|
||||
|
|
|
|
|
|
|
|
|
|
|
|
|
||||
|
|
Source of demand |
|
|
Formerly in cars |
Share of all trips |
20% |
|
10% |
|
5% |
|
||||
|
|
|
|
Formerly on buses |
Share of all trips |
5% |
|
2% |
|
1% |
|
|||||
|
|
|
|
|
|
|
|
|||||||||
|
|
|
|
|
|
|
|
|
|
|
|
|
||||
|
|
|
|
|
Newly generated |
Share of all trips |
10% |
|
15% |
|
20% |
|
||||
|
|
Train occupancy |
|
Occupancy factor |
Passengers/train |
850 |
|
750 |
|
650 |
|
|||||
|
|
|
|
|
|
|
|
|
|
|
|
|
|
|
|
|
Note: g CO2-eq = grammes of carbon-dioxide equivalent.
Sources: The choice of the share of tunnels and bridges on the rail line are based on various case studies examined in Akerman (2011); Bueno, Hoyos and Capellan-Perez (2017); Chen and Whalley (2012); Chester and Horvath (2010); TERI (2012) and UIC (2016). The values given here range between 1.6 and 4.4 thousand tonnes of CO2-eq per track-kilometre for high-speed lines at ground level, 9.3 and 17.3 for high-speed lines in tunnels, and 6.2 and 18.4 for lines on bridges or viaducts. The intensity of vehicle emissions is from IEA, 2018a. Assumptions as to the extent of modal shifts and train occupancy are made as a result of a comparison of the methodologies of Westin and Kageson, 2012; Dalkic et al., 2017; Behrens and Pels, 2012; Chester and Horvath, 2010.
Key message • The impact on CO2-eq emissions of a new high-speed rail line is dependent on numerous parameters related to topography, passenger behaviour and operational practices.
IEA 2019. All rights reserved.
Figure 1.31 compares emissions that occur over 60 years of use of the rail infrastructure against the operational emissions from buses, cars and planes that would have occurred in the absence of a high-speed rail line between the cities. It also shows the time needed for the rail connection to offset the carbon footprint of the construction of the rail infrastructure and vehicles. The results indicate that the payback time is as low as three years in the high potential case and nine years in the medium potential case. In this analysis, a high-speed rail project with the pessimistic assumptions of the low potential case lead to only very small net reductions in emissions over a 50-year timeframe.
The GHG payback time for a high-speed rail line is higher where frequencies of use are low. In the example, if the total yearly transport demand between both cities were to be changed from
IEA 2019. All rights reserved.
IEA 2019. All rights reserved. |
The Future of Rail |
|
Opportunities for energy and the environment |
|
|
20 million to 10 million, the avoided emissions imputable to the saving of fuel use by other transport modes shrinks by half, raising the comparative impact of the emissions from infrastructure construction and increasing payback times significantly.
Figure 1.31 Annualised life-cycle GHG emissions, GHG savings and time needed to compensate |
Page | 59 |
|||||||||||||||||||||||
|
|
|
|
upfront emissions for a new high-speed rail line |
|
|
|
|
|
|
|
|
|
|||||||||||
|
|
|
|
|
|
|
|
|
|
|
|
|
|
|
|
|
|
|
|
|
|
|
|
|
- |
|
700 |
|
|
|
|
|
|
|
|
|
|
|
|
|
70 |
|
|
Buses |
|
||||
|
|
|
|
|
|
|
|
|
|
|
|
|
|
|
|
|
||||||||
|
600 |
|
|
|
|
|
|
|
|
|
|
|
|
|
60 |
|
|
|
||||||
|
|
|
|
|
|
|
|
|
|
|
|
|
|
|
|
|
|
|
||||||
CO |
|
|
|
|
|
|
|
|
|
|
|
|
|
|
|
|
|
|
|
|
|
Cars |
|
|
|
|
|
|
|
|
|
|
|
|
|
|
|
|
|
|
|
|
|
|
|
|
|||
(kt |
|
|
|
|
|
|
|
|
|
|
|
|
|
|
|
|
|
|
|
|
|
|
|
|
|
500 |
|
|
|
|
|
|
|
|
|
|
|
|
|
50 |
|
|
|
|
|
||||
emissionsGHG |
equivalent) |
|
|
|
|
|
|
|
|
|
|
|
|
|
Years |
|
|
|
|
|||||
400 |
|
|
|
|
|
|
|
|
|
|
|
|
|
40 |
|
Planes |
|
|||||||
|
|
|
|
|
|
|
|
|
|
|
|
|
|
|
|
|
|
|||||||
|
|
|
|
|
|
|
|
|
|
|
|
|
|
|
|
|
|
|||||||
|
|
|
|
|
|
|
|
|
|
|
|
|
|
|
|
|
|
|
|
|||||
Annualised |
|
300 |
|
|
|
|
|
|
|
|
|
|
|
|
|
30 |
|
|
Operation |
|
||||
|
|
|
|
|
|
|
|
|
|
|
|
|
|
|
|
|
||||||||
|
|
|
|
|
|
|
|
|
|
|
|
|
|
|
|
|
||||||||
|
|
|
|
|
|
|
|
|
|
|
|
|
|
|
|
|
|
|
||||||
|
200 |
|
|
|
|
|
|
|
|
|
|
|
|
|
20 |
|
|
Infrastructure |
|
|||||
|
|
|
|
|
|
|
|
|
|
|
|
|
|
|
|
|
Rolling stock |
|
||||||
|
|
100 |
|
|
|
|
|
|
|
|
|
|
|
|
|
10 |
|
|
|
|
|
|||
|
|
0 |
|
|
|
|
|
|
|
|
|
|
|
|
|
|
|
|
0 |
|
|
|
|
|
|
|
|
Rail emissions |
Avoided |
|
Rail emissions |
Avoided |
|
Rail emissions |
Avoided |
|
|
|
Time to compensate |
|
|||||||||
|
|
|
|
|
|
|
|
|
||||||||||||||||
|
|
|
|
|
|
|
|
|
|
|
||||||||||||||
|
|
|
|
|
High potential |
|
Medium potential |
|
|
Low potential |
|
|
|
|
emissions (right axis) |
|
||||||||
|
|
|
|
|
|
|
|
|
|
|
|
|
|
|
||||||||||
Sources: IEA analysis based on sources and assumptions noted in Table 1.2.
Key message • If optimal conditions are met, a new high-speed rail line can produce almost immediate net CO2 benefits by reducing air and car journeys.
Urban rail
The GHG emissions reduction potential of metro systems can be illustrated by an example similar to that shown for high-speed rail. Table 1.3 shows the assumptions made for high, medium and low potential cases for a new metro line competing with buses and cars in a large city. The assumptions are a metro line of 20 kilometres, an 8 kilometre average trip length and a 60-year project lifetime. Passenger activity along the 8 kilometre route is assumed to be 1 million passenger trips per day, by all modes of transport. If the share of the trips made by car prior to the construction of the new metro infrastructure is 70% of all motorised trips (the rest being on buses), the three cases detailed in Table 1.3 reflect situations in which the metro manages to attract 300 000 to 600 000 of these trips. This is consistent with the proportion of passengers transported in existing metro systems (RATP, 2018; UITP, 2018b). Other key differences between the three cases include progressively more pessimistic assumptions about emissions due to the type of infrastructure, WTW fuel efficiency, shift potential from other modes and load factors.
Figure 1.32 shows that a metro line can effectively reduce GHG emissions only if it can meet certain requirements, notably in terms of the extent of GHG emissions from train operations and the capacity to shift passengers from more energy and carbon-intensive modes. The primary influence is the carbon emissions per passenger-kilometre stemming from the electricity used by metros and also on the level of emissions associated with the construction of metro (the higher material requirements needed for the construction of elevated and underground rail networks). Load factors also show a significant impact.
An important caveat is that this exercise does not account for emission savings from the avoidance of bus and car manufacturing and recycling, or the emissions stemming from the construction of infrastructure to accommodate passenger cars, such as parking spaces. The GHG
The Future of Rail
Opportunities for energy and the environment
IEA 2019. All rights reserved.
emission savings from a new metro line would be larger if the potential reduction in car ownership were fully factored into the calculations.
A second caveat is that no account is taken of the environmental and health benefits derived from improved urban air quality, given that electrified rail networks reduce the concentration of particulates and other polluting substances in high exposure areas such as urban roads.
Page | 60 Similarly, no value is placed on the potential of metro systems to alleviate road congestion, allowing more rapid transportation and thereby delivering valuable time savings. Additional benefits include reduced noise, lower accident rates and increased opportunities to reorganise the urban environment in favour of pedestrians and cyclists.
IEA 2019. All rights reserved.
Table 1.3 Transport emissions mitigation with a new metro line: selected variables in three cases
|
|
Category |
|
Variable |
|
Unit |
|
High |
|
Medium |
|
Low |
|
|||||
|
|
|
|
|
potential |
|
potential |
|
potential |
|
||||||||
|
|
|
|
|
|
|
|
|
|
|
|
|
||||||
|
|
|
|
|
|
|
|
|
|
|
|
|
|
|
|
|
|
|
|
|
Rail infrastructure |
|
Total embedded |
|
kt CO2-eq |
|
|
89 |
|
|
162 |
|
|
231 |
|
|
|
|
|
construction |
|
emissions |
|
|
|
|
|
|
|
|
|
|||||
|
|
|
|
|
|
|
|
|
|
|
|
|
|
|
|
|||
|
|
|
|
|
|
|
|
|
|
|
|
|
|
|
|
|
|
|
|
|
Train efficiency and |
|
Well-to-wheel |
|
g CO2-eq/passenger- |
6 |
|
45 |
|
110 |
|
|
|||||
|
|
power mix |
|
emission intensity |
|
kilometres |
|
|
|
|
||||||||
|
|
|
|
|
|
|
|
|
|
|
|
|
|
|||||
|
|
|
|
Formerly in cars |
|
|
Share of all trips |
|
|
40% |
|
|
25% |
|
|
10% |
|
|
|
|
|
|
|
|
|
|
|
|
|
|
|
|
|||||
|
|
Source of demand |
|
Formerly on buses |
|
Share of all trips |
15% |
|
10% |
|
5% |
|
|
|||||
|
|
|
|
|
|
|
|
|
|
|
|
|
|
|
||||
|
|
|
|
Newly generated |
|
Share of all trips |
5% |
|
10% |
|
15% |
|
|
|||||
|
|
Train occupancy |
|
Occupancy factor |
|
Passengers/train |
250 |
|
170 |
|
45 |
|
|
|||||
|
|
|
|
|
|
|
|
|
|
|
|
|
|
|
|
|
|
|
Note: kt = thousand tonnes; g CO2-eq = grammes of carbon-dioxide equivalent.
Sources: Values for embedded emissions from metro infrastructure construction and maintenance are based on ranges provided in Chester and Cano (2016); Li et al., (2018) and TERI (2012). The range indicated by these sources is roughly from 5 to 11 tonnes CO2-eq per kilometres of metro line, with the lower value for metro lines at surface level, and higher values for underground or elevated lines. Emissions intensity is estimated based on historical values from France (low intensity), Germany (medium) and China (high), and for occupancy rates in Japan (high occupancy), Germany (medium) and China (low).
Key message • The CO2-eq implications of metro construction and use vary significantly from region to region, in particular emissions intensity per passenger-kilometre can vary by an order of magnitude.
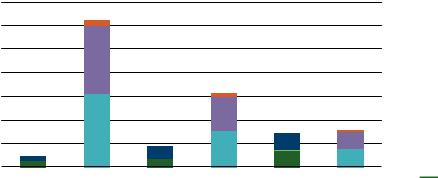
Figure 1.32 Annualised life-cycle GHG emissions, GHG savings and time needed to compensate upfront emissions for a new metro line
|
200 |
|
|
|
|
|
|
|
|
|
20 |
|
|
Buses |
|
- |
180 |
|
|
|
|
|
|
|
|
|
18 |
|
|
||
|
|
|
|
|
|
|
|
|
|
|
|
||||
CO |
160 |
|
|
|
|
|
|
|
|
|
16 |
|
|
Cars |
|
(kt |
|
|
|
|
|
|
|
|
|
|
|
||||
140 |
|
|
|
|
|
|
|
|
|
14 |
|
|
|||
|
|
|
|
|
|
|
|
|
|
|
|
||||
emissionsGHG equivalent) |
|
|
|
|
|
|
|
|
|
Years |
|
Rolling stock |
|||
80 |
|
|
|
|
|
|
|
|
|
8 |
|
||||
|
120 |
|
|
|
|
|
|
|
|
|
12 |
|
|
Operation |
|
|
100 |
|
|
|
|
|
|
|
|
|
10 |
|
|
|
|
Annualised |
60 |
|
|
|
|
|
|
|
|
|
6 |
|
|
|
|
|
|
|
|
|
|
|
|
|
|
|
|
||||
|
|
|
|
|
|
|
|
|
|
|
|
||||
|
40 |
|
|
|
|
|
|
|
|
|
4 |
|
|
Infrastructure |
|
|
|
|
|
|
|
|
|
|
|
|
|
||||
|
|
|
|
|
|
|
|
|
|
|
|
||||
|
20 |
|
|
|
|
|
|
|
|
|
2 |
|
|
|
|
|
0 |
|
|
|
|
|
|
|
|
|
|
0 |
|
|
Time to compensate |
|
|
|
|
|
|
|
|
|
|
|
|
||||
|
Rail emissions |
Avoided |
Rail emissions |
Avoided |
Rail emissions |
Avoided |
|
|
emissions (right axis) |
||||||
|
|
|
|
|
|||||||||||
|
|
|
|
|
|
||||||||||
|
|
|
High potential |
Medium potential |
Low potential |
|
|
|
|
||||||
Note: In the low potential case, the investment in CO2-eq mitigation never reaches breakeven, so no emissions compensation period is shown.
Sources: IEA analysis based on sources and assumptions noted in Table 1.2.
Key message • Metros achieve higher GHG emissions savings if they can attract commuters who would otherwise use a car. The emissions intensity of the metro operation also plays a decisive role.