


China Power System Transformation |
Annexes |
Generating hourly load profiles for each region
In order to capture regional differences, regional projections carefully consider key drivers of each end use, factoring in regional trends, policies and other conditions. For example, future geographical shifts of industry were considered explicitly, particularly the shift of centres of energy-intensive industry, by considering annual retirement of the existing manufacturing capacity and the required additional capacity in a specific year to meet product demand. The future production of each good is projected on the basis of the capacity of a region after allocating additions and depending on five relevant criteria: gross domestic product per capita, environmental restrictions, resource availability, infrastructure and policy support (Box 26).
Box 26. Disaggregation of China’s electricity demand based on future regional development and environmental strategies
The disaggregation of national-level electricity demand into the eight modelling regions was performed taking into account two main factors: regional development strategies and measures to reduce negative environmental impacts.
Regional development strategies
A national-level strategy was released in 2018 with targets for reaching a more uniform regional development level by 2035 (State Council, 2018b). This strategy highlights the latest regional strategies, including the “Beijing-Tianjin-Hebei integrated economic region”, “Along-Yangtze- River regional development”, the “West Development” strategy for the West, the “Revitalisation of the old industrial base” for the Northeast, the “Rise of the Central region”, and the “Leading development” for the East (Beijing, 2018; State Council, 2014; State Council, 2013; State Council, 2016a; State Council, 2016b).
Alongside the large regional development strategies, central government also issues nationallevel strategies for key provinces in respect of their economic structural transition, aimed at leveraging regional development by first unleashing the economic potential of the leading provinces. The “Guangdong-Hong Kong-Macau development plan” aims to transform Guangdong from “world factory” to “world-class economic platform”, by accelerating the development of innovation and technology industries (Deloitte, 2018); Shandong was chosen to be the “Momentum shifting pilot zone” for shifting its economic structure from heavy industries to one dominated by light industry and services (State Council, 2018c). These plans have been taken into account when allocating different types of electricity demand across the eight regions in 2035.
Environmental strategies
The Chinese government has emphasised the importance and urgency of curbing air pollution. The 13th Five-Year Plan (2016–20) set a must-meet air quality standard for the 338 largest cities by 2020 (State Council, 2016c). The State Council further released the Three-Year Action Plan on Blue Sky War in July 2018, setting targets for emission reductions as well as listing the critical cities, most of which were in the Beijing-Tianjin-Hebei area, Shandong, the Yangtze River Delta and the Pearl River Delta (State Council, 2018d). These government documents detailed not only the reduction of pollutants, but also optimisation of regional industrial structures,
PAGE | 184
IEA. All rights reserved

China Power System Transformation |
Annexes |
|
|
|
|
|
|
|
restricting development of industries with high energy intensity and high pollution levels, cutting overcapacity and developing environmentally friendly industries.
China specifies a number of policies and measures to achieve these objectives, notably in relation to energy efficiency improvements, the mandatory closure of small power plants and the emissions trading system (ETS). These plans have also been taken into account when allocating different types of electricity demand across the eight regions in 2035.
Sources: Beijing Government (2018), 2018-2020 [Action Plan on Integrated Development of Beijing-Tianjin-Hebei Region (2018-20)], http://finance.chinanews.com/cj/2018/07-30/8583198.shtml; Deloitte (2018), ”” [Shaping the Guangdong-Hong Kong-Macau to World-Class Bay Area], www2.deloitte.com/cn/zh/pages/about-deloitte/articles/pr-greater-bay-area-whitepaper.html; State Council (2018b),[Opinions on Revitalization of Rural Areas], http://district.ce.cn/newarea/roll/201802/05/t20180205_28052212.shtml; State Council (2018c),
[Reply on Plan for Shifting Momentum in Shandong Province], www.gov.cn/zhengce/content/201801/10/content_5255214.htm; State Council (2018d), [Three Year Action Plan on Blue Sky War], www.gov.cn/zhengce/content/2018-07/03/content_5303158.htm; State Council (2016a), 2016 2025[Plan on Middle China Rejuvenation (2016-25)], www.scio.gov.cn/34473/34515/Document/1535229/1535229.htm; State Council (2016b), [Opinions on Deepening A New Round of Northeast China Revitalization Strategy], www.gov.cn/zhengce/content/201611/16/content_5133102.htm ; State Council, (2016c), ” [13th Five-Year Plan on Ecological and Environmental Protection], www.gov.cn/zhengce/content/2016-12/05/content_5143290.htm; State Council (2014),[Opinions on Yangtze River Economical Belt Development],
www.gov.cn/zhengce/content/2014-09/25/content_9092.htm; State Council (2013),
[Report on Implementation of the Western China Development Strategy Report], www.npc.gov.cn/npc/zxbg/gwygyssxbdkfzlqkdbg/node_21794.htm.
To determine electricity demand for road transport, the number of electric vehicles (EVs) per region was used as an activity driver. The regional EV stock was estimated by assuming the share of EVs in car sales in a specific year and then taking into account the difference in the speed of EV uptake between regions.
Allocating generation capacity between regions
Projections of installed capacity in 2035 were also based on WEO 2018 projections at the national level. These were broken down for each of the eight regions for all fuels and technologies, based on several criteria. All power plants installed in 2017 and not scheduled to be retired or reach the end of their technical lifetime were assumed to be available in 2035. All plants currently under construction were included in the 2035 installed capacity projections for each region, plus a share of the planned power plants, which varies by region and by scenario.
For the deployment of coal plants, a particular role is played by co-generation plants following the changing heat demand resulting from the shift of heavy industry towards the northern regions, and in particular towards the Northwest. Co-generation plants are broadly divided into industrial steam and district heating operations, and a seasonal pattern was applied to the district heating plants. Gas-fired plants are developed in each region considering the evolution of the gas supply infrastructure. New nuclear reactors are deployed reflecting planned and proposed sites.
Page | 185
IEA. All rights reserved
China Power System Transformation |
Annexes |
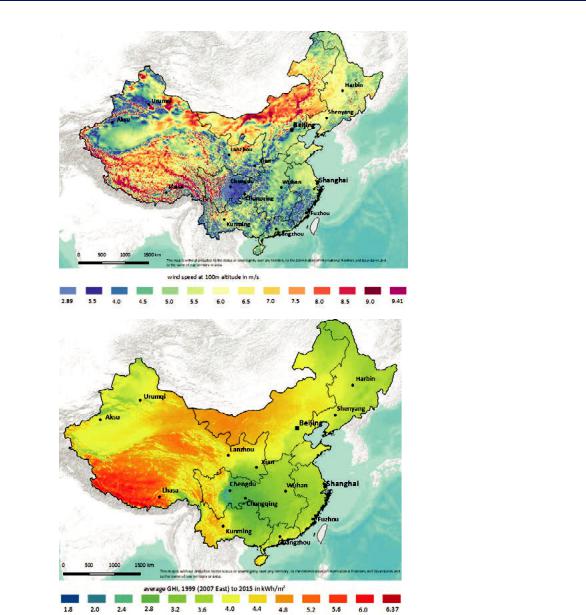
Wind (onand offshore) and solar photovoltaic (PV) (utility-scale and rooftop PV) capacity are allocated on the basis of over 4 000 representative sites considering several factors, such as potentials, population density, distance from power grids and policies in place. Hourly wind and solar generation have been simulated from the selected wind and solar sites across China. Site selection was based on three criteria:
resource potential, i.e. wind speed for wind sites and global horizontal irradiance for solar sites
distance to the transmission grid
distance to load based on population density.
Exclusion factors, such as environmentally protected areas, land use/land coverage, altitude, slope and infrastructure, were also applied to exclude unsuitable sites.
Figure 55. Wind and solar potential in China
Note: These maps are without prejudice to the status of or sovereignty over any territory, to the delimitation of international frontiers and boundaries and to the name of any territory, city or area.
PAGE | 186
IEA. All rights reserved
China Power System Transformation |
Annexes |
Hydro capacity has been broken down in each region into four main types: run-of-river, run-of- river with small storage, reservoir and pumped hydro storage. Different types of seasonal inflow have been considered for each of these types.
The expansion of the remaining renewables technologies (bioenergy, concentrating solar power, geothermal and marine) was based on resources and capacity requirements across the different regions.
Fuel prices for both NPS and SDS were derived from WEO 2018, and for steam coal prices, the price differences between eight regions were estimated considering current market trends and transport costs.
Method used for calculating CAPEX savings
In this study, a longer term system benefit of load shaping driven by a reduced need for generation infrastructure investment is estimated based on the magnitude of peak net-load reduction effect and an average investment cost for dispatchable technologies which are assumed to be necessary if the effect is not in place. The average investment cost, 131 USD/kW, is calculated by assuming capital cost of each dispatchable plant (see IEA, 2018a) annuitized with lifetime and a discount rate of 8%, and weighted with installed capacity. This is associated with an uncertainty range, calculated with different capital cost assumptions among dispatchable technologies.
References
Beijing Government (2018), 2018-2020 [Action Plan on Integrated
Development of Beijing-Tianjin-Hebei Region (2018-20)], Beijing Government, Beijing, http://finance.chinanews.com/cj/2018/07-30/8583198.shtml.
Deloitte (2018), ” ” [Shaping the Guangdong-
Hong Kong-Macau to World-Class Bay Area], Deloitte, China, https://www2.deloitte.com/cn/zh/pages/about-deloitte/articles/pr-greater-bay-area- whitepaper.html.
IEA (International Energy Agency) (2018), World Energy Outlook, OECD/IEA, Paris, www.iea.org/weo2018/.
IEA (2017), World Energy Outlook, OECD/IEA, Paris, www.iea.org/weo2017/.
State Council (2018a), [Opinion on strengthening
construction of infrastructures], State Council, Beijing, www.gov.cn/zhengce/content/201810/31/content_5336177.htm.
State Council (2018b), [Opinions on Revitalization of Rural Areas], State Council, Beijing, http://district.ce.cn/newarea/roll/201802/05/t20180205_28052212.shtml.
State Council (2018c), [Reply on Plan for
Shifting Momentum in Shandong Province], State Council, Beijing, www.gov.cn/zhengce/content/2018-01/10/content_5255214.htm.
State Council (2018d), [Three Year Action Plan on Blue Sky War], State Council, Beijing, www.gov.cn/zhengce/content/2018-07/03/content_5303158.htm.
Page | 187
IEA. All rights reserved
China Power System Transformation |
Annexes |
State Council (2018), [Opinions on Establishing
Harmonized Regional Developing Mechanism], State Council, Beijing, www.xinhuanet.com/politics/2018-11/29/c_1123786594.htm.
State Council (2016a), 2016 2025 [Plan on Middle China Rejuvenation
(2016-25)], State Council, Beijing, http://www.scio.gov.cn/34473/34515/Document/1535229/1535229.htm.
State Council (2016b),[Opinions on Deepening A New Round of Northeast China Revitalization Strategy], State Council, Beijing, www.gov.cn/zhengce/content/2016-11/16/content_5133102.htm.
State Council (2016c), “ ” [13th Five-Year Plan on Ecological and Environmental
Protection], State Council, Beijing, www.gov.cn/zhengce/content/201612/05/content_5143290.htm.
State Council (2014), [Opinions on Yangtze River
Economical Belt Development], State Council, Beijing, www.gov.cn/zhengce/content/201409/25/content_9092.htm.
State Council (2013), [Report on Implementation of the
Western China Development Strategy Report], State Council, Beijing, www.npc.gov.cn/npc/zxbg/gwygyssxbdkfzlqkdbg/node_21794.htm.
PAGE | 188
IEA. All rights reserved