


Overview and key findings
Energy investment by geography
Country and regional trends (18-22)
Energy investment by income segment and population (23-24)
17 | World Energy Investment 2019 | IEA 2019. All rights reserved.

Overview and key findings
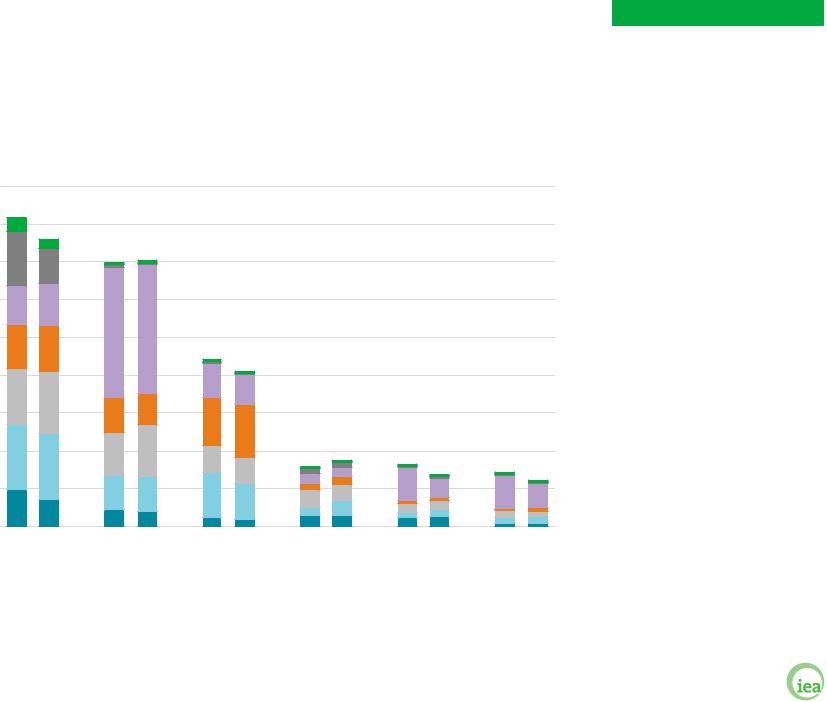
The United States accounted for most growth in energy supply investment this decade
Changes in energy supply investment, 2010-18
USD (2018) billion
|
|
|
China |
|
|
|
United States |
|
|
Rest of World |
||||||
100 |
|
|
|
|
|
|
100 |
|
|
|
|
100 |
|
|
|
|
|
|
|
|
|
|
|
|
|
|
|
|
|
||||
50 |
|
|
|
|
|
|
50 |
|
|
|
|
50 |
|
|
|
|
|
|
|
|
|
|
|
|
|
|
|
|
|
||||
|
|
|
|
|
|
|
|
|
|
|
|
|
||||
0 |
|
|
|
|
|
|
0 |
|
|
|
0 |
|
|
|
||
|
|
|
|
|
|
|
|
|
|
|
|
|||||
|
|
|
|
|
|
|
|
|
|
|
|
|||||
- 50 |
|
|
|
|
|
|
- 50 |
|
|
|
|
- 50 |
|
|
|
|
|
|
|
|
|
|
|
|
|
|
|
|
|
||||
|
|
|
|
|
|
|
|
|
|
|
|
|
||||
- 100 |
|
|
|
|
|
|
- 100 |
|
|
|
|
- 100 |
|
|
|
|
|
|
|
|
|
|
|
|
|
|
|
|
|
||||
- 150 |
|
|
|
|
|
|
- 150 |
|
|
|
|
- 150 |
|
|
|
|
|
|
|
|
|
|
|
|
|
|
|
|
|
||||
- 200 |
|
|
|
|
|
|
- 200 |
|
|
|
|
- 200 |
|
|
|
|
|
2010-18 |
|
|
|
2010-18 |
|
|
2010-18 |
|
|||||||
|
|
|
|
Power sector |
|
|
Fuel supply |
Net change in energy supply investment |
||||||||
|
|
|
|
|
||||||||||||
18 | World Energy Investment 2019 | IEA 2019. All rights reserved.

Overview and key findings
China remained the largest market for total energy investment in 2018
Energy investment by sector in selected markets in 2018
China
United States
Europe
Middle East
Russia
India
Southeast Asia
0 |
50 |
100 |
150 |
200 |
250 |
300 |
350 |
400 |
USD (2018) billion
 Fossil fuel supply
 Power sector
 Energy
efficiency
 Renewables for transport and heat
19 | World Energy Investment 2019 | IEA 2019. All rights reserved.
Overview and key findings
Investment in India has grown the most over the past three years
Energy investment by sector in selected markets, 2015 and 2018
USD (2018) billion
450
400
350
300
250
200
150
100
50
0
2015 2018 China
2015 2018 |
2015 2018 |
2015 2018 |
2015 2018 |
2015 2018 |
|
United |
Europe |
India |
Southeast |
sub-Saharan |
|
States |
Asia |
Africa |
|||
|
|
 Renewables for transport/heat
 Coal supply
 Oil and gas
 Energy Efficiency
 Electricity networks
 Renewable power
 Thermal power
20 | World Energy Investment 2019 | IEA 2019. All rights reserved.
Overview and key findings
China, the United States & India are driving some key investment trends…
More than two dollars in every ten invested in energy goes to powering Asian economies; another two dollars
divides between oil and gas and power in North America. These shares have grown in recent years.
The United States has been responsible for most of the growth in energy supply investment this decade, with increases in both oil and gas, supported by more
spending on shale, and in the power sector. While oil and gas spend has moderated somewhat in the past three years (even as it grew strongly from 2017 to 2018), that for electricity networks rose. Compared to 2015, investment in renewable power and gas power remained
relatively stable, but at high levels. Meanwhile, investment in energy efficiency has declined over the period.
China remained the largest market for energy investment in 2018, but its lead narrowed. While
spending is increasingly driven by low-carbon electricity supply and networks, total investment declined by 7% over the past three years due to lower spend on new coal-fired plants, down over 60%, outweighing relatively
high investment in renewable power and nuclear. Energy efficiency spending has risen by over 6% the past three
years.
Among major areas, energy investment has risen mostly rapidly in India the past three years, up 12%. In 2018, renewable spending continued to exceed that for fossil fuel-based power, supported by tendering for solar PV,
and from 2017 wind, amid uncertain financial attractiveness of new coal power, though spending in coal supply rose somewhat. While transmission spending is expanding, investment in distribution has not grown.
21 | World Energy Investment 2019 | IEA 2019. All rights reserved.

Overview and key findings
…but each region has its own story, often one of lower spending
Investment growth was stable or declined in other major regions during the past three years. In some areas this
reflects a response to lower oil prices (e.g. Middle East), an ongoing rebalancing between old and new parts of the system (e.g. Europe) as well as persistent financing risks that have held back more robust levels of spending to address strong demand growth (e.g. sub-Saharan
Africa, Southeast Asia).
Energy investment in the European Union has declined by 7% over the past three years, but the share of spending going towards low-carbon energy has risen to nearly 60%. Energy efficiency has been the lone growth
area for spending. Renewable power spending has slowed, in part from falling costs, but accounts for over 80% of generation spending.
Investment in the Middle East is down by one-fifth over the past three years, one of the largest declines globally,
led by a retrenchment in oil and gas spending, which outweighed higher spending on power, particularly in solar PV and gas generation. Some rebound may be on
the horizon, with some of the largest national oil companies announcing higher capital budgets for 2019
(see Fuel Supply).
Southeast Asia energy investment is down almost onefifth since 2015. Most of the fall stemmed from lower oil and gas supply spending while that for renewables and coal power registered increases. Energy efficiency
accounts for only around 5% of investment and has not grown significantly.
In sub-Saharan Africa, investment has declined 15% compared with three years ago, with less oil and gas spending offsetting a small increase in renewables.
Investment in capital intensive low-carbon technologies remains hampered by insufficient regulatory framework, challenging project development, persistent financial strain for utilities and a limited pool of public finance.
22 | World Energy Investment 2019 | IEA 2019. All rights reserved.

Overview and key findings
Energy investment was mostly in high and upper-middle income regions…
Energy investment and population by region, classified by current income level
Highincome
Uppermiddle income
Lowermiddle to lowincome
|
Share of 2018 |
Share of |
|
investment |
population |
2015 |
|
|
2018 |
42% |
16% |
44% |
41% |
14% |
42% |
0 |
250 |
500 |
750 |
1 000 |
|
|
|
USD (2018) billion |
|
Note: Income categories are defined on the basis of gross national income/capita (current USD) thresholds from World Bank (2019). High-income = > USD 12 055; Uppermiddle income = USD 3 896-12 055; Lower-middle to low-income = < USD 3 895.
Source: IEA analysis with calculations for income and population are based on World Bank (2019).
23 | World Energy Investment 2019 | IEA 2019. All rights reserved.

Overview and key findings
…but a shift towards lower income segments is needed
There is a strong link between income levels and energy investment. Nearly 90% of energy investment in 2018
was concentrated in highand upper-middle income countries and regions. These areas also tend to benefit from relatively well-developed financial systems (see Financing and funding trends).
High-income countries, with just over 15% of the global
population, accounted for over 40% of energy investment in 2018. Investment in this group is down somewhat from five years ago, largely due to lower spending in Europe and Japan, but rose in 2018 with stronger spending in fuel supply and the power sector
predominantly in the United States.
Energy investment in recent years has also declined in upper-middle income countries and regions, with an increase in Mexico outweighed by falls in China, the Middle East, Brazil, the Russian Federation, and some
Southeast Asia countries. Three years ago, this group comprised over 45% of energy investment.
Lower-middle and low-income countries accounted for less than 15% of energy investment in 2018 despite
containing well over 40% of the world’s population. In recent years, the fastest investment growth within this group has come from India with rising power sector spending, while spending in sub-Saharan Africa has declined, mostly due to less investment in fuel supply.
Looking ahead, the largest investment needs remain concentrated in currently highand upper-middle income countries and regions, in part reflecting continued investment to replace and upgrade aging assets. However, to meet sustainable development
goals, overall spending needs to grow from today’s levels and to rebalance towards the fast-growing needs of lower-middle and low-income countries.
24 | World Energy Investment 2019 | IEA 2019. All rights reserved.