

EG08_print
.pdfWater - June 2012
Water consumption in figures and ways to reduce it
Olga Chernopitskaya
EGEA Saint-Petersburg
“A sip of water opens the doors of paradise”
Norwegian proverb
Water is everywhere. It is hard to imagine our daily life without water: most human activities and manufacturing processes require water. Water is, besides oxygen, the second most important substance on Earth. Two thirds of the earth’s surface is covered by water. Without water, a human being can only survive three days. The water content of an adult human body is about 78%. Water is essential for growing plants, which produce oxygen for animals and humans, which need this oxygen.
The world stock of fresh water is around 35 million trillion liters. More than 97% of the water on the planet is salt water, around 2% is fresh water, stocked in snow and ice and less than 1 % of the water can be used for growing crops, manufacturing goods, personal hygiene and as drinking water.
Every year, the human population increases by 83 million (Population Media Centre, 2009) and with this population growth, the demand for fresh water also increases (o8ode.ru, 2009).
According to these growth rates, it is obvious that problems connected to fresh water are getting larger. Therefore, we have to realize how important it is, to save water and start doing it right now.
Did you know that?
World water supply in figures:
•24 million km3 of water (about 70% of all fresh water) is frozen in ice sheets, glaciers, permanent snow cover and permafrost (IFAD, 2011).
•The rest of the fresh water is mostly found in water bearing soil layers, which are often being depleted rapidly.
•118639 trillion liters of water is settled in lakes, rivers and swamps; this also includes water in plants, in animals and in the atmosphere (cawater-info.net, 2008).
Access to fresh water and diseases caused by the lack of it:
• Nowadays, 1.1 billion people in the world do not have access to clean potable water. 470 million people live in regions where there is an acute water shortage.
According to experts’ predictions by 2025 the number of people living in such
Figure 1: Coast of Alaska (2010)
Source: Photo by Olga Chernopitskaya
regions will increase to 3 billion people.
•In developing countries up to 90% of all waste water is not cleaned.
•2.4 billion People, i.e. two fifths of the world population live in countries and regions, which do not have enough treatment facilities and drainage systems (voda-water.com, 2010).
•The average distance that women in
Africa and Asia have to cover to collect water for their families is around 6 kilometers. The weight of the water which they carry on their head equals the maximum weight of allowable luggage on a plane (20 kg) (cawater-info.net, 2008).
•On average, people living in poor districts of the cities pay 5 to 10 times more for one liter of water than those who live in the prosperous districts of the same city.
•Poor water and bad sanitation practices cause 80% of all diseases in developing countries.
•Every year, 3.5 million people die from diseases associated with the consumption of contaminated water. 84 % of them are children aged between 0 and 14 years. At the same time 98% of deaths associated with the consumption of contaminated water occur in developing countries.
•Every 15 seconds, somewhere on the
Earth, a child dies due to the consumption of contaminated water. Every year, 1.4 million children die because of diarrhea, caused by parasites in the drinking water. In 90 % of cases, these are children under 5 years old (voda-water.com, 2010).
•In the world, more people are dying because of water shortages and inadequate sanitation than were killed in any war to date.
Consumption:
•Nowadays, the average citizen uses around 250 liters of water in Europe per day.
•The average citizen of the USA uses
1,664 cubic meters of fresh water per year (Egoshin A., 2009).
•The world average volume of water consumption per person per year is 626 cubic meters of fresh water.
•1,000 liters of water are required to grow one kilogram of wheat.
•15,000 liters of water are required to obtain one kilogram of beef.
•The average citizen of the USA and
Europe that consumes meat uses 5,000 liters of water per day. At the same time, this person uses 100 to 250 liters of water per day on drinking and personal hygiene.
•2,400 liters of water are needed to produce a single hamburger. This number is derived from the amount of liters used for growing wheat and taking care of the cattle (Egoshin A., 2009).
•Millions of beggars on the planet use about 19 liters of water per day.
•46 % of our world population does not have plumbing in their houses.
•70-80% of all consumable water in the world is used on agriculture. In the farming industry water is often used very ineffectively.
What can we do?
•Fix or change all leaking faucets.Adefective faucet can drip 30-200 liters of water per day. Try to close the faucet properly.
•Turn off the water when you brush teeth.
•Due to a leak, there is constantly flowing water from a water closet supply tank to the toilet bowl. Because of such leaks dozens of liters of water are lost every day. Try to monitor the state of plumbing in the apartment and repair it in time.
•If possible, purchase cost effective plumbing: for example, a toilet with two flush modes.
•If your water closet supply tank is not equipped with two flush modes then a simple tool can be used to avoid water loss: Fill a 2 liter bottle with water and put it inside the supply tank.
•Do not keep the faucet constantly on when you are doing the dishes. This can decrease the water consumption by 3 to 5 times.
•Use your dishwasher and washing machines only at full load.
•Do not defrost food products under hot water or steam. It is better to shift it from the freezer into the refrigerator in advance.
•Taking a shower for 7 minutes instead of taking a bath reduces water consumption
21
The European Geographer, 8th Issue
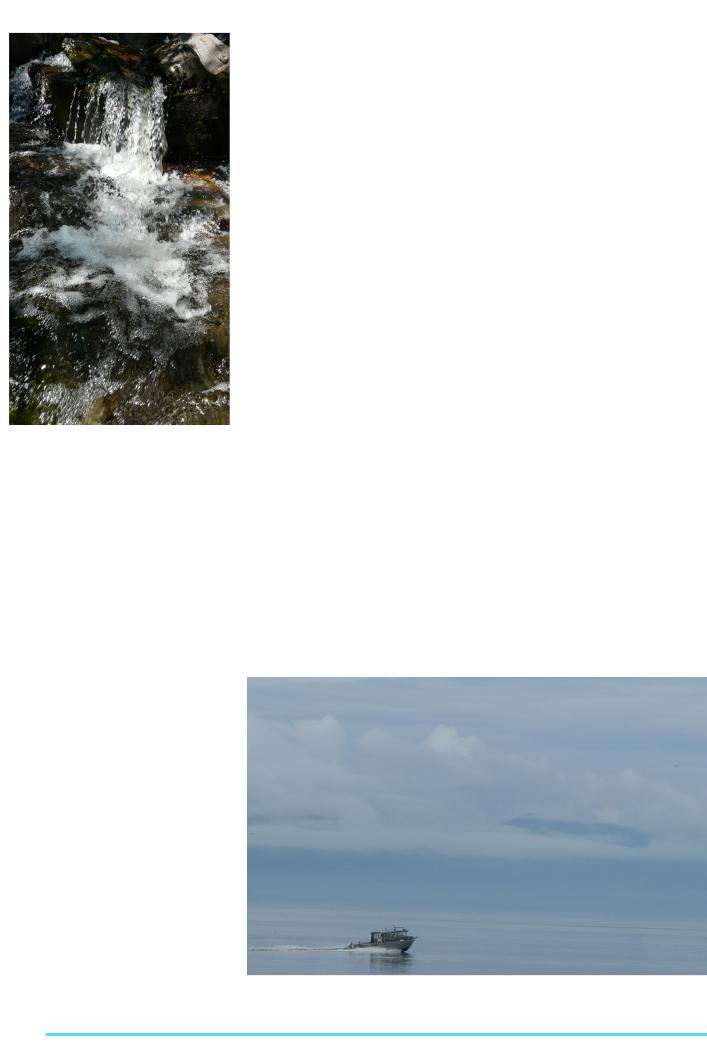
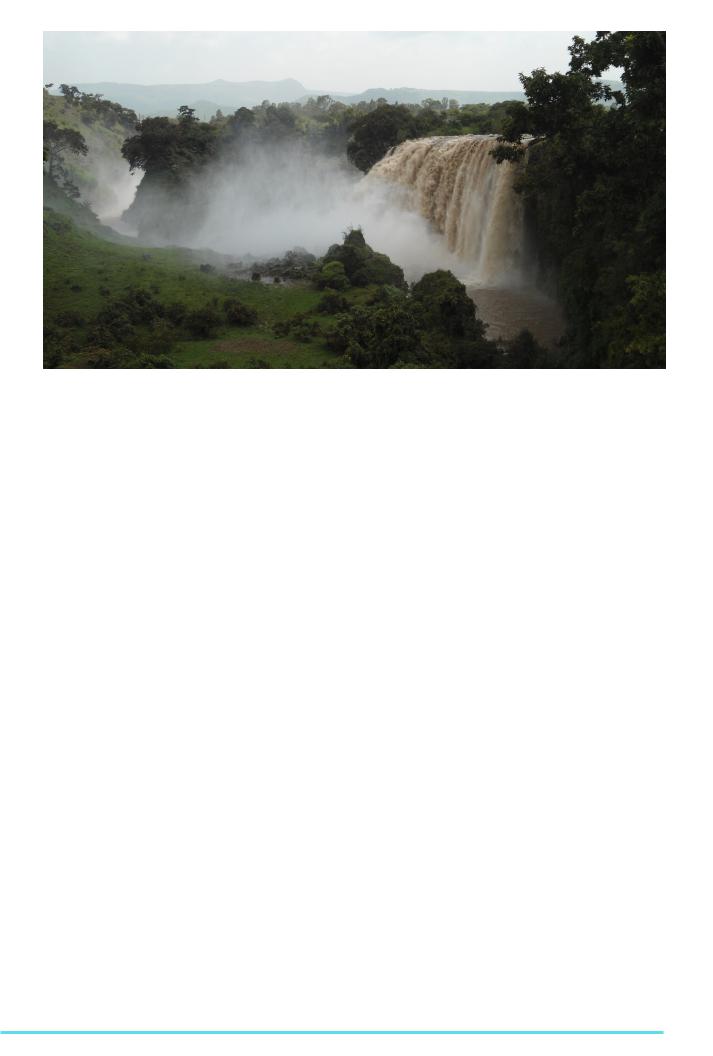
Figure 2: Waterfall on the Wrangell Island, Alaska (2010)
Source: Photo by Olga Chernopitskaya
by 5 to 7 times. Using economical scatter shower heads with a smaller diameter of holes can also help to stop wasting water.
•Every minute, 15 liters of water runs out of a fully open faucet.
•For washing the dishes under a strong stream, you use more than 100 liters of water, for washing a car with a hose - more than 300 liters.
•If a family saves only 20 % of the water from their normal usage, the amount saved could form a lake of 200 meters in diameter and 2 meters depth every year.
•To save fresh water in Hong Kong, sea water is used in water closet supply tanks.
•When the crew of the International
Space Station celebrated the implementation of the new water purification system, instead of toasting with glasses of Champagne they ‘clinked’ water bags filled with recycled urine. Upon tasting the resulting liquid, the astronauts assured everyone that the water is “just amazing”.
•A new TV advertisement in Brazil calls upon all inhabitants of the country to pee in the shower to save water.
These tips were provided by Greenpeace and a lot of them were successfully tested by me.
For your consideration
UNESCO published the ‘Atlas of Transboundary Aquifers’ in 2009. In this atlas, Russia, Brazil and some others equatorial African countries were classified as
countries with a large water stock. A lack of clean fresh water at the surface creates a complication and forces countries to use their underground water reserves more actively. In the European Union 70 % of all water, used by water consumers, is coming from underground aquifers. In arid countries water is almost entirely coming from underground recourses (Morocco – 75 %, Tunis – 95%and Saudi Arabia100 %).Aquifers can be found almost everywhere in the world, but some of them are being drastically overexploited (Egoshin A., 2008).
Some experts state that fresh water does not disappear. It moves from one region to another, without losses in the total amount of water. The same experts believe that lack of fresh water in some regions can be solved by water supplies from water-rich regions of the Earth (like Russia, Brazil and Canada). However, these countries, including their citizens, do not show so much enthusiasm towards these concepts (Egoshin A., 2008).
The lack of fresh water supply can be a good reason to start a war. If humanity now starts wars for oil, we could have wars for fresh water in the near future.
Even if fresh water would be an inexhaustible resource, we have to respect it and should not waste it mindlessly. Some people are afraid to look silly when putting a brick in the water closet supply tank or when they water the plants with rainwater. Remember, however, that using knife and fork or taking care of our personal hygiene are also concepts that were only created in the last centuries.
References
IFAD, 2011. Water facts and figures. Last viewed 27.02.2012: http://www.ifad.org/english/water/key.htm
Greenpeace, 2010.“How to preserve clean water? Tips for saving water at home”, Last viewed 19.02.2011, greenpeace.org
Semenova, E., 2009. “Water on Earth”, Last viewed 16.02.2011:o8ode.ru;
Voloshin, K., 2010.“World’s freshwater reservesFacts and Figures”, Last viewed 15.02.2011: cawater-info.net;
Boiko, S., 2010 “Lack of water”, Last viewed
17.02.2011: voda-water.com;
Egoshin, A., 2008. “Unesco published the world map of groundwater stock”. Last viewed 18.02.2011:priroda.su;
Egoshin, A.,2008. “The myth of a shortage of water on Earth”. Last viewed 26.02.2011: priroda.su;
Egoshin A., 2009. “Water consumption in figures”. Last viewed 16.02.2011: priroda.su.
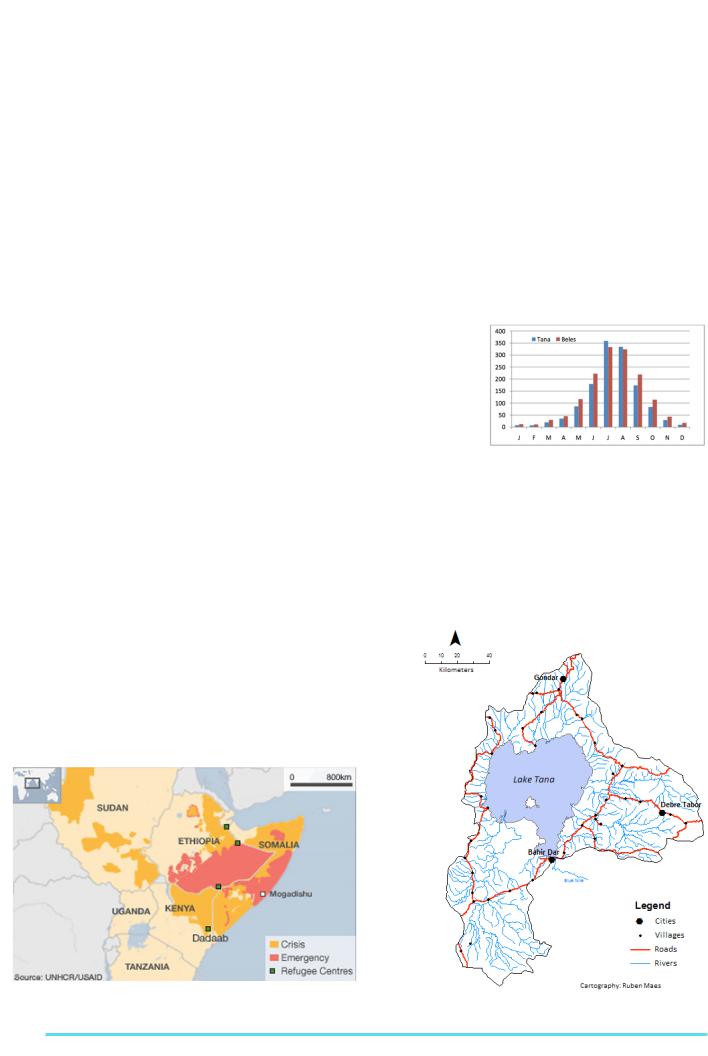
Figure 3: Pacific ocean in Alaska (2010)
Source: Photo by Olga Chernopitskaya
22

Water - June 2012
Curious facts about water
Olga Chernopitskaya
EGEA Saint-Petersburg
•A well-known Latin saying sounds like this: “In vino veritas, in aqua sanitas” which means “In wine there is truth, in water there is health”. (Pliny the Elder, AD 77-79).
•The most arid place on earth is the Atacama Desert in Chile (Extreme Science, 2011).
•The rainiest place of our planet is Mount
Waialealeon the Hawaiian island of Kauai. It is raining here 350 days a year (O’Meara, 2006).
•The longest river in the world is the
Nile River, which is 6671 km long (The XO Directory, 2011). The deepest is the AmazonRiver, which washes 5,520km3(Spitzy&Leenheer, 1991) of water to ocean every year (How Stuff Works, 2011).
•The largest reservoir with potable water on Earth is the Baikal Lake: it has a volume of 23000km3 (World lakes, 2011).
•According to UNESCO, the minimum amount of water required per person per day is 50 liters(K4health,1998).
•At the14th April 1986, hail stones that were weighting up to 1 kg and that were about 20 cm in diameter killed 92 people in Bangladesh (The Watchers, 2011).
•One 60-watt incandescent bulb may use up to 6,000 Gallons of water a year (1 Gallon is 4.54609 l (Science Daily, 2008).
•The longest valley glacier is the Nabesna glacier. It is located in the mountainous region of Alaska and has a length of 90 kilometers (NPS.gov, 2010).
•The largest geyser locale, containing thousands of hot springs and 300 to 500 geysers, is the Yellowstone National Park in the USA (Wikipedia, 2012).
•The highest waterfall on earth is the
Angel Falls in Venezuela. Its 980 meters make it 15 times higher than Niagara Falls (Extreme science, 2010).
•According to UNESCO the purest water can be found in Finland (Earth observer, 2010).
•It is quicker to get ice out of hot water than from cold water: Hot water freezes faster than cold (Think quest, 2009).
•Water has more than 3 well-known aggregate states: liquid, solid and gaseous. Scientists distinguish five different states of water in liquid form, and 14 states in frozen form (Earth observer, 2010).
•Water is like glass: At minus 120 degrees Celsius, water is extra viscous or ropy, and at a temperature below minus 135 degrees Celsius it turns into “glass” water. “Glass” water is a solid substance which has no crystal structure (Earth observer, 2010).
•Throughout its life, a human being drinks about 75 tons of water (Lenntech, 2008).
•The most expensive water in the world is sold in Los Angeles. Vendors pack the precious liquid in a bottle with Swarovski crystals. This water is sold at a price of $ 90 per 1 liter (Earth observer, 2010).
•Every year, March the 22nd this celebrated as the World Water Day. This date was approved at a UN conference in 1992 in order to attract public attention for the preservation and improvement of the quality and quantity of fresh water for present and future generations (Unwater, 1994).
•A person loses 50 kcal spending15minutes in the water at 30° Celsius. The same person loses 100 kcal spending the same time in a bath of 24 degrees (Christianfinn, 2011).
•Many people have a strong feeling of hunger after exercises in the pool. This is a result of the influence of cold water: it stimulates the internal organs, including stomach, creating this feeling of hunger. Therefore, the optimal water temperature in the pool is above 25 degrees (Christianfinn, 2011).
•One of the most watery products on
Earth is the watermelon. 93% of it consists of water (Earth observer, 2010).
References
Christianfinn, 2011. Is Swimming Good for Weight Loss? Viewed 20th of December 2011:http://www.thefactsaboutfitness.com/research/swimming.htm
Earth observer, 2010. Interesting facts concerning water. Viewed 20th of December 2011: http://www.earthobserver.org/post/2010/03/22/
Interesting-facts-concerning-water.aspx
Extreme science, 2010. Highest Waterfall in the World - Angel Falls. Viewed 20th of December
2011: http://www.extremescience.com/zoom/ index.php/earth-records/4-highest-waterfall
Extreme Science, 2011. Driest Place: Atacama
Desert, Chile, Even the Driest Place on Earth has Water.Viewed 17th of October 2011: http:// www.extremescience.com/zoom/index.php/ driest-desert
HowStuffWorks, 2011.The Amazon River.
Viewed 17th of October 2011: http://geography.howstuffworks.com/south- america/the-amazon-river.htm
K4health, 1998. How water is Used. Viewed
20th of December 2011: http://info.k4health. org/pr/m14/m14chap2_2.shtml
Lenntech, 2008.Water Facts and Trivia. Viewed
20thof December 2011: http://www.lenntech. com/water-trivia-facts.htm
NPS.gov, 2010.Glaciers. Viewed on 20th of December 2011:http://www.nps.gov/wrst/naturescience/glaciers.htm
O’Meara, 2006. The rainiest place on Earth:
Mount Waialeale, Kauai, Hawaii (Geographic overview). Viewed 17th of October 2011: http:// www.highbeam.com/doc/1G1-149069398.html
Pliny the Elder, AD 77-79. Naturalis historia 14,
141.
ScienceDaily, 2008. Water Needed To Produce Various Types Of Energy. Viewed, 20th of December 2011:http://www.sciencedaily.com/releases/2008/04/080417173953.htm
Spitzy&Leenheer, 1991. Biogeochemistry of Major World River, Chapter 9: Dissolved Organic Carbon in Rivers in: SCOPE 42. Viewed
17th of October 2011: http://www.ic.ucsc. edu/~mdmccar/ocea213/readings/01_water/ Spitzy_1991_Leenheer_SCOPE_42_Biogeochem_World_Rivers_chapter09_DOC_world_ rivers.pdf
The Watchers, 2011.“Melon-sized hailstone?!” Viewed 20th of December 2011: http://thewatchers.adorraeli.com/2011/05/29/melon- sized-hailstone/
The XO Directory, 2011. Nile, Longest River in the World. Viewed 17th of October 2011: http:// thexodirectory.com/2011/01/nile-longest-river- in-the-world/
Think quest, 2009. Hot Water Freezes Faster Than Cold. Viewed 20thof December 2011: http://library.thinkquest.org/C008537/cool/ freeze/freeze.html
Unwater, 1994. About World Water Day. Viewed 20th of December 2011:http://www.unwater.org/worldwaterday/about.html
Wikipedia, 2012.Geyser. Viewed 20th of December 2011: http://en.wikipedia.org/wiki/Geyser
Worldlakes, 2011. Lake Profile – Baikal. Viewed
20th of October 2011: http://www.worldlakes. org/lakedetails.asp?lakeid=8385
23
The European Geographer, 8th Issue
Drought, Dams, Development and Degradation: a 4D approach to sustainable water management in tropical highlands
- Case study: Lake Tana catchment (Ethiopian Highlands) -
Ruben Maes
EGEA Leuven
Introduction
According to the United Nations some parts of the Horn of Africa have recently been hit by the worst droughts in 60 years due to the prolonged failure of rainfall since the end of 2010 (BBC News, 28 June 2011). In total an estimated number of more than 10 million people, living in Kenya, Somalia and Ethiopia, are affected by drought. Low agricultural yields have raised the food prices and have subsequently already pushed many moderate poor households over the edge.
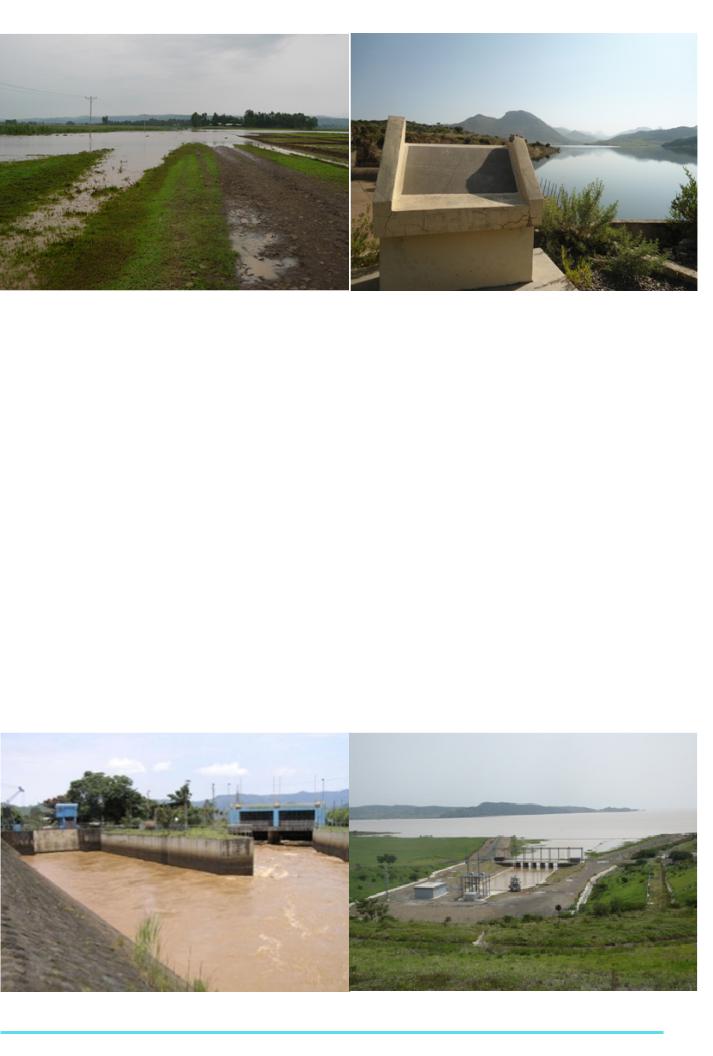
Consequently a large number of people have already fled to neighboring countries (BBC News, 28 June 2011). Meanwhile large parts of those countries are characterized by large population growth and a further development, which requires more resources and needs. According to the IPCC (2007) more severe droughts are expected around the Horn of Africa. The population at risk of increased water stress in Africa is expected to be between 75-250 million and 350-600 million people by the 2020s and 2050s, respectively. It is clear that resources like water need to be evaluated in a holistic way to avoid conflicts between different users, which may lead to further conflicts and instability in the states (SMEC, 2008). (Figure 1).
In the Ethiopian Highlands high population densities are putting an increased
pressure on the available resources leading to overgrazing, deforestation and improper management of the land. As a result, heavy land degradation is taking place returning low agricultural yields, limited access to technology and knowledge. There is an urgent need to implement sustainable land and water management in order to secure the societies’ existence. This article will reflect on the current and future use of water by different stakeholders in the catchment of Lake Tana. The catchment of Lake Tana
is |
located in |
the northwestern |
plateau |
of |
Ethiopia |
in an area where |
water |
resources are critical for sustainable local and regional development.
It constitutes the upper catchment of the Blue Nile River that has about 60% contribution to the main Nile River flow (SMEC, 2008). The total area of the catchment is about 15000 km2 and although the mean population density in the catchment has already exceeded 175 inhabitants per square kilometer, the population is still growing on an annual basis at an estimated rate of 3% (SMEC, 2008). (Figure 2)
Drought and dams
Especially in the developing world drought is an issue of great concern. Global analysisofwaterrelateddisasters between 1980 and 2006 in-
dicated that 99% of the total drought fatalities were in Africa (SMEC, 2008). In Sub-Saharan Africa, where rainfed agriculture is the predominant economic sector, drought poses a great challenge to the overall per-
formance of these economies (SMEC, 2008). Drought is a recurring phenomenon in Ethiopia, with increased frequency of occurrence in recent years (BCEOM, 1997). According to the international disaster database, drought has been on top in the list of natural disasters affecting millions of people in the country.
In the Lake Tana catchment, precipitation is characterized by a very seasonal distribution. More than 85% of total annu-
Figure 3 Seasonal rainfall in Tana (en Beles) catchment (SMEC, 2008)
al rainfall (+/- 1700 mm) occurs between May and September during the “rainy season”. Very intense and energetic rainfall events during the rainy season cause tremendous water, sediment and nutrient discharge. In case of very intensive rainfall events even flooding may occur as soon as inflow into a particular area has exceeded the capacity of the drainage system. These flooding events are recur-
Figure 1: Water stress in the Horn of Africa (Source: BBC News, 28 June 2011) |
Figure 2: Lake Tana Catchment (Maes, 2011) |
24
Water - June 2012
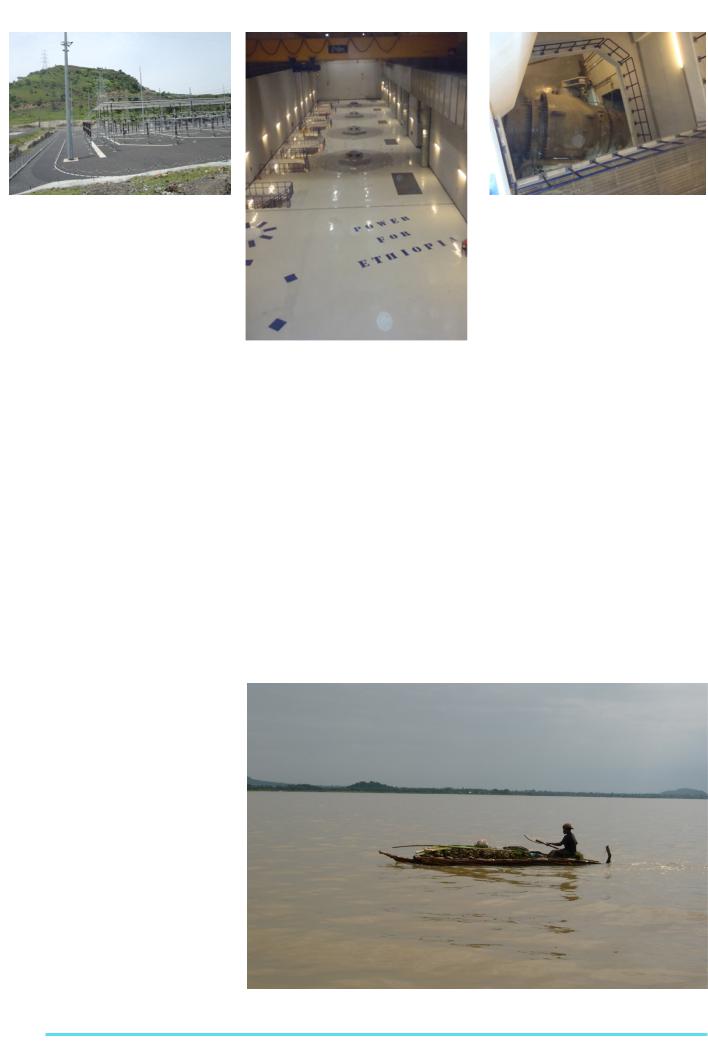
Figure 4: Cutting of roads due to flood event (Picture: Maes, 2011) |
Figure 5: Recently constructed dam (Picture: Maes, 2011) |
rent annual phenomena in areas near the lakeshore. From September till May only a very small amount of precipitation (+/- 10% of annual rainfall) occurs which is not enough for crop cultivation under standard rainfed conditions. (Figure 3)
The most evident solution to deal with seasonal rainfall is the construction of dams in the catchment. The major advantage of building dams is that they can store water in a reservoir during the rainy season. Current floodplain areas can be secured during the rainy season from floods after the construction of dams and the stored water can be used during the dry season for irrigation purposes and even small hydropower practices.
More irrigation agriculture is a possible solution to meet the food demand of the increasing and further developing population. Although dams seem to offer a good solution, disadvantages are related to the construction of dams. The main disadvantages of dam constructions are the high cost for construction and the disturbance of the ecological regime (alternating periods of droughts and floods). A
disturbance of the natural flow regime of the rivers also has a negative impact on the ecological system in the catchment. During the rainy season, high amounts of sediment transported by water lead to a rapid decrease of the reservoir’s storage capacity, the lifetime of the constructed dams decreases at a fast rate. Because of a lack in understanding of sediment dynamics sediment transport is often underestimated and the expected lifetimes of dams is overestimated. The construction of dams requires also space, which is limited in a densely populated area. (Figure 4) Twenty years ago, six suitable areas for construction of dams and reservoirs were identified during the Abbay Master Plan study.
Presently, only one of these dams is under construction and is even not finished yet (SMEC, 2009). (Figure 5)
Development
Ethiopia has 12 river basins with estimated surface and groundwater resources potentials of 122 and 2.6 billion
cubic meters, respectively (BCEOM, 1997). The level of water resources development in the country in general, and Lake Tana basin in particular, is low compared to its potentials. Based on different sources Ayalew et al. (2002) indicated that Ethiopia has the potential to develop 155 TWh/year of hydropower and 3.8 million of hectares of irrigated land. Until recently, only about 8% of the irrigation and 2% of the hydropower potentials were developed and the clean water supply coverage was as low as 34% (BCEOM, 1997).
In 2007, Lake Tana catchment has been identified by the Government of Ethiopia as a growth pole area where complementary investments are grouped to stimulate integrated development and accelerated growth. In the past, there was relatively low investment in water resources development, and its potential was hardly tapped because of a lack in financial resources and geopolitical struggles between Ethiopia and countries more downstream of the river Nile like Sudan and Egypt. The major water resource development in Lake Tana
Figure 6 Blue Nile hydropower station (Picture: SMEC, 2008)
Figure 7: Water inlet of Tana-Beles Hydropower station. Water is taken from Lake Tana (Picture: Maes, 2011)
25
The European Geographer, 8th Issue
Figure 8: Tana-Beles Hydropower house located at 150m below the earth surface (Picture: Maes, 2011)
catchment was the construction of the Blue Nile hydropower station next to the Blue Nile waterfalls in the early 1990ies.
The hydropower station was constructed about 30 km downstream of the inlet of the Blue Nile to meet the increasing demand of energy of the inhabitants in the catchment. In order to make sure that the hydropower station could operate during the whole year, a discharge-controlling dam ‘Chara Chara weir’ was constructed at the inlet of the Blue Nile in the late 80’s. The construction of this dam had an important impact on the river flow regime of the Blue Nile, especially near the Blue Nile falls. (Figure 6) The natural flow regime, consisting of large dischargesduringtherainyseasonandsmall discharges in the dry period, has been disturbed since the operation of the weir. Consequently also the ecological system has been disturbed.
To promote sustainable water resources development and management in the Tana catchments, the Ethiopian government launched the Tana-Beles Integrated Water Resources Development Program (TBIWRDP) in the 1990ies.
The TBIWRDP project combines the generation of 460 MW of hydropower and irrigation development. The project relies on water transfer from Lake Tana through a 12 km tunnel. The tunnel will feed a vertical penstock shaft at the floor of which an underground powerhouse is located. The powerhouse will contain 4 Francis turbines of 115 MW each for a total installed capacity of 460 MW. From the powerhouse the flow is released via a 7.1 km tailrace tunnel to the Juhana tributaryoftheBelesRiver.Theelevationfor hydropower generation is 311 m and the rated discharge is 160 m3s-1. This water flows out of Lake Tana. (Figures 7-10).
On-going and planned water resources developments in the Tana and Beles Basins are the construction of dams along the main rivers in the catchment and the implementation of irrigation struc-
26
Figure 9: One of the Francis Turbines in the power house (Picture: Maes, 2011)
tures in an area of 220 km2. All these developments will result in increased agricultural production, agro-industrial development, increased energy production, and protection against flooding. This will create jobs and increase the living standard in the project area. At the regional and national levels, these developments will be beneficial for economic growth and food self-sufficiency.
Degradation
The Lake Tana Basin is an area that is heavily affected by soil erosion, sediment transport and land degradation. The land and water resources of the basin and the Lake Tana ecosystem are in danger due to rapid population growth, deforestation, overgrazing, soil erosion, sediment deposition, storage capacity reduction,
Figure 10: Electricity is distributed from the earth surface (Picture: Maes, 2011)
drainage and water logging, flooding, pollutant transport and overexploitation of specific fish species.
The implementation of water resources development projects has impact on the environmental and hydrological system and is causing a lot of problems for different stakeholders. Water demand and water user sectors in the Tana basin that are affected by the planned water resources developments but do not benefit from them are fisheries, navigation, tourism, and environment. Fishery is an important economic activity in the Lake Tana area. According to a number of sources the maximum annual sustainable catch from Lake Tana is about 15,000 tonnes equivalent to 43 kg ha-1 yr-1.
A concern related to the planned water resources developments is that the construction of dams on the major rivers in the Tana Basin will affect the spawning behaviour of the fish and result in a decline of the fish population. (Figure 11) Navigation on Lake Tana plays an important role in the transport of people and goods, especially to and from the more isolated western part of the lake.
Figure 11 Traditional fisheries on Lake Tana (Picture: Maes, 2011)
Water - June 2012
There is serious concern at the Transport and Navigation Enterprise in Bahir Dar that the lake levels in future will drop to unacceptable low levels because of all planned developments. According to the enterprise, the minimum level of the lake should be 1785 meter above sea level.
Below this level, navigation is restricted because of the many shallows in the lake. At a lower lake level, many of the larger boats might hit rocks below the water surface, causing substantial damage. At that level, the boats could also no longer reach the harbours along the western shore of the lake and transport of goods and passengers between the boat and the harbours had to be done by barges.
Access to markets, schools, and health facilities will be seriously affected during low lake levels.
Bahir Dar, located at the southern shore of Lake Tana is an important tourism destination in Ethiopia. From Bahr Dar, boat trips are offered on the lake to visit ancient monasteries on the various islands. A major tourist attraction near Bahir Dar is the Blue Nile waterfalls, located about 35 km south-west of the town.
According to the tourist information bureau near the Blue Nile falls, the average number of visitors at the falls is about 30 000 Ethiopians and 10 000 foreigners per year. A major concern at the Culture and Tourism Bureau in Bahr Dar is that the attractiveness of the falls will be seriously affected, if the flow of water is drastically reduced due to the implementation of various structures.
Figure 12: Blue Nile waterfalls (Picture: Maes, 2011)
Since the construction of the Chara-Chara weir and the Blue Nile hydropower plant, the flow pattern has already changed drastically. Much of the discharge has been diverted at a short distance upstream of the falls to the hydropower station. Less discharge is left to flow from the beautiful waterfalls and the falls are losing their attractiveness. The local economy of people living in the area near the waterfalls is almost completely based on tourism. Local inhabitants living in the village of Tis Abay (near the waterfalls) fear the loss of income in future.(Figure 12)
Conclusion and recommendations
The catchment of Lake Tana, located in the northwestern plateau of Ethiopia, is an area where resources issues are critical for sustainable local and regional development because of its great potentials for irrigation; hydroelectric power; high value crops and livestock production, ecotourism and others.
Recently a lot of water resource developments have been implemented and in near future more projects will arise. Although these projects seem to have a positive impact on the development of the region and country, they also have negative local impacts and may result in conflicts or instability at a smaller scale. Before going on with the implementation of more structures it is important to focus on possible environmental impacts.
Ethiopia is one of the countries which is expected to be strongly affected by climate change and more pronounced droughts are expected in future. There-
fore water resources need to be evaluated critically to secret a sustainable future for Ethiopia.
Sharing minds, saving lives
In September 2011 an international conference on integrated water resources management in tropical and subtropical drylands was organized by Mekelle University in Mekelle, Northern Ethiopia.
The aim of the conference was to create a forum to exchange experiences and knowledge concerning sustainable water management. Various aspects of water management were discussed between international scientists, experts from governmental and non-governmental organizations and leading farmers.
References
Ayalew, L., 2002. Some things that we need to know about our rivers’ hydropower potential.
Online available: http://www.mediaethiopia. com/engineering.htm.
BBC News, 28th June 2011, online available: http://www.bbc.co.uk/news/world-afri- ca-13944550.
IPCC Fourth Assessment Report (2007). Working Group I Report “The Physical Science Basis”, Cambridge University Press, Cambridge,
996 p.
SMEC International Pty Ltd, (2008). Hydrological monitoring network. Hydrological study of the Tana-Beles sub-basins, 47p.
BCEOM, (1997). Abbay River Basin Integrated Development Master Plan Project.Phase 2: Data collection – site investigation survey and analysis, Section II: Sectoral Studies, Volume II:
Water Resources – Hydrology, p. 64-83.
27
The European Geographer, 8th Issue
Notes from a Newbie
Sille Marie Myreng,
EGEA Trondheim
Spring, 2011. As I write this, it has been exactly one year, one week and five days since I got the e-mail from EGEA Europe telling me that they had accepted our motivation letter.
It has been approximately four months since we were approved by the General Assembly, and two days since I returned from 2011’s NBRC, as psyched as ever on getting my entity to a new level. We are still fresh in the game, we still have a million ideas and challenges ready to be tried and carried out.
One year is not nearly enough to establish a new entity on firm ground, but time has given us a growing understanding of what EGEA is and what it gives to us being part of it. From a newbie’s point of view, here is our perception of the association so far.
The Egean spirit (Figure 1) is perhaps what I find most problematic to explain to someone who has not participated in a congress or any other event. Yet it is one of the most important aspects of EGEA, this atmosphere that is created when you gather so many young, eager geographers in one place. We all want to get to know each other, to party, to experience new things. But when we observe it with a geographer’s eye, everything we learn is fitted into a geographer’s understanding of the surroundings.
Our trade is knowledge of the world, and one of the side effects is the constant observation of what is going on in social interactions, planning and landscape around us at any time. Never is this as visible as when a bunch of geographers with different backgrounds are put together in a place that is new to most of them.
Figure 1: The EGEA SPIRIT
Networking is a major word when trying to paint the outlines of what EGEA gives to us. The opportunity to meet people from all over Europe, all with the same interests, is worth more than any ECTS can measure.
After five days at the AC you suddenly have someone to visit in dozens of cities, and through the website you can find a couch to sleep in, wherever there is an entity. Exchanges show you the city from the inside, and if you are thinking about studying abroad nothing is more useful than talking to someone who already lives there.
Motivation is another word of great importance; you get loads of it through EGEA. The motivation to continue your studies is one thing. However, for those who are fully involved (and that is hard to avoid, really), most of the motivation goes
towards motivating others to join. In this field, words are seldom enough.
Pictures and videos may work, but to recruit a wholehearted new Egean the experience must be first-hand. Making this possible demands all the energy and motivation you can gather, and if you succeed, it makes it all worth it. Once you really get caught in EGEA, nothing is more rewarding than to watch it grow.
Beer and Science come last on my list of Egean aspects, not because they are less important, but because they unite and underline all the other points. Any congress proves this beautifully, with a scientific program from 9 a.m. to 6 p.m. and partying from 9 p.m. to 6 a.m. It exhausts you, but for five days it works.
This mix may exist in other places, but I have never experienced it as exceptional as in EGEA. It makes Egeans who we are, for better or for worse.
This is what we have to work with when building up a new entity, and gathering all the support we need to grow and be active.
Other points worth mentioning could be the lack of money, time, knowledge and experience, all of which are obstacles we face continuously.
From what I’ve heard at regional meetings, CP-days and in conversations in general, these challenges will, in most cases, stay with us through the whole lifespan of the entity. I think it is good; it gives us something to work towards.
Although things may be moving slowly, they are moving. And the direction is straight ahead.
It has been four months since EGEA Trondheim was approved by the General Assembly. This autumn it will be our turn to vote for new entities. I am looking forward to it.
28
Water - June 2012
Sunny Weekend 2011
Sea, history and volcanoes
Sergio Cuevas,
EGEA Barcelona
The Sunny Weekend 2010, which was held in Menorca, turned out to be very successful.
That is why Egea Barcelona organized a second edition of the Sunny Weekend in May 2011. This time it took place in the north of Catalonia, which offers a diverse landscape with beautiful mountains within striking distance of the Mediterranean Sea.
On Friday 27th May, all the participants arrived and had dinner together. After welcoming all the participants, we played some get-to-know-each-other games.
The next day, we went on an excursion to the monastery of Sant Pere de Rodes, where we could enjoy marvellous views of the Costa Brava and the mountains next to the sea. While we were going up, we stopped from time to time to explain some geographical facts of every different zone that we were at. We had lunch in the monastery. Afterwards, most of us went to the beach to relax a little bit. In the evening we celebrated the victory of FC Barcelona in the final of the Champions League.
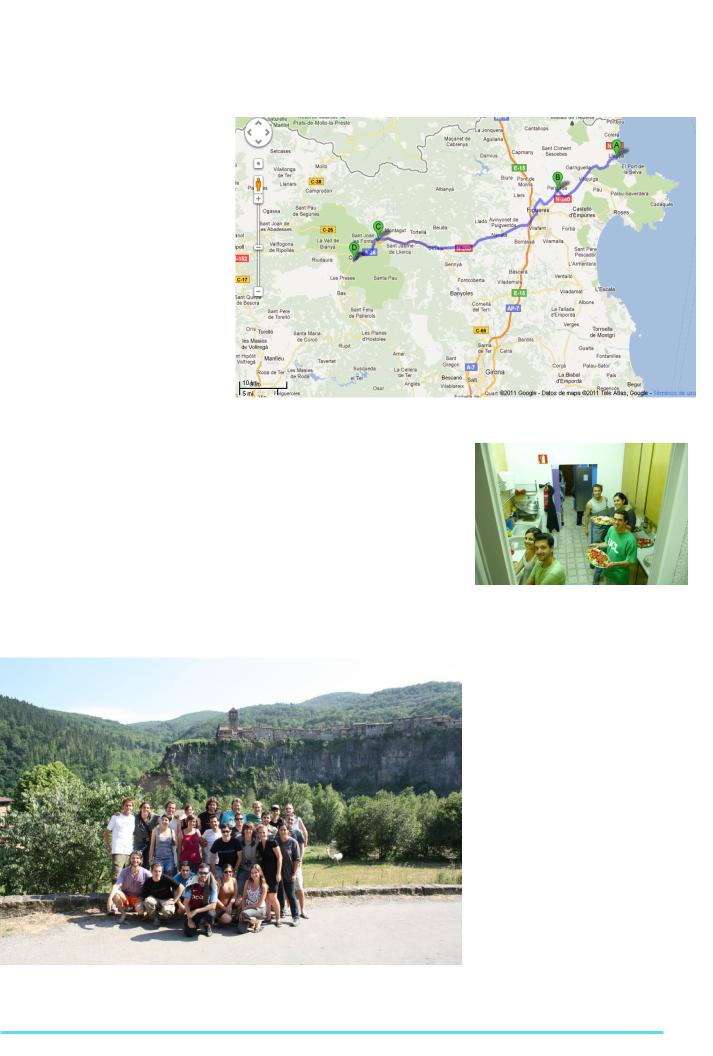
Figure 1: Map of Sunny Weekend 2011 visited locations Source: Google Maps
On Sunday, we visited different villages by bus. We stopped in Peralada, where we had a guided tour through the castle and some champagne tasting. Afterwards, we went to Castellfollit de la Roca, a village up on a cliff, which is originally a lava flow. We visited the village and learned a little bit about the geomorphology of the region and the peculiarities of Castellfollit de la Roca. Finally, we went to Olot, where our hostel was situated.
Figure 2 Preparing dinner
Source: Photo by Sergio Cuevas
On Monday, we went to a nature park that it is famous for its volcanoes. We walked around the volcanoes and explained the volcanic facts of this region to the participants.
This excursion was really successful, especially because most the participants had never been to a volcanic region before. After a last lunch at a restaurant, we bid each other a fond farewell and departed.
To put it in a nutshell, we had a great time together and we are already thinking about a third edition! So Egeans, stay tuned!
Figure 3: Sunny Weekend Team
Source: Photo by Sergio Cuevas
29
The European Geographer, 8th Issue
Western Regional Congress 2011
Sandra Teuber,
University of Tübingen
EGEA Tübingen
The WRC of 2011 took place in SintMichielsgestel in the Netherlands. The Congress theme was “Manscape: Welcome to our Human Landscape”.
The organisers from EGEA Utrecht wanted the participants to reflect on landscapes in general and especially on those of the Netherlands and all of Western Europe where almost no landscape is left untouched.
After the arrival the congress participants got accustomed to the new environment during a fun evening of games. The final of the night was the inside-out party, which lasted until the early morning hours.
On the second day the group excursions took place. The participants were able to choose between three different excursions. One went to Rotterdam; one to De Hoge Veluwe National Park and Flevopolder; a third one went to Southern Limburg.
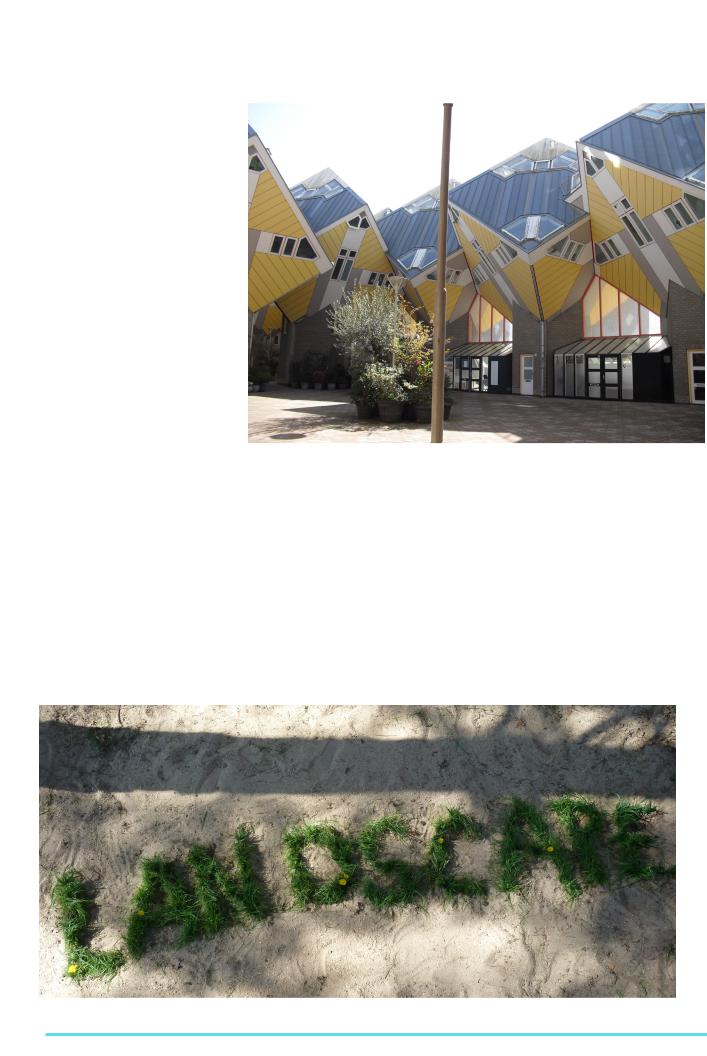
During the excursion to Rotterdam, in which I took part, we did a harbour tour on a ship, visited the cubic houses and eventually went to visit the Maeslantkering, a storm-surge barrier that protects the harbour and the city of Rotterdam (figure 1) as well as the rest of the province of Zuid-Holland.
Figure 1: Cubic Houses, Source: Teuber, 2011
The day ended with the cultural fair and a cheerful party. The Belgian table was voted the best since they managed to bring a keg of beer and make French fries for everyone. But all the other countries had great tables as well and everyone had a great time trying the specialities of all the different countries.
After a very short night, the workshop day started. Fortunately, the organisers provided us with lots of coffee and tea so that we all were able to attend interesting workshop sessions. The topics of the various workshops were all related to
landscapes and the human influence on them. I attended the workshop “Living in unsafe areas” where we worked with GIS to simulate urban expansion in Flanders. Afterwards, we coupled our results with a hydrology model to find out how likely it is that an unsafe area will be populated. Moreover, we checked what risks would be created and had to make a proper water management plan.
The fourth day started with skills and training sessions in which we could improve our demeanour and find out how to deal with stress. For that reason external ex-
Figure 2: Example of the visualisation work, Source: Esch, 2011
30