

n29fIAwxpY
.pdf100%
90%
80%
70%
60%
50%
40%
30%
20%
10%
0%
Ap07Tynk(1) pt1 |
Ap07Tynk(1) pt2 |
Ap07Tynk(1) pt3 |
Ap07Tynk(1) pt4 |
Ap07Tynk(1) pt5 |
Ap07Tynk(1) pt6 |
Ap07Tynk(1) pt7 |
Ap07Tynk(1) pt8 |
Ap07Tynk(1) pt9 |
Ap07Tynk(1) pt10 |
Ap07Tynk(1) pt11 |
Ap07Tynk(1) pt12 |
Ap07Tynk(1) pt13 |
Ap07Tynk(1) pt14 |
Ap07Tynk(1) pt15 |
Ap07Tynk(1) pt16 |
Ap07Tynk(1) pt17 |
Ap07Tynk(1) pt18 |
Ap07Tynk(1) pt19 |
Ap07Tynk(1) pt20 |
Ap07Tynk(1) pt21 |
Ap07Tynk(1) pt22 |
Ap07Tynk(1) pt23 |
Ap07Tynk(1) pt24 |
Ap07Tynk(1) pt25 |
100%
90%
80%
70%
60%
50%
40%
30%
20%
10%
0%
Ap08Tynk(1) pt1 |
Ap08Tynk(1) pt2 |
Ap08Tynk(1) pt3 |
Ap08Tynk(1) pt4 |
Ap08Tynk(1) pt5 |
Ap08Tynk(1) pt6 |
Ap08Tynk(1) pt7 |
Ap08Tynk(1) pt8 |
Ap08Tynk(1) pt9 |
Ap08Tynk(1) pt10 |
Ap08Tynk(1) pt11 |
Ap08Tynk(1) pt12 |
Ap08Tynk(1) pt13 |
Ap08Tynk(1) pt14 |
Ap08Tynk(1) pt15 |
Ap08Tynk(1) pt16 |
Ap08Tynk(1) pt17 |
Ap08Tynk(1) pt18 |
Ap08Tynk(1) pt19 |
Ap08Tynk(1) pt20 |
Ap08Tynk(1) pt21 |
Ap08Tynk(1) pt22 |
Ap08Tynk(1) pt23 |
Ap08Tynk(1) pt24 |
Ap08Tynk(1) pt25 |
100%
90%
80%
70%
60%
50%
40%
30%
20%
10%
0%
Ap09Tynk(1) pt1 |
Ap09Tynk(1) pt2 |
Ap09Tynk(1) pt3 |
Ap09Tynk(1) pt4 |
Ap09Tynk(1) pt5 |
Ap09Tynk(1) pt6 |
Ap09Tynk(1) pt7 |
Ap09Tynk(1) pt8 |
Ap09Tynk(1) pt9 |
Ap09Tynk(1) pt10 |
Ap09Tynk(1) pt11 |
Ap09Tynk(1) pt12 |
Ap09Tynk(1) pt13 |
Ap09Tynk(1) pt14 |
Ap09Tynk(1) pt15 |
Ap09Tynk(1) pt16 |
Ap09Tynk(1) pt17 |
Ap09Tynk(1) pt18 |
Ap09Tynk(1) pt19 |
Ap09Tynk(1) pt20 |
Ap09Tynk(1) pt21 |
Ap09Tynk(1) pt22 |
Ap09Tynk(1) pt23 |
Ap09Tynk(1) pt24 |
Ap09Tynk(1) pt25 |
W-M
 Ba-L
Ba-L
 Zn-L
Zn-L
 Fe-L
Fe-L
 Ti-K
Ti-K
 Ca-K
Ca-K
K-K
S-K
P-K
 Si-K
Si-K
 Al-K
Al-K
 Fe-L
Fe-L
V-K
 Ti-K
Ti-K
 Ca-K
Ca-K
K-K
S-K
 Si-K
Si-K
 Al-K
Al-K
 Mg-K
Mg-K
 Na-K
Na-K
 Pb-M
Pb-M
 Ca-K
Ca-K
K-K
S-K
 Si-K
Si-K
 Al-K
Al-K
 Mg-K
Mg-K
 Na-K
Na-K
O-K
C-K
61
100%
90%
80%
70%
60%
50%
40%
30%
20%
10%
0%
Ap10Tynk(1) pt1 |
Ap10Tynk(1) pt2 |
Ap10Tynk(1) pt3 |
Ap10Tynk(1) pt4 |
Ap10Tynk(1) pt5 |
Ap10Tynk(1) pt6 |
Ap10Tynk(1) pt7 |
Ap10Tynk(1) pt8 |
Ap10Tynk(1) pt9 |
Ap10Tynk(1) pt10 |
Ap10Tynk(1) pt11 |
Ap10Tynk(1) pt12 |
Ap10Tynk(1) pt13 |
Ap10Tynk(1) pt14 |
Ap10Tynk(1) pt15 |
Ap10Tynk(1) pt16 |
Ap10Tynk(1) pt17 |
Ap10Tynk(1) pt18 |
Ap10Tynk(1) pt19 |
Ap10Tynk(1) pt20 |
Ap10Tynk(1) pt21 |
Ap10Tynk(1) pt22 |
Ap10Tynk(1) pt23 |
Ap10Tynk(1) pt24 |
Ap10Tynk(1) pt25 |
100%
90%
80%
70%
60%
50%
40%
30%
20%
10%
0%
Ap11Tynk(1) pt1 |
Ap11Tynk(1) pt2 |
Ap11Tynk(1) pt3 |
Ap11Tynk(1) pt4 |
Ap11Tynk(1) pt5 |
Ap11Tynk(1) pt6 |
Ap11Tynk(1) pt7 |
Ap11Tynk(1) pt8 |
Ap11Tynk(1) pt9 |
Ap11Tynk(1) pt10 |
Ap11Tynk(1) pt11 |
Ap11Tynk(1) pt12 |
Ap11Tynk(1) pt13 |
Ap11Tynk(1) pt14 |
Ap11Tynk(1) pt15 |
Ap11Tynk(1) pt16 |
Ap11Tynk(1) pt17 |
Ap11Tynk(1) pt18 |
Ap11Tynk(1) pt19 |
Ap11Tynk(1) pt20 |
Ap11Tynk(1) pt21 |
Ap11Tynk(1) pt22 |
Ap11Tynk(1) pt23 |
Ap11Tynk(1) pt24 |
Ap11Tynk(1) pt25 |
100%
90%
80%
70%
60%
50%
40%
30%
20%
10%
0%
Ap12Tynk(1)_pt29
Ap12Tynk(1)_pt28
Ap12Tynk(1)_pt27
Ap12Tynk(1)_pt26
Ap12Tynk(1)_pt25
Ap12Tynk(1)_pt24
Ap12Tynk(1)_pt23
Ap12Tynk(1)_pt22
Ap12Tynk(1)_pt21
Ap12Tynk(1)_pt20
Ap12Tynk(1)_pt19
Ap12Tynk(1)_pt18
Ap12Tynk(1)_pt17
Ap12Tynk(1)_pt16
Ap12Tynk(1)_pt15
Ap12Tynk(1)_pt14
Ap12Tynk(1)_pt13
Ap12Tynk(1)_pt12
Ap12Tynk(1)_pt11
Ap12Tynk(1)_pt10
Ap12Tynk(1)_pt9
Ap12Tynk(1)_pt8
Ap12Tynk(1)_pt7
Ap12Tynk(1)_pt6
Ap12Tynk(1)_pt5
Ap12Tynk(1)_pt4
Ap12Tynk(1)_pt3
Ap12Tynk(1)_pt2
Ap12Tynk(1)_pt1
 Fe-L
Fe-L
 Ca-K
Ca-K
K-K
S-K
 Si-K
Si-K
 Al-K
Al-K
 Mg-K
Mg-K
 Na-K
Na-K
F-K
O-K
 Pm-L
Pm-L
 Br-L
Br-L
 Zn-L
Zn-L
 Fe-L
Fe-L
 Ti-K
Ti-K
 Ca-K
Ca-K
K-K
S-K
P-K
 Si-K
Si-K
 Al-K
Al-K
 Br-L
Br-L
 Fe-L
Fe-L
 Ti-K
Ti-K
 Ca-K
Ca-K
K-K
P-K
 Si-K
Si-K
 Al-K
Al-K
 Mg-K
Mg-K
 Na-K
Na-K
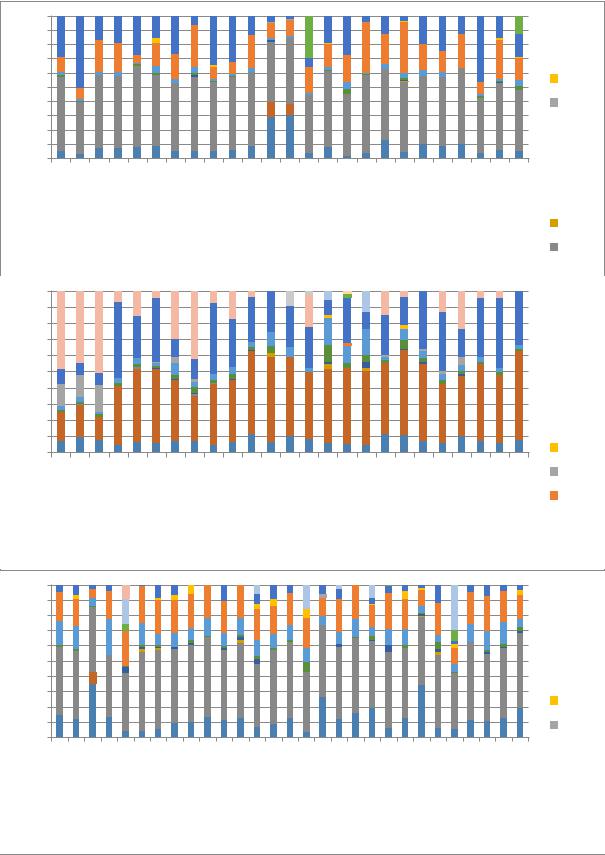
Fig. 2.8. Graphs of chemical composition of metals in individual Apatity plaster samples based on microscale studies
62
Tab. 2.1. The results of the Ap 01 sample microanalysis
Sample |
C |
N |
O |
F |
Na |
Mg |
Al |
Si |
P |
K |
Ca |
Ti |
Fe |
Ap01(1)_pt1 |
5.19 |
|
46.07 |
5.99 |
|
|
1.68 |
1.66 |
12.79 |
|
26.61 |
|
|
Ap01(1)_pt2 |
12.68 |
|
39.63 |
|
1.08 |
1.44 |
4.12 |
6.87 |
1.69 |
|
4.23 |
|
28.27 |
Ap01(1)_pt3 |
25.45 |
5.77 |
47.40 |
0.72 |
|
1.26 |
1.81 |
3.40 |
4.46 |
|
9.72 |
|
|
Ap01(1)_pt4 |
10.87 |
|
40.81 |
|
0.83 |
3.64 |
6.32 |
15.72 |
|
2.63 |
3.86 |
|
15.32 |
Ap01(1)_pt5 |
16.83 |
4.46 |
49.71 |
2.19 |
1.19 |
1.06 |
7.66 |
10.00 |
|
|
6.89 |
|
|
Ap01(1)_pt6 |
9.95 |
|
43.45 |
|
4.89 |
|
8.27 |
11.28 |
|
2.34 |
19.83 |
|
|
Ap01(1)_pt7 |
30.17 |
|
42.37 |
|
|
|
10.36 |
9.20 |
|
|
|
|
7.90 |
Ap01(1)_pt8 |
23.91 |
4.47 |
35.51 |
|
1.88 |
|
10.99 |
15.20 |
|
8.04 |
|
|
|
Ap01(1)_pt9 |
26.20 |
|
44.53 |
|
|
2.23 |
9.81 |
11.42 |
|
|
5.81 |
|
|
Ap01(1)_pt10 |
13.09 |
|
44.76 |
1.64 |
2.52 |
2.65 |
11.34 |
18.26 |
|
2.81 |
2.92 |
|
|
Ap01(1)_pt11 |
11.19 |
|
49.03 |
0.35 |
5.04 |
|
10.46 |
21.14 |
|
|
2.78 |
|
|
Ap01(1)_pt12 |
9.30 |
|
45.32 |
9.34 |
5.13 |
5.57 |
2.92 |
18.89 |
|
1.07 |
2.46 |
|
|
Ap01(1)_pt13 |
19.41 |
3.88 |
36.49 |
|
3.99 |
0.75 |
10.99 |
21.20 |
|
|
3.27 |
|
|
Ap01(1)_pt14 |
15.09 |
|
49.53 |
|
|
2.36 |
5.54 |
7.61 |
|
|
19.86 |
|
|
Ap01(1)_pt15 |
18.10 |
|
34.21 |
|
0.81 |
0.92 |
3.16 |
10.73 |
|
|
16.21 |
15.86 |
|
Ap01(1)_pt16 |
33.92 |
|
36.13 |
|
|
0.88 |
3.99 |
5.56 |
5.31 |
|
14.20 |
|
|
Ap01(1)_pt17 |
7.96 |
|
42.39 |
|
2.86 |
3.87 |
2.49 |
18.03 |
|
|
8.55 |
|
13.85 |
Ap01(1)_pt18 |
20.04 |
|
44.75 |
|
7.06 |
1.13 |
10.39 |
13.07 |
|
2.51 |
1.05 |
|
|
Ap01(1)_pt19 |
14.15 |
|
46.04 |
0.10 |
1.90 |
1.53 |
4.35 |
14.95 |
|
0.66 |
9.08 |
7.24 |
|
Ap01(1)_pt20 |
18.30 |
5.03 |
45.26 |
2.81 |
0.56 |
0.82 |
2.19 |
4.16 |
7.46 |
|
13.41 |
|
|
Ap01(1)_pt21 |
32.51 |
9.19 |
46.48 |
|
|
1.14 |
2.87 |
4.05 |
0.64 |
|
3.13 |
|
|
Ap01(1)_pt22 |
7.18 |
|
36.43 |
|
1.45 |
0.43 |
3.28 |
7.43 |
|
0.60 |
1.84 |
|
41.33 |
Ap01(1)_pt23 |
8.63 |
|
33.75 |
|
7.74 |
1.28 |
3.38 |
23.40 |
|
|
3.09 |
|
18.72 |
Ap01(1)_pt24 |
26.51 |
|
47.71 |
|
|
1.38 |
6.81 |
9.59 |
|
|
8.01 |
|
|
Ap01(1)_pt25 |
8.39 |
|
41.33 |
|
|
0.45 |
11.30 |
14.66 |
|
|
12.85 |
|
11.02 |
Ap01(1)_pt26 |
8.41 |
|
43.79 |
|
|
6.47 |
3.45 |
17.99 |
|
|
6.31 |
|
13.58 |
Tab. 2.2. The results of the Ap 02 sample microanalysis
Sample |
C |
O |
F |
Na |
Mg |
Al |
Si |
P |
Cl |
K |
Ca |
Ti |
Fe |
Zn |
Br |
Ap02(1)_pt1 |
2.63 |
51.23 |
2.50 |
0.62 |
0.57 |
5.13 |
18.22 |
|
|
|
19.09 |
|
|
|
|
Ap02(1)_pt2 |
3.15 |
45.22 |
|
|
0.60 |
1.10 |
11.83 |
|
|
|
38.10 |
|
|
|
|
Ap02(1)_pt3 |
2.73 |
39.67 |
|
|
0.88 |
6.59 |
9.69 |
|
|
|
26.01 |
1.26 |
13.18 |
|
|
Ap02(1)_pt4 |
2.47 |
44.69 |
2.03 |
0.44 |
0.65 |
8.38 |
10.90 |
|
|
|
30.45 |
|
|
|
|
Ap02(1)_pt5 |
6.30 |
55.82 |
|
|
|
0.99 |
5.95 |
|
|
|
30.95 |
|
|
|
|
Ap02(1)_pt6 |
4.84 |
36.75 |
|
|
|
3.69 |
10.00 |
1.06 |
|
|
7.29 |
|
32.72 |
3.66 |
|
Ap02(1)_pt7 |
10.73 |
49.83 |
1.55 |
0.79 |
0.54 |
5.61 |
12.06 |
|
0.40 |
|
12.67 |
5.82 |
|
|
|
Ap02(1)_pt8 |
3.22 |
37.57 |
|
|
0.56 |
7.18 |
9.57 |
|
|
|
32.84 |
|
9.06 |
|
|
Ap02(1)_pt9 |
3.98 |
42.12 |
|
|
|
1.01 |
9.34 |
|
|
|
12.86 |
|
30.70 |
|
|
Ap02(1)_pt10 |
4.94 |
41.48 |
|
|
|
1.80 |
11.83 |
|
|
0.88 |
14.38 |
|
24.68 |
|
|
Ap02(1)_pt11 |
2.94 |
37.23 |
|
|
0.45 |
3.65 |
13.09 |
|
|
|
39.38 |
|
3.26 |
|
|
Ap02(1)_pt12 |
4.91 |
40.29 |
|
0.69 |
|
2.10 |
36.30 |
|
|
1.76 |
13.95 |
|
|
|
|
Ap02(1)_pt13 |
6.91 |
58.35 |
|
|
|
0.54 |
4.91 |
|
|
|
29.29 |
|
|
|
|
Ap02(1)_pt14 |
2.51 |
40.62 |
|
|
|
|
8.13 |
|
|
|
48.74 |
|
|
|
|
Ap02(1)_pt15 |
5.33 |
47.46 |
|
|
|
0.82 |
6.71 |
|
|
|
39.68 |
|
|
|
|
Ap02(1)_pt16 |
4.34 |
41.99 |
|
|
|
0.72 |
9.32 |
|
|
|
43.63 |
|
|
|
|
Ap02(1)_pt17 |
6.91 |
56.05 |
|
|
|
1.29 |
6.02 |
|
|
0.62 |
29.12 |
|
|
|
|
Ap02(1)_pt18 |
3.37 |
51.64 |
|
0.79 |
0.71 |
3.63 |
20.93 |
|
|
0.94 |
10.10 |
|
7.89 |
|
|
Ap02(1)_pt19 |
2.86 |
43.64 |
|
|
|
1.19 |
10.14 |
|
|
|
42.17 |
|
|
|
|
Ap02(1)_pt20 |
4.16 |
55.62 |
|
1.12 |
1.13 |
2.31 |
25.50 |
|
|
1.13 |
9.05 |
|
|
|
|
Ap02(1)_pt21 |
5.91 |
53.57 |
|
|
|
1.08 |
6.78 |
|
|
|
32.66 |
|
|
|
|
Ap02(1)_pt22 |
3.70 |
37.45 |
|
|
|
0.83 |
8.58 |
|
|
|
16.00 |
|
33.43 |
|
|
Ap02(1)_pt23 |
2.41 |
45.74 |
|
|
0.67 |
5.84 |
14.03 |
|
|
0.63 |
19.42 |
|
11.28 |
|
|
Ap02(1)_pt24 |
7.13 |
55.55 |
|
|
|
|
6.58 |
|
|
|
28.18 |
|
|
|
2.56 |
Ap02(1)_pt25 |
6.60 |
55.28 |
|
|
0.14 |
0.42 |
6.72 |
|
|
|
30.83 |
|
|
|
|
Ap02(1)_pt26 |
3.87 |
46.74 |
5.88 |
|
|
2.25 |
23.55 |
|
|
0.79 |
16.93 |
|
|
|
|
63
Tab. 2.3. The results of the Ap 03 sample microanalysis
Sample |
C |
N |
O |
F |
Mg |
Al |
Si |
P |
S |
K |
Ca |
Ti |
Fe |
Zn |
Br |
Ba |
Ap03(1)_pt1 |
4.37 |
|
32.36 |
|
|
0.70 |
1.74 |
|
7.78 |
|
6.23 |
2.61 |
|
13.23 |
|
30.98 |
Ap03(1)_pt2 |
3.07 |
|
29.04 |
|
|
0.82 |
2.32 |
|
9.53 |
|
3.98 |
|
|
7.68 |
|
43.56 |
Ap03(1)_pt3 |
4.03 |
|
15.61 |
|
|
1.31 |
2.77 |
|
2.71 |
|
7.31 |
|
|
15.95 |
|
50.31 |
Ap03(1)_pt4 |
3.23 |
|
28.48 |
|
|
1.04 |
2.06 |
|
9.46 |
|
3.77 |
|
|
10.02 |
|
41.93 |
Ap03(1)_pt5 |
6.12 |
|
31.19 |
|
|
1.13 |
2.44 |
|
|
|
12.69 |
2.64 |
|
43.79 |
|
|
Ap03(1)_pt6 |
3.64 |
|
24.65 |
|
|
1.08 |
2.07 |
|
7.40 |
|
5.89 |
3.27 |
|
10.10 |
|
41.90 |
Ap03(1)_pt7 |
6.03 |
|
42.05 |
|
0.73 |
3.23 |
6.64 |
1.63 |
|
|
11.25 |
5.13 |
4.53 |
18.78 |
|
|
Ap03(1)_pt8 |
5.73 |
|
29.75 |
|
|
0.78 |
2.59 |
|
3.56 |
|
10.29 |
4.60 |
|
25.71 |
|
16.98 |
Ap03(1)_pt9 |
7.54 |
|
36.96 |
|
|
|
11.70 |
|
|
|
26.16 |
|
|
11.75 |
5.88 |
|
Ap03(1)_pt10 |
5.13 |
|
43.70 |
|
3.82 |
7.45 |
10.19 |
|
|
|
8.09 |
1.47 |
11.71 |
8.45 |
|
|
Ap03(1)_pt11 |
8.29 |
|
36.36 |
|
1.37 |
6.57 |
20.26 |
0.56 |
|
|
12.65 |
2.45 |
|
11.49 |
|
|
Ap03(1)_pt12 |
14.38 |
|
44.40 |
0.86 |
0.84 |
1.92 |
5.70 |
|
0.55 |
|
15.55 |
2.49 |
|
13.30 |
|
|
Ap03(1)_pt13 |
6.30 |
|
39.35 |
|
|
2.20 |
5.35 |
|
|
|
22.90 |
10.20 |
|
13.71 |
|
|
Ap03(1)_pt14 |
5.72 |
|
32.53 |
0.71 |
|
2.52 |
12.44 |
|
|
0.88 |
37.26 |
|
|
7.94 |
|
|
Ap03(1)_pt15 |
8.74 |
|
42.87 |
0.45 |
0.88 |
2.62 |
12.48 |
|
|
|
17.54 |
|
|
14.42 |
|
|
Ap03(1)_pt16 |
8.20 |
|
40.67 |
|
|
2.74 |
7.16 |
|
|
|
22.38 |
|
|
18.85 |
|
|
Ap03(1)_pt17 |
11.80 |
|
43.82 |
|
|
2.43 |
7.89 |
|
|
|
19.61 |
|
|
14.45 |
|
|
Ap03(1)_pt18 |
8.04 |
|
46.74 |
|
|
2.72 |
8.73 |
|
|
1.68 |
24.65 |
|
|
7.45 |
|
|
Ap03(1)_pt19 |
5.24 |
|
36.49 |
|
|
1.61 |
4.29 |
|
|
|
33.84 |
3.49 |
|
15.04 |
|
|
Ap03(1)_pt20 |
5.73 |
|
36.76 |
|
|
1.94 |
4.84 |
0.94 |
4.01 |
|
13.30 |
15.33 |
|
17.15 |
|
|
Ap03(1)_pt21 |
5.87 |
|
43.34 |
0.43 |
0.36 |
3.86 |
9.42 |
|
|
|
22.32 |
3.38 |
|
11.02 |
|
|
Ap03(1)_pt22 |
7.46 |
|
38.40 |
|
0.98 |
3.20 |
8.09 |
|
|
|
16.46 |
13.46 |
|
11.94 |
|
|
Ap03(1)_pt23 |
4.05 |
|
34.47 |
0.00 |
0.66 |
2.06 |
5.17 |
|
|
|
27.20 |
16.44 |
|
9.96 |
|
|
Ap03(1)_pt24 |
19.94 |
5.06 |
38.78 |
|
|
0.99 |
2.37 |
0.75 |
|
|
6.49 |
15.99 |
|
9.61 |
|
|
Ap03(1)_pt25 |
7.35 |
|
51.14 |
|
0.98 |
5.21 |
20.81 |
|
|
0.84 |
5.73 |
2.02 |
|
5.92 |
|
|
Tab. 2.4. The results of the Ap 04 sample microanalysis
Sample |
C |
N |
O |
F |
Na |
Mg |
Al |
Si |
P |
K |
Ca |
Ti |
Fe |
Zn |
Br |
Ap04(1)_pt1 |
2.88 |
|
29.21 |
|
|
|
1.88 |
3.14 |
|
|
1.90 |
|
60.99 |
|
|
Ap04(1)_pt2 |
8.00 |
|
50.66 |
0.70 |
1.62 |
1.00 |
3.04 |
6.91 |
|
1.82 |
26.25 |
|
|
|
|
Ap04(1)_pt3 |
8.24 |
|
53.87 |
|
1.42 |
0.53 |
2.28 |
7.33 |
|
0.77 |
25.56 |
|
|
|
|
Ap04(1)_pt4 |
14.48 |
|
40.33 |
|
3.23 |
|
|
11.58 |
|
|
13.75 |
|
8.61 |
|
8.03 |
Ap04(1)_pt5 |
6.76 |
|
38.51 |
|
3.06 |
1.07 |
8.45 |
16.08 |
0.95 |
3.48 |
4.56 |
|
17.08 |
|
|
Ap04(1)_pt6 |
35.99 |
15.80 |
36.90 |
|
|
|
2.31 |
4.91 |
|
|
4.08 |
|
|
|
|
Ap04(1)_pt7 |
15.75 |
|
48.40 |
1.35 |
2.37 |
|
5.81 |
13.91 |
|
|
12.41 |
|
|
|
|
Ap04(1)_pt8 |
12.42 |
|
44.69 |
|
1.76 |
|
4.30 |
14.24 |
|
1.73 |
20.86 |
|
|
|
|
Ap04(1)_pt9 |
9.54 |
|
46.99 |
|
1.92 |
1.28 |
3.39 |
7.82 |
0.78 |
|
28.29 |
|
|
|
|
Ap04(1)_pt10 |
33.22 |
|
45.37 |
0.42 |
2.25 |
|
4.68 |
7.77 |
|
1.31 |
4.98 |
|
|
|
|
Ap04(1)_pt11 |
22.78 |
|
47.63 |
0.50 |
|
|
7.14 |
14.08 |
0.74 |
1.15 |
5.97 |
|
|
|
|
Ap04(1)_pt12 |
14.89 |
|
47.12 |
|
2.97 |
|
5.95 |
12.62 |
|
3.15 |
13.30 |
|
|
|
|
Ap04(1)_pt13 |
6.94 |
|
37.64 |
|
2.16 |
1.92 |
4.88 |
8.48 |
|
1.38 |
3.71 |
|
32.90 |
|
|
Ap04(1)_pt14 |
7.38 |
|
42.17 |
1.36 |
2.44 |
1.10 |
4.90 |
10.28 |
|
2.72 |
27.65 |
|
|
|
|
Ap04(1)_pt15 |
8.51 |
|
46.32 |
1.27 |
4.44 |
|
8.18 |
16.23 |
0.54 |
3.40 |
8.03 |
3.09 |
|
|
|
Ap04(1)_pt16 |
22.26 |
|
47.17 |
0.83 |
3.11 |
0.66 |
6.30 |
13.28 |
|
0.81 |
5.58 |
|
|
|
|
Ap04(1)_pt17 |
9.83 |
|
41.39 |
|
|
0.64 |
5.05 |
14.71 |
|
3.06 |
14.48 |
|
5.65 |
5.17 |
|
Ap04(1)_pt18 |
6.91 |
|
45.81 |
|
2.38 |
0.58 |
7.30 |
14.61 |
|
2.03 |
8.85 |
|
11.52 |
|
|
Ap04(1)_pt19 |
10.33 |
|
48.33 |
2.51 |
|
1.45 |
6.21 |
13.30 |
|
4.62 |
13.25 |
|
|
|
|
Ap04(1)_pt20 |
6.60 |
|
38.20 |
|
|
1.21 |
4.90 |
9.54 |
6.46 |
0.93 |
13.81 |
|
10.08 |
8.26 |
|
Ap04(1)_pt21 |
7.88 |
|
38.01 |
1.89 |
|
|
4.10 |
21.60 |
|
1.68 |
22.02 |
|
|
2.83 |
|
Ap04(1)_pt22 |
5.95 |
|
45.64 |
|
2.85 |
0.99 |
5.74 |
15.35 |
|
1.74 |
21.74 |
|
|
|
|
Ap04(1)_pt23 |
10.69 |
|
50.51 |
0.00 |
2.42 |
|
2.39 |
6.95 |
|
|
27.04 |
|
|
|
|
Ap04(1)_pt24 |
6.27 |
|
40.12 |
2.15 |
2.76 |
1.31 |
5.01 |
9.21 |
|
3.26 |
15.57 |
14.34 |
|
|
|
Ap04(1)_pt25 |
11.35 |
|
48.35 |
0.87 |
2.63 |
1.24 |
7.95 |
18.50 |
|
1.33 |
7.78 |
|
|
|
|
64
Tab. 2.5. The results of the Ap 05 sample microanalysis
Sample |
C |
O |
F |
Na |
Mg |
Al |
Si |
K |
Ca |
Fe |
Br |
Ap05(1)_pt1 |
3.18 |
43.74 |
|
|
2.51 |
9.23 |
16.25 |
0.85 |
4.79 |
19.45 |
|
Ap05(1)_pt2 |
8.96 |
48.22 |
|
|
1.59 |
8.01 |
16.82 |
|
16.40 |
|
|
Ap05(1)_pt3 |
6.51 |
42.20 |
|
|
1.73 |
8.26 |
14.68 |
|
20.12 |
6.49 |
|
Ap05(1)_pt4 |
30.29 |
48.01 |
1.17 |
|
0.95 |
4.40 |
7.17 |
|
8.00 |
|
|
Ap05(1)_pt5 |
7.28 |
39.22 |
|
0.58 |
1.39 |
|
11.77 |
2.03 |
24.60 |
|
13.13 |
Ap05(1)_pt6 |
8.02 |
52.84 |
1.58 |
|
1.55 |
7.27 |
21.55 |
|
7.19 |
|
|
Ap05(1)_pt7 |
13.42 |
52.08 |
|
3.03 |
|
9.10 |
22.37 |
|
|
|
|
Ap05(1)_pt8 |
2.24 |
41.78 |
|
1.31 |
4.68 |
5.93 |
17.79 |
0.85 |
6.00 |
19.41 |
|
Ap05(1)_pt9 |
8.57 |
50.66 |
|
1.70 |
|
7.68 |
15.43 |
|
15.96 |
|
|
Ap05(1)_pt10 |
3.66 |
49.69 |
0.26 |
|
7.29 |
9.87 |
20.94 |
0.96 |
7.34 |
|
|
Ap05(1)_pt11 |
7.38 |
51.20 |
|
|
|
5.62 |
14.39 |
|
21.41 |
|
|
Ap05(1)_pt12 |
3.96 |
45.64 |
0.00 |
4.65 |
1.03 |
10.18 |
29.74 |
|
4.81 |
|
|
Ap05(1)_pt13 |
6.56 |
48.80 |
|
|
9.34 |
9.34 |
13.96 |
|
11.99 |
|
|
Ap05(1)_pt14 |
8.42 |
49.43 |
|
|
0.88 |
6.89 |
10.70 |
|
23.67 |
|
|
Ap05(1)_pt15 |
16.50 |
48.90 |
|
|
1.87 |
8.36 |
16.25 |
1.69 |
6.44 |
|
|
Ap05(1)_pt16 |
7.03 |
51.68 |
|
|
|
|
4.07 |
|
32.92 |
|
4.29 |
Ap05(1)_pt17 |
5.84 |
53.81 |
2.65 |
|
1.37 |
9.76 |
18.65 |
|
7.93 |
|
|
Ap05(1)_pt18 |
8.66 |
50.90 |
|
2.23 |
1.30 |
7.33 |
16.69 |
|
12.89 |
|
|
Ap05(1)_pt19 |
7.80 |
48.96 |
|
2.54 |
2.44 |
8.64 |
19.91 |
|
9.72 |
|
|
Ap05(1)_pt20 |
8.65 |
50.18 |
|
1.67 |
1.31 |
8.21 |
16.83 |
|
13.14 |
|
|
Ap05(1)_pt21 |
4.95 |
42.68 |
0.38 |
|
0.62 |
3.47 |
6.81 |
|
41.11 |
|
|
Ap05(1)_pt22 |
12.00 |
48.17 |
|
|
1.76 |
11.43 |
18.88 |
|
7.76 |
|
|
Ap05(1)_pt23 |
9.91 |
36.12 |
|
1.49 |
1.16 |
8.42 |
25.62 |
13.00 |
4.29 |
|
|
Ap05(1)_pt24 |
4.49 |
42.29 |
0.71 |
|
1.52 |
4.65 |
11.43 |
|
34.91 |
|
|
Ap05(1)_pt25 |
8.44 |
47.09 |
|
|
1.45 |
7.84 |
13.87 |
|
21.32 |
|
|
Tab. 2.6. The results of the Ap 06 sample microanalysis
Sample |
C |
O |
F |
Na |
Mg |
Al |
Si |
S |
K |
Ca |
Ti |
Fe |
Zn |
Br |
W |
Pb |
Ba |
Ap06(1)_pt1 |
3.11 |
50.57 |
0.11 |
|
2.70 |
3.73 |
19.97 |
0.40 |
|
4.95 |
10.15 |
|
3.62 |
|
|
0.69 |
|
Ap06(1)_pt2 |
4.08 |
54.41 |
0.64 |
|
1.10 |
4.78 |
19.68 |
|
|
8.15 |
7.16 |
|
|
|
|
|
|
Ap06(1)_pt3 |
5.41 |
53.44 |
0.87 |
|
0.76 |
4.08 |
19.45 |
|
0.84 |
9.77 |
5.38 |
|
|
|
|
|
|
Ap06(1)_pt4 |
5.42 |
50.59 |
0.92 |
|
|
|
9.16 |
|
|
27.91 |
|
|
|
6.00 |
|
|
|
Ap06(1)_pt5 |
4.12 |
40.90 |
|
|
0.89 |
2.32 |
5.47 |
|
|
46.30 |
|
|
|
|
|
|
|
Ap06(1)_pt6 |
7.46 |
53.49 |
0.48 |
|
|
1.74 |
3.95 |
|
|
32.88 |
|
|
|
|
|
|
|
Ap06(1)_pt7 |
6.21 |
46.77 |
1.64 |
1.25 |
4.67 |
4.56 |
14.02 |
|
|
20.89 |
|
|
|
|
|
|
|
Ap06(1)_pt8 |
3.80 |
43.08 |
|
|
|
2.06 |
4.98 |
|
|
46.08 |
|
|
|
|
|
|
|
Ap06(1)_pt9 |
5.35 |
50.25 |
|
3.19 |
2.87 |
5.96 |
14.72 |
|
|
17.66 |
|
|
|
|
|
|
|
Ap06(1)_pt10 |
8.33 |
44.93 |
|
3.49 |
0.61 |
8.95 |
21.98 |
|
|
11.71 |
|
|
|
|
|
|
|
Ap06(1)_pt11 |
7.11 |
53.44 |
0.00 |
|
2.47 |
5.29 |
17.81 |
|
|
8.10 |
|
|
5.78 |
|
|
|
|
Ap06(1)_pt12 |
4.84 |
48.09 |
|
|
1.62 |
4.01 |
9.12 |
|
|
32.32 |
|
|
|
|
|
|
|
Ap06(1)_pt13 |
8.50 |
43.88 |
1.01 |
1.41 |
4.45 |
3.91 |
18.52 |
|
|
18.32 |
|
|
|
|
|
|
|
Ap06(1)_pt14 |
22.67 |
43.11 |
|
|
|
|
1.47 |
|
|
22.66 |
5.99 |
|
4.09 |
|
|
|
|
Ap06(1)_pt15 |
29.04 |
46.15 |
|
|
|
|
0.98 |
|
|
19.66 |
4.16 |
|
|
|
|
|
|
Ap06(1)_pt16 |
8.63 |
55.34 |
|
|
|
|
0.73 |
|
|
33.95 |
|
|
1.35 |
|
|
|
|
Ap06(1)_pt17 |
8.66 |
41.24 |
|
|
|
4.55 |
15.60 |
|
|
29.95 |
|
|
|
|
|
|
|
Ap06(1)_pt18 |
3.29 |
50.25 |
1.11 |
|
1.03 |
3.49 |
17.20 |
0.61 |
|
12.18 |
10.83 |
|
|
|
|
|
|
Ap06(1)_pt19 |
6.25 |
53.46 |
|
|
|
0.45 |
0.79 |
|
|
37.50 |
|
|
|
|
1.55 |
|
|
Ap06(1)_pt20 |
6.77 |
54.50 |
|
|
|
|
1.05 |
|
|
37.68 |
|
|
|
|
|
|
|
Ap06(1)_pt21 |
7.17 |
57.35 |
|
|
|
|
1.33 |
|
|
34.15 |
|
|
|
|
|
|
|
Ap06(1)_pt22 |
7.22 |
51.29 |
|
|
|
1.18 |
2.20 |
|
|
38.11 |
|
|
|
|
|
|
|
Ap06(1)_pt23 |
4.06 |
39.95 |
|
0.55 |
|
1.49 |
3.06 |
|
|
50.90 |
|
|
|
|
|
|
|
Ap06(1)_pt24 |
6.18 |
56.87 |
|
0.61 |
0.65 |
1.87 |
3.90 |
|
|
29.92 |
|
|
|
|
|
|
|
Ap06(1)_pt25 |
5.95 |
53.13 |
|
|
1.70 |
2.74 |
7.96 |
|
|
28.53 |
|
|
|
|
|
|
|
Ap06(2)_pt1 |
4.34 |
33.79 |
|
|
0.55 |
1.80 |
4.92 |
8.48 |
|
6.55 |
4.93 |
|
|
|
|
|
34.63 |
Ap06(2)_pt2 |
3.87 |
34.01 |
1.54 |
|
|
4.37 |
16.29 |
|
|
23.16 |
16.76 |
|
|
|
|
|
|
Ap06(2)_pt3 |
4.77 |
29.12 |
|
|
0.66 |
3.26 |
11.66 |
|
|
10.62 |
3.09 |
32.73 |
4.10 |
|
|
|
|
Ap06(2)_pt4 |
11.13 |
46.88 |
|
0.33 |
1.75 |
|
8.29 |
|
|
19.48 |
6.73 |
|
|
5.42 |
|
|
|
Ap06(2)_pt5 |
13.68 |
27.99 |
0.63 |
|
0.70 |
2.10 |
3.97 |
|
|
9.51 |
2.05 |
|
39.37 |
|
|
|
|
Ap06(2)_pt6 |
4.91 |
19.84 |
|
|
|
2.06 |
6.55 |
|
|
5.41 |
7.16 |
54.07 |
|
|
|
|
|
65
Tab. 2.7. The results of the Ap 07 sample microanalysis
Sample |
C |
N |
O |
F |
Na |
Mg |
Al |
Si |
P |
S |
K |
Ca |
Ti |
Fe |
Zn |
Ba |
W |
Ap07(1)_pt1 |
3.27 |
|
29.28 |
|
|
|
|
1.24 |
|
10.54 |
|
3.42 |
|
|
|
49.67 |
2.58 |
Ap07(1)_pt2 |
5.51 |
|
37.50 |
|
|
|
1.55 |
5.62 |
1.59 |
1.00 |
|
5.75 |
|
36.82 |
4.66 |
|
|
Ap07(1)_pt3 |
5.56 |
|
50.52 |
1.75 |
|
|
1.06 |
12.92 |
|
|
|
14.40 |
13.78 |
|
|
|
|
Ap07(1)_pt4 |
10.37 |
|
38.69 |
|
|
0.89 |
2.82 |
8.02 |
2.48 |
|
|
10.91 |
3.28 |
18.44 |
4.12 |
|
|
Ap07(1)_pt5 |
11.11 |
|
45.27 |
0.67 |
6.67 |
|
7.16 |
25.14 |
|
|
|
3.97 |
|
|
|
|
|
Ap07(1)_pt6 |
10.56 |
|
49.04 |
0.85 |
1.48 |
0.57 |
3.10 |
10.36 |
|
|
|
24.04 |
|
|
|
|
|
Ap07(1)_pt7 |
8.57 |
|
53.56 |
0.00 |
2.25 |
0.93 |
4.41 |
11.54 |
|
|
|
18.75 |
|
|
|
|
|
Ap07(1)_pt8 |
7.12 |
|
39.93 |
|
|
|
2.73 |
8.63 |
|
|
|
41.60 |
|
|
|
|
|
Ap07(1)_pt9 |
11.34 |
3.00 |
39.11 |
|
|
1.03 |
3.60 |
13.00 |
|
|
|
13.58 |
|
11.04 |
4.31 |
|
|
Ap07(1)_pt10 |
11.68 |
|
43.62 |
0.66 |
|
1.63 |
9.16 |
21.07 |
|
|
1.44 |
10.75 |
|
|
|
|
|
Ap07(1)_pt11 |
18.90 |
|
45.73 |
|
|
|
3.32 |
11.92 |
|
|
|
20.13 |
|
|
|
|
|
Ap07(1)_pt12 |
45.08 |
|
41.13 |
|
|
|
1.45 |
3.98 |
1.12 |
0.55 |
|
6.68 |
|
|
|
|
|
Ap07(1)_pt13 |
4.70 |
|
36.97 |
|
|
|
2.26 |
6.67 |
|
|
|
49.41 |
|
|
|
|
|
Ap07(1)_pt14 |
12.84 |
|
50.39 |
|
1.51 |
|
4.47 |
13.41 |
|
|
|
17.38 |
|
|
|
|
|
Ap07(1)_pt15 |
12.31 |
|
48.22 |
|
1.45 |
1.59 |
5.42 |
11.49 |
|
|
|
19.51 |
|
|
|
|
|
Ap07(1)_pt16 |
4.92 |
|
52.08 |
|
4.52 |
|
10.77 |
21.86 |
|
|
|
5.86 |
|
|
|
|
|
Ap07(1)_pt17 |
16.34 |
5.58 |
44.37 |
6.20 |
|
3.70 |
5.32 |
11.07 |
|
|
3.17 |
4.26 |
|
|
|
|
|
Ap07(1)_pt18 |
6.88 |
|
41.58 |
|
0.68 |
0.85 |
3.04 |
9.66 |
|
0.55 |
|
36.76 |
|
|
|
|
|
Ap07(1)_pt19 |
29.29 |
6.74 |
38.75 |
|
1.08 |
0.85 |
3.29 |
8.16 |
|
|
|
11.84 |
|
|
|
|
|
Ap07(1)_pt20 |
10.73 |
5.86 |
50.47 |
|
|
|
3.18 |
11.29 |
|
|
|
18.47 |
|
|
|
|
|
Ap07(1)_pt21 |
14.29 |
|
48.88 |
0.48 |
|
0.95 |
4.37 |
11.65 |
|
|
|
19.38 |
|
|
|
|
|
Ap07(1)_pt22 |
8.54 |
|
49.55 |
|
|
|
5.11 |
11.73 |
|
|
|
25.07 |
|
|
|
|
|
Ap07(1)_pt23 |
9.00 |
|
47.25 |
|
|
|
4.05 |
14.71 |
|
|
|
24.99 |
|
|
|
|
|
Ap07(1)_pt24 |
5.71 |
|
38.93 |
|
|
|
2.53 |
7.67 |
|
|
|
45.17 |
|
|
|
|
|
Ap07(1)_pt25 |
26.18 |
8.68 |
44.97 |
|
0.85 |
|
1.93 |
6.56 |
|
|
|
10.82 |
|
|
|
|
|
Tab. 2.8. The results of the Ap 08 sample microanalysis
Sample |
C |
N |
O |
F |
Na |
Mg |
Al |
Si |
S |
K |
Ca |
Ti |
V |
Fe |
Ap08(1)_pt1 |
3.62 |
|
28.03 |
|
|
|
1.09 |
2.33 |
|
|
1.46 |
7.50 |
1.02 |
54.94 |
Ap08(1)_pt2 |
4.28 |
|
36.21 |
|
|
0.57 |
1.58 |
4.03 |
|
|
1.10 |
24.66 |
|
27.58 |
Ap08(1)_pt3 |
15.18 |
|
34.81 |
|
|
1.37 |
5.12 |
16.42 |
|
1.67 |
13.74 |
|
|
11.70 |
Ap08(1)_pt4 |
7.49 |
|
25.92 |
|
1.31 |
1.37 |
3.07 |
7.15 |
|
|
|
|
|
53.69 |
Ap08(1)_pt5 |
12.98 |
|
41.78 |
|
|
1.83 |
3.25 |
13.97 |
|
|
15.82 |
10.36 |
|
|
Ap08(1)_pt6 |
4.53 |
|
43.11 |
|
1.37 |
4.04 |
6.54 |
18.28 |
|
|
6.69 |
|
|
15.43 |
Ap08(1)_pt7 |
15.85 |
3.48 |
38.94 |
|
0.64 |
1.37 |
5.69 |
7.79 |
|
|
2.97 |
|
|
23.28 |
Ap08(1)_pt8 |
6.61 |
|
30.45 |
|
0.76 |
|
1.70 |
4.01 |
|
|
1.29 |
|
|
55.18 |
Ap08(1)_pt9 |
11.93 |
|
48.12 |
|
1.18 |
0.48 |
4.90 |
28.76 |
|
|
4.63 |
|
|
|
Ap08(1)_pt10 |
24.56 |
|
43.11 |
1.35 |
1.47 |
2.03 |
5.43 |
14.35 |
|
1.81 |
5.89 |
|
|
|
Ap08(1)_pt11 |
6.62 |
|
42.79 |
|
7.81 |
|
13.34 |
17.94 |
|
4.28 |
4.10 |
|
|
3.13 |
Ap08(1)_pt12 |
37.28 |
8.27 |
41.44 |
|
0.77 |
0.50 |
2.45 |
6.46 |
|
|
2.84 |
|
|
|
Ap08(1)_pt13 |
6.78 |
|
20.15 |
|
|
1.41 |
1.96 |
5.37 |
|
|
2.04 |
|
|
62.30 |
Ap08(1)_pt14 |
17.47 |
|
48.21 |
|
1.13 |
1.64 |
4.52 |
12.18 |
|
|
10.24 |
|
|
4.62 |
Ap08(1)_pt15 |
8.78 |
|
43.68 |
1.43 |
1.02 |
1.54 |
8.67 |
12.53 |
|
|
22.35 |
|
|
|
Ap08(1)_pt16 |
21.88 |
|
46.99 |
|
|
|
2.86 |
11.52 |
|
|
5.87 |
|
|
10.88 |
Ap08(1)_pt17 |
19.91 |
|
44.32 |
|
1.36 |
1.36 |
4.34 |
15.29 |
|
|
13.43 |
|
|
|
Ap08(1)_pt18 |
16.23 |
3.82 |
32.84 |
|
|
1.19 |
4.70 |
21.44 |
|
|
19.79 |
|
|
|
Ap08(1)_pt19 |
26.40 |
|
47.76 |
|
1.95 |
1.01 |
3.86 |
13.61 |
0.49 |
|
4.92 |
|
|
|
Ap08(1)_pt20 |
20.16 |
|
47.08 |
|
1.80 |
1.92 |
5.49 |
14.47 |
|
3.07 |
6.01 |
|
|
|
Ap08(1)_pt21 |
17.42 |
|
45.05 |
|
0.83 |
1.77 |
4.74 |
13.34 |
|
|
9.76 |
|
|
7.09 |
Ap08(1)_pt22 |
15.65 |
|
39.53 |
|
2.75 |
1.81 |
4.87 |
16.26 |
|
|
3.12 |
|
|
16.03 |
Ap08(1)_pt23 |
11.13 |
|
41.51 |
|
|
|
4.13 |
17.34 |
|
7.48 |
18.41 |
|
|
|
Ap08(1)_pt24 |
6.93 |
|
43.81 |
|
|
1.37 |
3.20 |
12.30 |
|
0.88 |
31.51 |
|
|
|
Ap08(1)_pt25 |
8.89 |
|
30.31 |
|
0.84 |
0.87 |
3.03 |
9.37 |
|
|
5.34 |
34.81 |
|
6.54 |
66
Tab. 2.9. The results of the Ap 09 sample microanalysis
Sample |
C |
O |
Na |
Mg |
Al |
Si |
S |
K |
Ca |
Pb |
Ap09(1)_pt1 |
4.45 |
44.41 |
0.61 |
0.79 |
1.38 |
19.79 |
|
0.89 |
27.69 |
|
Ap09(1)_pt2 |
5.94 |
52.69 |
0.48 |
0.73 |
|
10.50 |
1.06 |
|
28.61 |
|
Ap09(1)_pt3 |
6.16 |
51.28 |
0.50 |
0.82 |
0.83 |
21.41 |
|
|
19.00 |
|
Ap09(1)_pt4 |
5.35 |
53.21 |
|
0.72 |
0.51 |
20.08 |
|
|
20.12 |
|
Ap09(1)_pt5 |
5.51 |
52.01 |
0.46 |
0.71 |
0.51 |
18.79 |
|
|
22.02 |
|
Ap09(1)_pt6 |
5.07 |
49.96 |
|
0.77 |
0.88 |
24.44 |
|
1.11 |
17.77 |
|
Ap09(1)_pt7 |
6.27 |
55.74 |
|
0.79 |
0.72 |
12.22 |
0.68 |
|
23.58 |
|
Ap09(1)_pt8 |
6.25 |
56.89 |
|
|
|
17.13 |
|
|
19.72 |
|
Ap09(1)_pt9 |
6.02 |
50.95 |
0.60 |
0.91 |
0.53 |
24.96 |
|
|
16.03 |
|
Ap09(1)_pt10 |
6.32 |
52.60 |
0.55 |
0.99 |
|
20.47 |
0.78 |
|
18.30 |
|
Ap09(1)_pt11 |
4.81 |
48.52 |
|
|
|
21.36 |
0.83 |
|
24.48 |
|
Ap09(1)_pt12 |
5.08 |
41.77 |
|
0.55 |
0.85 |
23.39 |
|
|
28.35 |
|
Ap09(1)_pt13 |
4.47 |
44.46 |
|
0.53 |
0.89 |
16.31 |
0.83 |
|
31.55 |
0.96 |
Ap09(1)_pt14 |
6.13 |
54.29 |
0.61 |
0.64 |
1.12 |
20.22 |
|
0.88 |
16.12 |
|
Ap09(1)_pt15 |
5.24 |
53.29 |
|
0.78 |
0.50 |
18.56 |
0.84 |
|
20.79 |
|
Ap09(1)_pt16 |
5.80 |
55.74 |
|
0.72 |
|
13.16 |
|
|
24.58 |
|
Ap09(1)_pt17 |
4.87 |
50.02 |
|
0.66 |
0.32 |
18.64 |
|
|
25.49 |
|
Ap09(1)_pt18 |
4.92 |
46.75 |
|
0.61 |
0.89 |
25.35 |
0.83 |
|
20.65 |
|
Ap09(1)_pt19 |
5.19 |
52.79 |
|
0.95 |
|
20.26 |
1.03 |
|
19.77 |
|
Ap09(1)_pt20 |
6.39 |
46.77 |
|
0.93 |
|
19.56 |
|
|
26.36 |
|
Ap09(1)_pt21 |
6.76 |
55.53 |
|
0.69 |
0.60 |
9.87 |
1.03 |
|
25.51 |
|
Ap09(1)_pt22 |
4.10 |
50.84 |
0.61 |
0.81 |
0.66 |
35.43 |
0.47 |
|
7.07 |
|
Ap09(1)_pt23 |
6.17 |
49.49 |
|
1.08 |
|
17.97 |
|
|
25.29 |
|
Ap09(1)_pt24 |
4.72 |
44.74 |
|
0.94 |
0.97 |
13.57 |
|
|
35.07 |
|
Ap09(1)_pt25 |
5.80 |
45.74 |
|
|
1.13 |
13.96 |
0.93 |
|
32.45 |
|
Tab. 2.10. The results of the Ap 10 sample microanalysis
Sample |
C |
N |
O |
F |
Na |
Mg |
Al |
Si |
S |
K |
Ca |
Fe |
Ap10(1)_pt1 |
5.03 |
|
52.02 |
|
|
1.03 |
2.58 |
10.28 |
|
|
29.07 |
|
Ap10(1)_pt2 |
2.93 |
|
36.40 |
|
|
0.69 |
1.64 |
7.36 |
|
|
50.99 |
|
Ap10(1)_pt3 |
6.91 |
|
51.42 |
|
|
|
1.90 |
22.49 |
|
|
17.27 |
|
Ap10(1)_pt4 |
7.10 |
|
50.82 |
|
|
|
2.78 |
19.84 |
|
|
19.44 |
|
Ap10(1)_pt5 |
7.64 |
|
56.69 |
|
0.57 |
0.90 |
1.24 |
5.55 |
|
|
27.41 |
|
Ap10(1)_pt6 |
8.73 |
|
49.25 |
|
0.62 |
1.00 |
4.72 |
16.07 |
|
4.04 |
15.57 |
|
Ap10(1)_pt7 |
5.18 |
|
47.72 |
|
|
|
2.36 |
17.91 |
|
|
26.83 |
|
Ap10(1)_pt8 |
5.20 |
|
51.82 |
|
1.55 |
1.11 |
4.08 |
29.91 |
|
|
6.32 |
|
Ap10(1)_pt9 |
5.24 |
|
48.17 |
|
|
0.95 |
1.15 |
8.48 |
|
1.12 |
34.90 |
|
Ap10(1)_pt10 |
5.82 |
|
50.72 |
|
|
0.91 |
1.70 |
8.06 |
|
|
32.79 |
|
Ap10(1)_pt11 |
8.83 |
|
51.84 |
|
|
|
2.64 |
23.33 |
|
|
13.36 |
|
Ap10(1)_pt12 |
28.90 |
10.37 |
42.42 |
|
0.98 |
|
1.38 |
10.69 |
0.89 |
|
4.36 |
|
Ap10(1)_pt13 |
30.00 |
7.74 |
46.78 |
|
|
|
1.24 |
11.14 |
0.82 |
|
2.29 |
|
Ap10(1)_pt14 |
3.87 |
|
40.41 |
|
|
|
1.31 |
18.63 |
|
|
5.84 |
29.92 |
Ap10(1)_pt15 |
7.80 |
|
53.30 |
|
|
0.93 |
1.58 |
16.65 |
|
0.63 |
19.12 |
|
Ap10(1)_pt16 |
1.79 |
|
42.88 |
|
|
4.21 |
4.26 |
19.27 |
|
|
27.60 |
|
Ap10(1)_pt17 |
4.06 |
|
54.22 |
|
|
0.68 |
1.10 |
35.54 |
|
|
4.40 |
|
Ap10(1)_pt18 |
12.53 |
|
49.63 |
|
|
|
3.92 |
21.00 |
|
|
12.93 |
|
Ap10(1)_pt19 |
4.08 |
|
50.00 |
0.33 |
0.44 |
1.06 |
3.69 |
35.52 |
|
1.07 |
3.82 |
|
|
|
|
|
|
|
|
|
|
|
|
|
|
Ap10(1)_pt20 |
10.26 |
|
47.47 |
|
|
|
3.77 |
18.57 |
|
|
19.94 |
|
Ap10(1)_pt21 |
8.22 |
|
48.66 |
|
|
|
3.67 |
14.54 |
|
|
24.91 |
|
Ap10(1)_pt22 |
10.31 |
|
52.79 |
|
|
|
|
24.06 |
|
|
12.84 |
|
Ap10(1)_pt23 |
3.95 |
|
38.38 |
|
|
1.03 |
1.52 |
8.60 |
|
|
46.53 |
|
Ap10(1)_pt24 |
5.53 |
|
46.84 |
|
0.97 |
0.94 |
1.33 |
27.15 |
|
1.12 |
16.12 |
|
Ap10(1)_pt25 |
4.97 |
|
42.47 |
|
0.58 |
2.30 |
4.34 |
15.54 |
|
0.78 |
16.03 |
12.98 |
67
Tab. 2.11. The results of the Ap 11 sample microanalysis
Sample |
C |
O |
F |
Na |
Mg |
Al |
Si |
P |
S |
K |
Ca |
Ti |
Fe |
Zn |
Br |
Ap11(1)_pt1 |
7.30 |
17.67 |
|
|
|
1.24 |
2.08 |
|
14.18 |
|
9.36 |
|
|
48.17 |
|
Ap11(1)_pt2 |
9.13 |
20.22 |
0.30 |
|
|
1.59 |
2.69 |
|
14.01 |
|
7.42 |
|
|
44.64 |
|
Ap11(1)_pt3 |
7.81 |
14.22 |
|
|
|
1.37 |
1.48 |
|
16.38 |
|
7.60 |
|
|
51.14 |
|
Ap11(1)_pt4 |
4.62 |
36.33 |
|
|
|
2.02 |
2.77 |
|
|
|
47.41 |
|
|
6.85 |
|
Ap11(1)_pt5 |
6.36 |
45.11 |
1.08 |
|
0.40 |
1.80 |
3.51 |
|
|
|
25.95 |
|
|
15.78 |
|
Ap11(1)_pt6 |
5.89 |
45.57 |
|
|
0.52 |
1.39 |
1.98 |
|
0.50 |
|
39.77 |
|
|
4.38 |
|
Ap11(1)_pt7 |
7.30 |
37.13 |
|
|
0.90 |
2.23 |
7.41 |
|
3.79 |
|
11.14 |
|
|
30.09 |
|
Ap11(1)_pt8 |
6.64 |
28.29 |
1.12 |
|
0.70 |
3.62 |
2.91 |
|
1.73 |
|
12.42 |
|
|
42.57 |
|
Ap11(1)_pt9 |
4.33 |
38.01 |
0.38 |
|
|
1.99 |
3.43 |
|
|
|
44.08 |
|
|
7.78 |
|
Ap11(1)_pt10 |
6.37 |
38.52 |
|
|
0.70 |
2.63 |
4.43 |
|
|
|
29.73 |
|
|
17.62 |
|
Ap11(1)_pt11 |
11.19 |
51.67 |
|
|
0.42 |
1.57 |
3.07 |
|
|
|
28.14 |
|
|
3.95 |
|
Ap11(1)_pt12 |
6.55 |
52.14 |
|
2.98 |
|
4.16 |
8.45 |
|
|
|
25.72 |
|
|
|
|
Ap11(1)_pt13 |
9.92 |
48.96 |
|
|
|
|
5.97 |
|
|
|
25.51 |
|
|
|
9.64 |
Ap11(1)_pt14 |
7.94 |
41.57 |
|
|
|
|
2.38 |
|
|
|
25.47 |
|
|
19.89 |
2.76 |
Ap11(1)_pt15 |
5.49 |
46.07 |
|
3.00 |
1.31 |
10.74 |
16.66 |
|
|
1.62 |
9.19 |
|
5.92 |
|
|
|
|
|
|
|
|
|
|
|
|
|
|
|
|
|
|
Ap11(1)_pt16 |
5.35 |
46.68 |
|
|
|
3.45 |
10.76 |
1.51 |
|
|
28.39 |
2.22 |
|
|
|
Ap11(1)_pt17 |
4.46 |
45.70 |
|
1.88 |
3.78 |
4.24 |
16.47 |
|
|
|
10.05 |
|
13.41 |
|
|
Ap11(1)_pt18 |
11.54 |
43.46 |
0.00 |
|
0.35 |
1.47 |
2.33 |
|
0.83 |
|
25.18 |
|
|
14.84 |
|
Ap11(1)_pt19 |
10.55 |
52.59 |
|
|
0.46 |
5.81 |
6.95 |
|
|
2.28 |
17.10 |
|
|
4.26 |
|
Ap11(1)_pt20 |
6.98 |
47.49 |
|
|
1.09 |
2.60 |
4.62 |
|
0.92 |
|
36.29 |
|
|
|
|
Ap11(1)_pt21 |
5.51 |
36.52 |
|
|
|
2.39 |
4.03 |
|
1.71 |
|
36.86 |
|
|
12.98 |
|
Ap11(1)_pt22 |
10.02 |
36.89 |
0.50 |
|
0.67 |
2.07 |
4.04 |
|
4.78 |
|
17.35 |
|
|
23.67 |
|
Ap11(1)_pt23 |
6.73 |
47.93 |
|
|
|
1.34 |
2.66 |
|
|
|
36.55 |
|
|
4.79 |
|
Ap11(1)_pt24 |
5.55 |
42.41 |
|
|
|
1.73 |
2.30 |
|
|
|
43.19 |
|
|
4.83 |
|
Ap11(1)_pt25 |
7.52 |
55.23 |
|
|
|
1.34 |
1.90 |
|
|
|
34.02 |
|
|
|
|
Tab. 2.12. The results of the Ap 12 sample microanalysis
Sample |
C |
N |
O |
F |
Na |
Mg |
Al |
Si |
P |
K |
Ca |
Ti |
Fe |
Br |
Ap12(1)_pt1 |
14.39 |
|
44.96 |
|
|
1.33 |
15.32 |
19.30 |
|
|
4.71 |
|
|
|
Ap12(1)_pt2 |
11.85 |
|
44.30 |
|
|
1.42 |
15.14 |
17.91 |
|
2.76 |
6.62 |
|
|
|
Ap12(1)_pt3 |
35.21 |
7.61 |
42.61 |
|
|
0.48 |
4.87 |
5.92 |
|
|
3.29 |
|
|
|
Ap12(1)_pt4 |
13.22 |
|
40.84 |
|
|
|
23.45 |
18.09 |
|
|
4.41 |
|
|
|
Ap12(1)_pt5 |
4.05 |
|
38.34 |
|
3.46 |
0.88 |
|
22.51 |
|
|
|
5.16 |
16.71 |
8.90 |
Ap12(1)_pt6 |
4.03 |
|
51.96 |
1.84 |
1.42 |
1.30 |
14.02 |
24.23 |
|
|
1.21 |
|
|
|
Ap12(1)_pt7 |
5.41 |
|
51.75 |
1.25 |
0.79 |
1.06 |
7.36 |
22.19 |
|
1.18 |
9.03 |
|
|
|
Ap12(1)_pt8 |
9.12 |
|
48.32 |
|
1.31 |
|
9.38 |
21.78 |
|
3.46 |
6.62 |
|
|
|
Ap12(1)_pt9 |
10.17 |
|
50.07 |
|
1.61 |
1.50 |
8.33 |
22.11 |
|
6.20 |
|
|
|
|
Ap12(1)_pt10 |
12.87 |
|
52.43 |
|
|
1.17 |
11.33 |
22.20 |
|
|
|
|
|
|
Ap12(1)_pt11 |
11.27 |
|
45.62 |
|
1.46 |
1.53 |
8.32 |
20.97 |
|
|
10.83 |
|
|
|
Ap12(1)_pt12 |
12.51 |
|
49.42 |
1.98 |
1.92 |
1.21 |
10.79 |
22.17 |
|
|
|
|
|
|
Ap12(1)_pt13 |
6.63 |
|
41.12 |
|
3.39 |
1.79 |
10.58 |
20.76 |
|
2.95 |
6.20 |
|
6.59 |
|
Ap12(1)_pt14 |
8.49 |
|
48.82 |
|
|
1.35 |
8.70 |
18.65 |
|
4.64 |
9.35 |
|
|
|
Ap12(1)_pt15 |
12.36 |
|
50.02 |
|
|
1.33 |
9.42 |
21.05 |
|
|
5.81 |
|
|
|
Ap12(1)_pt16 |
3.48 |
|
39.25 |
|
|
6.61 |
9.19 |
19.66 |
|
5.87 |
|
|
15.94 |
|
Ap12(1)_pt17 |
26.60 |
|
46.85 |
|
|
|
5.67 |
12.91 |
1.57 |
|
6.39 |
|
|
|
Ap12(1)_pt18 |
11.80 |
|
47.06 |
|
1.95 |
|
8.25 |
21.64 |
|
|
6.11 |
|
3.19 |
|
Ap12(1)_pt19 |
16.10 |
|
48.79 |
|
|
0.94 |
11.65 |
22.53 |
|
|
|
|
|
|
Ap12(1)_pt20 |
19.41 |
|
43.66 |
|
0.84 |
2.19 |
5.89 |
14.34 |
|
0.84 |
3.97 |
|
8.85 |
|
Ap12(1)_pt21 |
6.14 |
|
49.69 |
|
4.62 |
|
10.32 |
23.42 |
|
|
4.73 |
1.08 |
|
|
Ap12(1)_pt22 |
12.61 |
|
45.70 |
|
|
2.11 |
10.07 |
20.12 |
|
4.79 |
4.58 |
|
|
|
Ap12(1)_pt23 |
34.43 |
|
44.17 |
0.89 |
1.12 |
0.95 |
4.39 |
10.41 |
|
1.11 |
2.52 |
|
|
|
Ap12(1)_pt24 |
6.09 |
|
47.73 |
1.73 |
1.96 |
4.78 |
4.44 |
21.27 |
|
|
12.00 |
|
|
|
Ap12(1)_pt25 |
5.10 |
|
36.82 |
|
|
0.87 |
4.99 |
10.88 |
|
2.43 |
2.11 |
6.69 |
30.11 |
|
Ap12(1)_pt26 |
11.42 |
|
50.66 |
|
|
|
11.82 |
20.92 |
|
|
5.19 |
|
|
|
Ap12(1)_pt27 |
10.51 |
|
43.94 |
|
1.32 |
1.53 |
11.94 |
23.46 |
|
|
7.31 |
|
|
|
Ap12(1)_pt28 |
12.28 |
|
46.00 |
|
0.93 |
1.89 |
14.55 |
19.97 |
|
|
4.38 |
|
|
|
Ap12(1)_pt29 |
19.43 |
|
48.96 |
|
1.00 |
2.70 |
5.41 |
15.72 |
|
3.10 |
3.67 |
|
|
|
68
3. Oleniegorsk
3.1. Introduction
Oleniegorsk is located in the central part of the northern part of the peninsula, on the way to Murmansk. The city is located on the railway and road. But its history is closely connected with the creation of the station “Olenia” in 1916 when building a railway line [26]. Much of this station has grown with the construction of processing plants in nearby Monchegorsk, followed by discovery near the iron line and construction of mining plants. This resulted in the need to build a mining estate, which over time overturned the town. It received city rights in 1957 [26]. The centre of the city centre is preserved in neoclassical style. There are beautiful avenues, squares, buildings that have the characteristic momentum of this period. Around this building there are numerous large-scale buildings, which today are surrounded by counting 23ty inhabitants of the city. Oleniegorsk location in the northern part of the peninsula makes the climate a bit sharper compared to Murmansk, though it is certainly milder than the Apatite. Probably the January temperatures range between –12°C and July +14°C (the extrapolation of Apatity and Murmansk data).
3.2. Preparirate samples to test
During the fieldwork an inventory of the behavior of plasters and photographic documentation was made. Downloaded plaster samples were taken and then examined by optical microscope and scanning electron microscope (fig. 3.7). Subsequently these samples were examined with ICP-OAS and ASA. The results of these analyzes were processed by mathematical software.
3.3. Results
Field research carried out in Oleniegorsk has shown that especially the strict center with the oldest buildings has its own unique style and climate. The townhouses in question have nice facades, are built with attention to detail, designed squares and alleys have aesthetic character, bringing harmony to the city. This build contrasts with newer blocks that are more eclectic, have no ornamentation and their appearance is standard in the former USSR, unifying the building into one type (fig. 3.5) [3, 14, 16]. They are set up in the same characteristic complexes as in other cities of the region. Today, the city landscape is grayed with insufficient thermal insulation. Unfortunately, the state of preservation of buildings in Oleniegorsk indicates that the best times for this city have passed. Perhaps in the near future it will change, but today, the oldest buildings are often shabby, with only temporary improvements, with apparent damage to the arctic climate. Even worse are the stilted blockhouses, which may
69
be in better technical condition than brick buildings, but their view does not add to the charm of the city.
Microscopic studies have shown a variety of plaster samples. Mineral ornaments were identified in samples 01, 03, 04, 06, 08, 09, 11–14 and in specimen 07 fragments of slag, and paint (samples 06 and 14 red, Figure 3.6). In addition, solid impurities (samples 01–04, 09, 10) and metallic dust were found (samples 01–03, 07, 08–11, 13, 14). In samples 03, 08 were visible plants (algae, moss). In addition, samples of paint 02, 05, 06 were spotted. Barite precursors (sample 02) and carbonate (sample 10) were also identified.
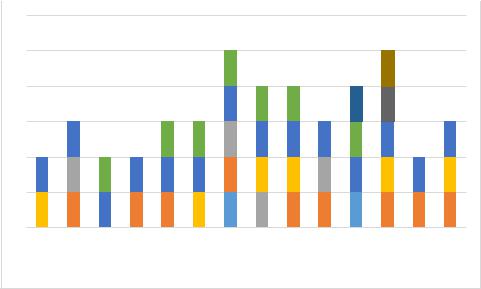
Microelectrode experiments using the EDS have shown that a high content of carbon compounds was found in samples 07 and 11. In addition, the sulfur compounds (in samples 02, 04.05, 7.09, 10.12, 13), chlorine , 07.08, 10) and phosphorus (in samples 01.06,08,09,12). The following metals were also found: iron (all samples), titanium (samples 03, 05-09 and 11), zinc (sample 11), and dopants V (sample 02) and Ir, Tb (sample 12). Studies on cumulated pollutants (Figure 3.1) show that most of them are found in samples 07 and 12 respectively from the intersection of 7 Parkova St, crossing of Molodiezhnyi Bul and Vostochnaya. In addition, relatively large amounts of contaminants were found in samples 08, 09, and 11, respectively, from 3 Parkova St, 46 Soviecka St, 13 Stroiteln St (fig 3.8, tab 3.1–3.14).
6
5
4
3
2
1
0
Ole01 Ole02 Ole03 Ole04 Ole05 Ole06 Ole07 Ole08 Ole09 Ole10 Ole11 Ole12 Ole13 Ole14
 C
C  S
S  Cl
Cl  P
P  Fe
Fe  Ti
Ti  Zn
Zn  V
V  Ir
Ir  Tb
Tb
Fig. 3.1. Compilation of types of pollutants in the tested plaster samples from Oleniegorska
Geochemical investigations of plaster samples using ICP-OAS and ASA showed some variation (fig. 3.2). Analyzes of the dopants of metals allow to determine their distribution in the studied regions of the city. In the case of zinc the highest contents were found in samples 08 and 14 where they reached the value of 300 ppm. These samples were taken from the neighborhood of
70