

IELTS_Writing (3)
.pdfAcademic IELTS Writing |
Alireza Ramedani |
Tips
It is not important whether you use American or British English when you write. However, you most keep your language consistent.
The bar chart compares the number of incidents and injuries for every 100 million passenger miles travelled on five different types of public transport in 2002.
It is clear that the most incidents and injuries took place on demand-response vehicles. By contrast, commuter rail services recorded by far the lowest figures.
A total of 225 incidents and 173 injuries, per 100 million passenger miles travelled, took place on demand-response transport services. These figures were nearly three times as high as those for the second highest category, bus services. There were 76 incidents and 66 people were injured on buses.
Rail services experienced fewer problems. The number of incidents on light rail trains equalled the figure recorded for buses, but there were significantly fewer injuries, at only 39. Heavy rail services saw lower numbers of such events than light rail services, but commuter rail passengers were even less likely to experience problems. In fact, only 20 incidents and 17 injuries occurred on commuter trains.
(165 words, band 9)
Exercise 1.5.2
Now try to fill in the blanks using the information given in the box.
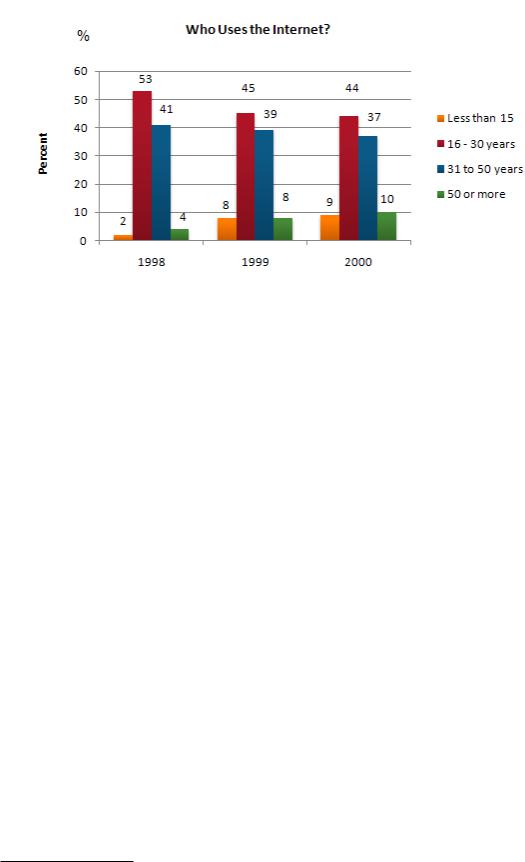
The graph shows Internet Usage in Taiwan by Age Group, 1998-2000.
1998 |
45% |
30 |
1999 |
8% |
half of |
37% |
2000 |
Summarize the information by selecting and reporting the main features, and make comparisons where relevant.
36
Graphs, charts, and tables
•You should write at least 150 words.
•You should spend about 20 minutes on this task.
model answer:
The graph shows changes in the age profile of Internet users in Taiwan between ..........
and ........... .
The main users of the Internet in Taiwan were young adults between 16 and ..........
years old. In 1998, they accounted for more than .......... |
all users. In 1999 the number |
|
dropped slightly to .......... |
, but even in 2000 they were the biggest group. |
|
The second biggest group of users was aged between 31 and 50. They made up 41% in 1998, falling slightly to ........... in 2000. When combined with the 16-30 age group, over 94% of users in 1998 were between 16 and 50. However, this number dropped
steadily as more children and older users logged on. In ........... |
, the number of children |
|
online quadrupled2 from 2% to .......... |
, and it continued to increase in 2000. There were |
|
similar increases for older users, rising from 4% in 1998 to 10% in 2000.
In summary, while adults between 16 and 50 represent the great majority of Internet users in Taiwan, their share was declining as more children and older users joined the web.
Exercise 1.5.3
Reorder the words in italics in the model text below.
2 increased four times
37
Academic IELTS Writing |
Alireza Ramedani |
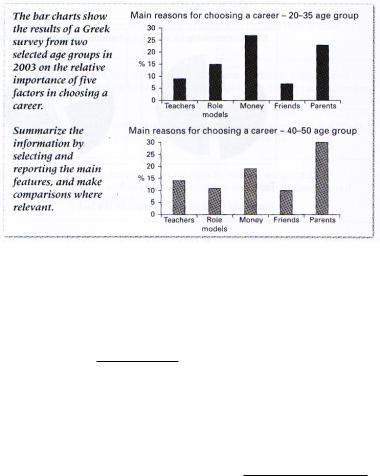
Te bar charts provide informaton fom a Greek survey about reasons/te/for/main/ career/a/choosing among two age groups.
It is clear tat te two groups te/influenced/ were/various/by/factrs t di erent degrees, wit te most influental factrs which contibutd t career choice for te 20-25 age group being money (approximatly 27%) and ten parents (23%). However, te factrs te/ age/were/for/reverse/group/the/40-50,with parents a ectng tem most at 30 percent.
Answer the following questions:
Teachers/as/regards/role/and/models, te relatve importance of each was again te oter way around. Nine/fiften/and/ respectively/group/percent/for/younger/the, and fourten and eleven per cent for te older.
similarity/only/the/the/two/groups/between/ age was tat fiends had less influence over career choice for te older and younger groups factrs/tan/any/oter, seven and tn percent respectvely.
1‘It is clear that’ is a stock phrase. What other substitute can you suggest for it?
2What does ‘the other way around’ mean?
3What does the word ‘contribute’ mean?
4What about “as regards”? What other synonyms do you know for it?
Repetition! Is it a crime?
Students often worry about repeating the same words in writing task 1. No! Repeating a key word or phrase a few times is not a problem; sometimes it is necessary to show that you are consistently talking about the same thing. If you try to use too much variety, there is a danger that you will confuse the reader or write something that does not mean what you want it to mean.
It's fine to either repeat the key words or make small changes. Look at these examples of small changes which can be made to the phrase average weekly spending:
•spent on average
38
Graphs, charts, and tables
•average expenditure
•weekly spending figures
•levels of spending
•spent per week
•expenditure per week
Exercise 1.5.4
Write a good introduction and body paragraph for this graph.
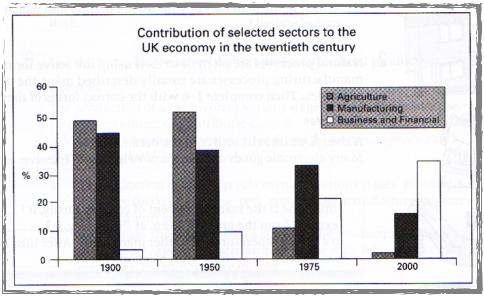
The graph below shows the contribution of three sectorsagriculture, manufacturing, and business and financial servicesto the Uk economy in the twentieth century.
39
Academic IELTS Writing |
Alireza Ramedani |
Unit 6
How to write a good overview paragraph
Remember that you do not need to write a conclusion for IELTS writing task 1. You can write an "overview" of the information. An overview is the most important message a graph tries to convey. In fact, it is a description of the most important fact(s) in your report. Generally, trends and correlations are the best indicators of your overview. Sometimes some writers prefer to write the overview immediately after the introduction in a separate paragraph.
But why do not you need to write a conclusion? What's the difference between a conclusion and an overview?
First, a conclusion is really a final judgement, decision or opinion. This is perfect for the task 2 essay, but task 1 asks you to write a description without analysis or opinions. On the other hand, an "overview" is a simple description of the main points. It is a summary of the information shown in the graph or chart.
Second, a conclusion should be at the end of a piece of writing. An overview or general summary could go either at the end or near the beginning. Admittedly, it's a good idea to describe the main features of the graph or chart near the beginning of your essay.
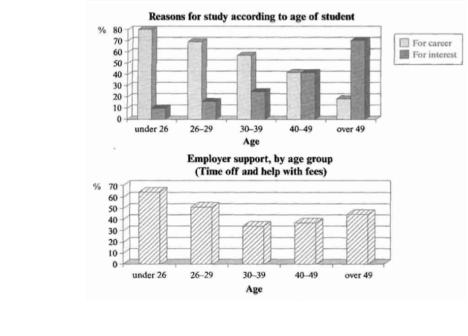
Look at the following graph and its overview:
It is clear that the proportion of people who study for career purposes is far higher among the younger age groups, and decreases steadily with age. The need for employer support also decreases with age, but only up to the point when employees enter their forties.
40
Graphs, charts, and tables
Trend
We have two trends: upward and downward
There was an upward trend over the period.
There was a downward trend over th e period.
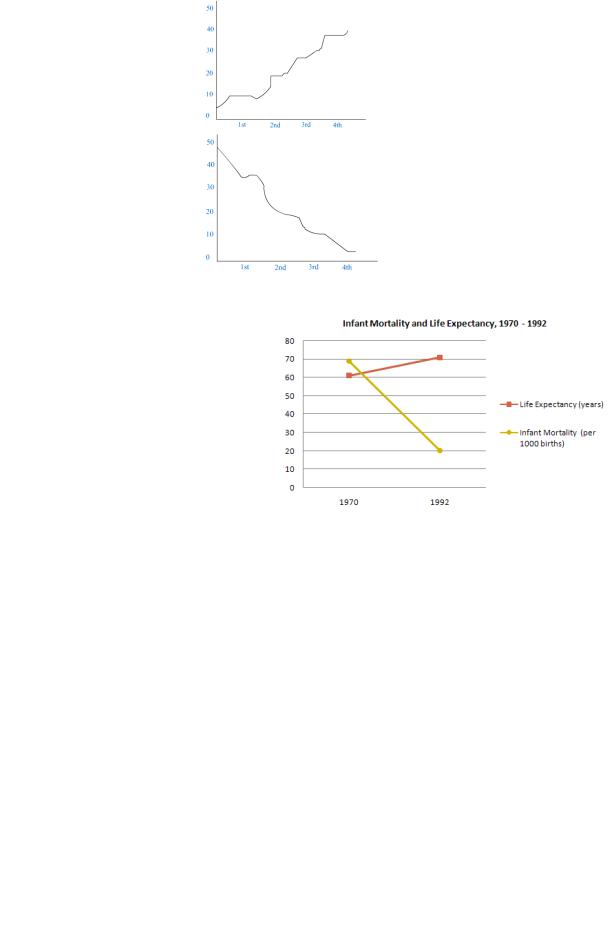
Now look at this example
Look at life expectance in the graph above. We can see that the figure in 1970 stood at 60 and 22 years later it rose to 70. There is an upward trend for life expectancy. Now take a look at the other variableinfant mortality. In 1970, the figure was 70 per 1000 births. It then declined to 20. There is a downward trend here.
Let us now review some important points again:
•An overview is simply a summary of the main things you can see.
•Because the overview is so important, I recommend putting it at the beginning of your essay, just after the introduction sentence.
•I write two overview sentences. A one-sentence overview is not really enough.
•Try not to include specific numbers in the overview. Save the specifics for later paragraphs.
•Look at the 'big picture' e.g. the overall change from the first year to the last year (if years are shown on the chart), the differences between whole categories rather than single numbers, or the total number of stages in a process.
41
Academic IELTS Writing
Exercise 1.6
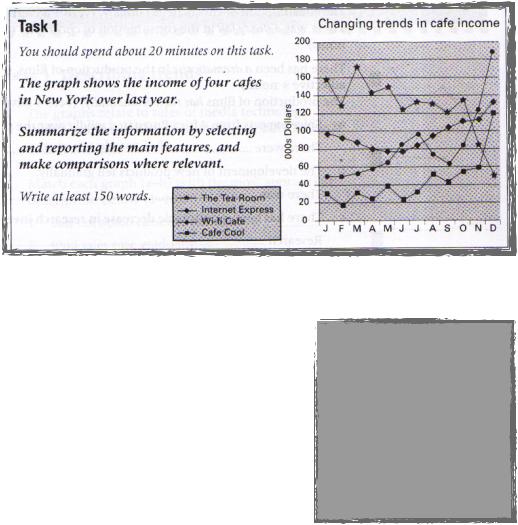
Te graph provides informaton about te income tends of four cafes over te last year.
Tere are two basic general tends: downward and upwards . As regards te first, te earnings for Te Tea room were down over te year, faling ....1...... fom almost 160,000 earnings a mont t just under $50,000 in December.
By contast, te income for te oter tree cafes went up by varying degrees. Tere was .....2..... in Cafe Cool’s sales over te first tn monts, folowed by a sudden increase t $120,000. Furtermore, te income
Alireza Ramedani
match options a-g with gaps 1-7 in the model text.
asteadily
bthen rocketed
cdoubled
dsignificantly
ealso ended the year up
fa steady fall
ga rise
for bot Intrnet Express and Wi-Fi Cafe .....3..... in
December. Te former experienced ....5...... t June, but aftr tat, income rose .....4..... ending te year at approximatly $130,000. Likewise, te tend for Wi-fi was upward. Between January t
July, earnings .....6..... fom $50,000 t $100,000 and .....7..... t around $190,000.
It is notceable tat te income for Te Tea Room is lower in te wintr monts tan for oter tree cafes.
Correlation"
What is a correlation? A correlation is a relationship between two things, two variables. For example, it is generally true that the more junk food you eat, the fatter you get. This is a positive correlation- there is a strong relationship.
A negative correlation means that there is a strong relationship between two variables, but in the opposite direction. For example, the older a second-hand car is, the lower the price.
Zero correlation happens when there is a strong relationship between two thingswhen they do not affect each other. For example, the number of times you go to the movies a year is probably not related to the number of brothers and sisters you have ...
or is it?
42
Graphs, charts, and tables
Unit 7
Tables
Tables seem difficult when they contain a lot of numbers. Here's some advice:
•Try to write 4 paragraphs - introduction, summary of main points, 2 detail paragraphs.
•Before you start writing, highlight some key numbers. Choose the biggest number in each category in the table (i.e. in each column and row). If the table shows years, look for the biggest changes in numbers over the time period. You could also mention the smallest numbers, but you can ignore 'middle' numbers (neither biggest nor smallest).
•For your summary paragraph, try to compare whole categories (columns or rows) rather than individual 'cells' in the table. If you can't compare whole categories, compare the biggest and smallest number. Write 2 sentences for the summary.
•In your two 'details' paragraphs, never describe each category (column or row) separately. The examiner wants to see comparisons. Try to organize the numbers you highlighted into 2 groups - one for each paragraph (e.g. highest numbers for all categories together, and lowest numbers together).
•Describe / compare the numbers you highlighted - include at least 3 numbers in each paragraph.
•Use the past simple for past years, and 'will' or 'is expected/predicted to' for future years. If no time is shown, use the present simple.
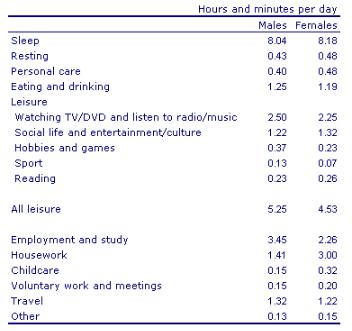
The chart below shows average hours and minutes spent by UK males and females on different daily activities.
43
Academic IELTS Writing |
Alireza Ramedani |
Exercise 1.7
FIll in the blanks using the given words
doing, up, over, spent, while, sleeping, sleep, twice, amount, takes
The table compares the average ______ of time per day that men and women in the UK spend ______ different activities.
It is clear that people in the UK spend more time ______ than doing any other daily activity. Also, there are significant differences between the time ______ by men and women on employment/study and housework.
On average, men and women in the UK ______ for about 8 hours per day. Leisure
______ ______ the second largest proportion of their time. Men spend 5 hours and 25 minutes doing various leisure activities, such as watching TV or doing sport, ______
women have 4 hours and 53 minutes of leisure time.
It is noticeable that men work or study for an average of 79 minutes more than women every day. By contrast, women spend 79 minutes more than men doing housework, and they spend ______ ______ as much time looking after children.
My thinking steps
Example 1
I am going to explain my thinking process when I answer an IELTS Writing Task 1 question. We will use this question (Cambridge IELTS 7, page 30):
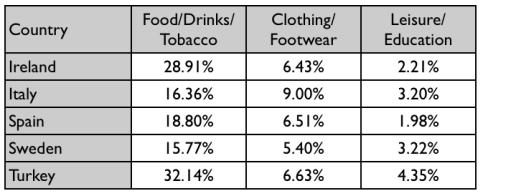
The table below gives information on consumer spending on different items in five different countries in 2002.
Percentage of national consumer expenditure by category - 2002
Before I worry about what language to use, it is really important to understand the information, and decide how to organize it. This is what I'm thinking:
1.I know that I can write a short introduction by paraphrasing the question.
2.I look for an overall trend. I can see that the food/drinks/tobacco category has the highest percentages, and leisure/education has the lowest.
3.Now I want to write two main body paragraphs. I need to select something to say about each country. Remember, there is no rule about what information you select; everyone will do this differently.
44
Graphs, charts, and tables
4.I look for the highest figures in each category: I can see that Turkey has the highest figure for food/drinks/tobacco AND for education/leisure. Italy has the highest figure for clothing/footwear.
5.So, I'll write a paragraph about Turkey and Italy.
6.My final paragraph needs to talk about Ireland, Spain and Sweden.
7.Maybe I'll point out that Ireland has a high figure for the first category, Spain has the lowest figure for education/leisure, and Sweden has the lowest figures for the first AND second categories.
8.I don't need a conclusion because I have already mentioned a general trend in point 2.
Now let us take a closer look at a good report.
Te table shows percentages of consumer expenditure for tree catgories of products and services in five counties in 2002.
It is clear tat te largest proporton of consumer spending in each county went on food, drinks and tbacco. On te oter hand, te leisure/educaton catgory has te lowest percentages in te table.
Out of te five counties, consumer spending on food, drinks and tbacco was notceably higher in Turkey, at 32.14%, and Ireland, at nearly 29%. Te proporton of spending on leisure and educaton was also highest in Turkey, at 4.35%, while expenditure on cloting and footwear was significantly higher in Italy (9%,) tan in any of te oter counties.
It can be seen tat Sweden had te lowest percentages of natonal consumer expenditure for food/drinks/tbacco and for cloting/footwear, at nearly 16% and just over 5% respectvely. Spain had slightly higher figures for tese catgories, but te lowest figure for leisure/educaton, at only 1.98%.
Example 2
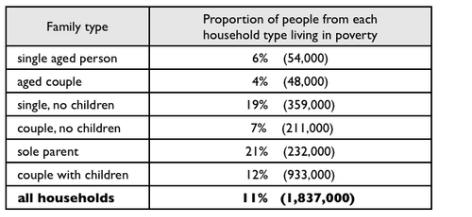
The table below shows the proportion of different categories of families living in poverty in Australia in 1999.
45