

Экономика общественного сектора Учебно-методическое пособие
..pdfPrivatization and nationalization
Privatization is the transfer of state property to private ownership. The government can sell assets to make them more efficient or to receive money (in case of budget deficit). Nationalization is the process of taking a private industry or private assets into public ownership by a national government or state. Nationalization usually refers to private assets, but it may also mean assets owned by lower levels of government, such as municipalities, being transferred to be the state.
The goal of nationalization can be different:
• national security of the country or society's needs. The government controls strategic enterprises and other units in production and social spheres;
•the economic security of the country;
•protection of consumers from abuse, if it isn’t possible to overcome the negative effects of natural monopoly by market methods;
•implementation of structural changes in national economy;
•interdiction of the illicit transfer of profits abroad;
•implementation of the main socio-economic targets set in government programs.
TOPIC 6. PUBLIC FINANCE
Questions for the lectures and the seminars:
The concept and structure of the public finances. The emergence and development of the theories of public finance. The nature and components of the budgetary system. The budget as historical and socio-economic category. Budget theory. The problem of balancing the state budget. Ways of covering the deficit of the state budget.
The term Finance originates from the Latin "finis", i.e. the end. In Medieval Latin it was used to designate the date of payment, and then to refer to documents that prove the debt at the end of the transaction.
Since the end of the XVII century in France and in other countries under the term Finance people began to indicate the totality of the state economy, revenues, expenses and debts of the state.
As shown above, public sector in market economy includes the government with all the diversity of its economic categories and tools (budget, taxes, government spending, state property, state enterprise), the sector of local self-government (local finances, local property, etc.), and the nonprofit sector.
The public finance is the part of the state financial system. These include:
1)public finance (the Federal budget, budgets of regions, the state loan, state extra-budgetary
funds);
2)municipal finance (the local budget, local budgetary funds of the government bodies);
3)finance of the non-profit sector that implements the production of mixed public goods, including various extra-budgetary funds.
Budget system of the Russian Federation includes the following levels:
•the Federal budget and the budgets of state extra-budgetary funds;
•the budgets of Russian regions and the budgets of the territorial state non-budgetary
funds;
• local budgets, including:
a)the budgets of municipal districts, the budgets of city districts and municipalities;
b)the budgets of urban and rural settlements.
Budget
Since the end of the XVII century, the budget became the name of the document that was approved by the Parliament and represented the plan of revenues and expenditures of the state.
In the Middle ages, the resources of the state and of the monarch were not distinguished. But the history of the English Parliament originates from the desire of nobles to limit the costs of the king and his right to introduce new fees at its whim.
England was the first country where after the revolution of 1648 the follows principle was proclaimed: all taxes should be imposed with the consent of the Parliament. In 1689 the Parliament received the right of approval of all revenues and expenditures.
Specific features of the budget:
1)a budget is a special form of redistribution based on seizure a part of GDP in favor of the state, it helps to meet the demand of the administrative units and population for public goods;
2)a budget is an important mechanism of implementation of the needs at each historical stage of development;
3)a budget is a system of centralized funds in the framework of public and municipal finance, which has a specific set of quantitative and qualitative characteristics, such asthe concentration of a substantial amount of resources (from one third to two thirds of GDP in developed countries), the scale of inter-territorial redistribution of resources; redistribution and equalization of
households’ incomes;
4) the budget and fiscal policy facilitate the implementation of the tasks of the state economic
policy.
The budget is revealed through its functions:
regulatory;
fiscal;
control.
The most important feature of the budget is its balance. A balanced budget means that all planned expenditure is covered by revenues.
The budget deficit reflects the excess of expenditure over income. If the budget is in deficit for several years, the government has to attract external or internal resources to cover it. The government can take credits and loans from foreign countries and international organizations, at the same time it can borrow money from its own population and business entities. The government can reduce budget expenditures to overcome the deficit. This path is the easiest, but for the population and economy is very painful. Another way to overcome the deficit is the issue additional money. Finally, the government may try to find additional sources of budget revenues. It can sell state assets or increase taxes, but this way is extremely unpopular and painful for the population and business structures.
Federal Budget of the Russian Federation is shown in table 4.
Table 4
Federal Budget of the Russian Federation (billion roubles)
|
2012 |
2013 |
Revenues |
12855.5 |
13019.9 |
of which: |
|
|
profit (income) tax of organizations |
375.8 |
352.2 |
value added tax: |
|
|
for goods (works, services) sold on territory of the |
1886.1 |
1868.2 |
Russian Federation |
|
|
for goods, imported on territory of the Russian |
1659.7 |
1670.8 |
Federation |
|
|
excise on goods (products): |
|
|
produced on territory of the Russian Federation |
341.9 |
461.0 |
imported on territory of the Russian Federation |
53.4 |
63.4 |
tax, dues and regular payment for natural re-sources |
2442.8 |
2554.8 |
usage |
|
|
revenue from external economic activities |
4962.7 |
5011.0 |
revenue from use of state and municipal property |
543.3 |
348.0 |
payments for natural resources usage |
101.3 |
245.1 |
uncompensated revenue |
64.6 |
51.1 |
Expenditures |
12895.0 |
13342.9 |
of which on: |
|
|
objectives affecting the state as a whole |
809.9 |
850.7 |
state and municipal debt service |
320.0 |
360.3 |
national defence |
1812.4 |
2103.6 |
law enforcement and state security |
1843.0 |
2061.6 |
national economy |
1968.5 |
1849.3 |
of which on: |
|
|
fuel and energy complex |
107.8 |
19.5 |
agriculture and fishery |
148.8 |
219.7 |
transport |
339.7 |
258.4 |
public road system (road funds) |
442.4 |
504.5 |
communications and informatics |
41.3 |
41.9 |
scientific research for national economy |
229.1 |
265.3 |
other fields of national economy |
526.6 |
399.4 |
housing – communal utilities |
228.8 |
177.5 |
social-cultural arrangements |
5290.5 |
5247.5 |
general inter-budget transfers between budgets of |
599.4 |
668.1 |
constituent entities of the Russian Federation and municipal |
|
|
entities |
|
|
Proficit, deficit (-) |
-39.4 |
-323.0 |
TOPIC 7. INTRODUCTION TO TAXATION
Questions for the lectures and the seminars:
Government revenue. The sources of budget revenues Types of taxes. The main characteristics of a tax system. Commodity Taxation, Income Taxation. The Limits to Redistribution, Tax Evasion. The distribution of the tax burden. Excessive tax burden and its evaluation. Tax optimization
A tax is an obligatory payment made by a private person or a legal entity in favour of a state budget.
Taxes are divided into two categories:
direct ,
indirect .
Direct taxes
Direct taxes are levied on property or income of the taxpayer. Direct taxes are taken from the current (wages, profit) or capital income (land, property, natural resources).
This tax is paid by the manufacturer of the goods, by the recipient of the income or by property owner. So direct taxes are sometimes referred to taxes on production. Direct taxes are charged on income received from the use of land, labour, capital, and serve as an important tool in government social policy. Examples of a direct tax are income tax, profit tax, property tax and other taxes.
The taxation of income is a major source of government revenue. So, income tax is the subject of political discussion. The arguments that are aired in such debate reflect the two main perspectives upon income taxation. The first views the tax as a disincentive for enterprise. On
these grounds, it follows that the rate of tax should be kept as low as possible in order to avoid such discouragement. This is essentially the expression of an efficiency argument.
The competing perspective is that income taxation is well-suited for the task of redistributing income. Hence notions of equity require that high earners should pay proportionately more tax on their incomes than low earners. The determination of the optimal structure of income taxation involves the resolution of these contrasting views.
These arguments introduce the two major issues in the analysis of income taxation. The first is the effect of taxation upon the supply of labor. Taxation alters the choices that consumers make by affecting the trade-off between labor and leisure. In this respect, a particularly important question is whether an increase in the rate of tax necessarily reduces the supply of labor. If this is the case, support would be provided for the argument that taxes should be kept low to meet the needs of efficiency. Both theoretical and empirical results on this issue will be discussed. The second issue that has been studied is the determination of the optimal level of income taxation. For reasons which will become clear, this is a complex question since if involves constructing a model with a meaningful trade-off between efficiency and equity.
Income tax or tax on personal income is paid by private person. Payments are made during the year, but the final payment is made at the end of it. Tax systems of different countries, being mostly similar, have their own sets tax rates and exemptions from taxation, tax credits and the timing of payments. Usually, income tax is levied at progressive rates, rising along with the growth of income of the taxpayer. The highest income tax ranges from 30 to 70% in the developed countries. The highest level of income tax is in Sweden. Russia has the minimum rate of this tax. Nowadays income tax in Russia is 13%.
Indirect taxes
Indirect taxes are based on indirect taxation of commodities (goods and services). Taxes on expenditure (alcohol, tobacco, jewelry and so on) are usually included in the price.
Each tax can be fully assigned the level of the budget as its revenues, or it is divided between different levels in a certain proportion.
Commodity taxes are levied on transactions involving the purchase of goods.
The necessity for keeping accounts ensures that such transactions are generally public information. This makes them a good target for taxation.
Usually the government of every country creating the tax system attaches importance to direct taxes; however, these trends are not seen in Europe, where countries prefer to use indirect taxes, such as value added tax.
Deadweight Loss
The taxes drive a wedge between the price producers receive and the price consumers
pay.
This leads to inefficiency and reduces the attainable level of welfare.
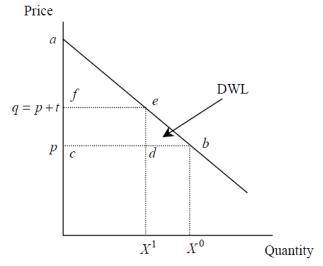
The effects of commodity taxes are quite easily understood. The imposition of a tax raises the price of a good. On the consumer side of the market, the standard analysis of income and substitution effects predicts what will happen to demand. For producers, the tax is a cost increase and they respond accordingly.
It is always possible to change a consumption plan if commodity taxation is introduced. Demand can shift from goods subject to high taxes to goods with low taxes and total consumption reduced by earning less or saving more. It is these changes at the margin, which we call substitution effects.
The introduction of a commodity tax causes raises tax revenue but causes consumer welfare to be reduced. The deadweight loss of the tax is the extent to which the reduction in welfare exceeds the revenue raised. This concept is illustrated in Figure 5.
Figure 5. Deadweight Loss (DWL)
Progressive, regressive and proportional taxes
Another important approach to taxation is based on the following question how changing the share of tax payments in the income. From this point of view there are progressive, regressive and proportional taxes. Progressive tax is increasing faster than income, regressive is growing slower than income, and the percentage of the proportional tax income remains the same regardless of income volume.
The optimal tax system
The optimal tax system has four properties:
economic efficiency,
administrative simplicity
flexibility
justice.
Economic efficiency implies that the tax system should not interfere with the efficient allocation of resources.
Administrative simplicity means that the costs associated with the functioning of the tax system, should be minimal.
The flexibility of the tax system is its ability to respond quickly to changing economic conditions.
Justice means horizontal and vertical equity. Horizontal equality means that people, who have the same level of income, are taxed equally. Vertical equality means that some people who get higher level of income should pay higher taxes.
Types of tax system
In the world there are two types of tax system:
•the first one relies on direct taxes, which are concentrated on the federal government level (the USA tax system). In such a system, every tax appropriates to one budget;
•the second system focuses on the indirect taxes (e.g. European countries). Thus, one tax
is divided among all budgets. Indirect taxes are easier to collect than direct, so there is an increase in the share of indirect taxes in the structure of budget revenues.
Developing countries seek to find a balance between these two systems. Tax revenue of
developed countries are shown in table 11.
|
|
|
|
|
|
|
|
|
|
Table 11 |
|
|
|
Tax revenue of developed countries (percentage of total taxation), 2011 |
|
||||||
|
|
|
|
|
|
|
|
|
|
|
|
|
|
|
Income & |
Social |
|
|
Goods and |
|
EU |
Country |
|
|
Payroll |
Property |
Others |
Custom |
||||
|
|
profits |
security |
services |
||||||
|
|
|
|
|
|
|
Duties |
|||
|
|
|
|
|
|
|
|
|
|
|
|
|
|
|
|
|
|
|
|
|
|
Australia |
|
|
59,1 |
0,0 |
5,2 |
8,6 |
27,1 |
0,0 |
.. |
|
|
|
|
|
|
|
|
|
|
|
|
Austria |
(1) |
|
28,9 |
34,4 |
6,9 |
1,2 |
27,8 |
0,5 |
0,3 |
|
|
|
|
|
|
|
|
|
|
|
|
Belgium |
|
|
|
34,9 |
32,2 |
0,0 |
7,3 |
24,7 |
0,0 |
0,8 |
|
|
|
|
|
|
|
|
|
|
|
Canada |
|
|
|
47,1 |
15,3 |
2,1 |
10,9 |
24,5 |
0,1 |
.. |
|
|
|
|
|
|
|
|
|
|
|
Chile |
|
|
|
40,1 |
6,3 |
0,0 |
4,0 |
49,3 |
0,3 |
.. |
|
|
|
|
|
|
|
|
|
||
Czech Republic |
|
20,4 |
44,1 |
0,0 |
1,5 |
33,4 |
0,0 |
0,5 |
||
|
|
|
|
|
|
|
|
|
|
|
Denmark |
(1) |
|
60,9 |
2,1 |
0,5 |
4,1 |
32,0 |
0,0 |
0,4 |
|
|
|
|
|
|
|
|
|
|
|
|
Estonia |
|
|
|
20,0 |
37,0 |
0,0 |
1,0 |
41,5 |
0,0 |
0,6 |
|
|
|
|
|
|
|
|
|
|
|
Finland |
|
|
35,6 |
28,9 |
0,0 |
2,6 |
32,6 |
|
0,1 |
0,2 |
|
|
|
|
|
|
|
|
|
|
|
|
|
France |
|
(1) |
22,7 |
37,9 |
3,1 |
8,5 |
24,8 |
|
2,8 |
0,2 |
|
|
|
|
|
|
|
|
|
|
|
||
Germany |
(2) |
29,5 |
38,5 |
0,0 |
2,4 |
29,1 |
|
0,0 |
0,5 |
||
|
|
|
|
|
|
|
|
|
|
||
Greece |
(1) |
21,7 |
33,0 |
0,0 |
5,5 |
39,4 |
|
0,0 |
0,3 |
||
|
|
|
|
|
|
|
|
|
|
||
Hungary |
|
16,5 |
34,9 |
1,8 |
3,1 |
42,9 |
|
0,5 |
0,3 |
||
|
|
|
|
|
|
|
|
|
|
|
|
Iceland |
|
|
45,5 |
11,4 |
0,5 |
6,7 |
34,7 |
|
1,1 |
.. |
|
|
|
|
|
|
|
|
|
|
|
|
|
Ireland |
|
|
41,0 |
16,6 |
0,7 |
6,8 |
34,3 |
|
0,0 |
0,5 |
|
|
|
|
|
|
|
|
|
|
|
|
|
Israel |
|
|
|
30,0 |
17,2 |
3,8 |
9,5 |
39,6 |
|
0,0 |
.. |
|
|
|
|
|
|
|
|
|
|
|
|
Italy |
|
|
|
32,2 |
31,2 |
0,0 |
5,2 |
26,1 |
|
4,9 |
0,3 |
|
|
|
|
|
|
|
|
|
|
|
|
Japan |
|
|
|
30,2 |
41,4 |
0,0 |
9,7 |
18,4 |
|
0,3 |
.. |
|
|
|
|
|
|
|
|
|
|
|
|
Korea |
|
|
|
30,3 |
23,5 |
0,3 |
11,4 |
31,4 |
|
3,1 |
.. |
|
|
|
|
|
|
|
|
|
|||
Luxembourg |
36,1 |
29,6 |
0,0 |
7,1 |
27,0 |
|
0,1 |
0,1 |
|||
|
|
|
|
|
|
|
|
|
|
|
|
Mexico |
|
|
27,3 |
14,5 |
1,5 |
1,5 |
54,1 |
|
1,1 |
.. |
|
|
|
|
|
|
|
|
|
|
|||
Netherlands |
26,8 |
38,4 |
0,0 |
3,3 |
30,0 |
|
0,5 |
0,9 |
|||
|
|
|
|
|
|
|
|
|
|||
New Zealand |
53,6 |
0,0 |
0,0 |
6,6 |
39,8 |
|
0,0 |
.. |
|||
|
|
|
|
|
|
|
|
|
|
|
|
Norway |
|
|
48,3 |
22,3 |
0,0 |
2,9 |
26,5 |
|
0,0 |
.. |
|
|
|
|
|
|
|
|
|
|
|
|
|
Poland |
|
|
|
20,2 |
35,4 |
0,8 |
3,7 |
39,2 |
|
0,5 |
0,3 |
|
|
|
|
|
|
|
|
|
|
||
Portugal |
|
28,4 |
28,2 |
0,0 |
3,2 |
39,2 |
|
0,7 |
0,3 |
||
|
|
|
|
|
|
|
|
|
|||
Slovak Republic |
17,9 |
42,7 |
0,0 |
1,4 |
37,2 |
|
0,0 |
0,8 |
|||
|
|
|
|
|
|
|
|
|
|
||
Slovenia |
|
19,9 |
40,4 |
0,2 |
1,6 |
37,4 |
|
0,0 |
0,5 |
||
|
|
|
|
|
|
|
|
|
|
|
|
Spain |
(1) |
|
29,0 |
37,5 |
0,0 |
6,0 |
26,2 |
|
0,8 |
0,5 |
|
|
|
|
|
|
|
|
|
|
|
|
|
Sweden |
|
|
35,0 |
22,9 |
10,0 |
2,4 |
29,3 |
|
0,1 |
0,3 |
|
|
|
|
|
|
|
|
|
|
|||
Switzerland |
46,1 |
24,5 |
0,0 |
7,1 |
22,3 |
|
0,0 |
.. |
|||
|
|
|
|
|
|
|
|
|
|
|
|
Turkey |
|
|
21,0 |
27,9 |
0,0 |
4,1 |
45,2 |
|
1,8 |
.. |
|
|
|
|
|
|
|
|
|
|
|||
United Kingdom |
36,8 |
18,7 |
0,0 |
11,6 |
32,3 |
|
0,0 |
0,5 |
|||
|
|
|
|
|
|
|
|
|
|||
United States |
46,5 |
22,8 |
0,0 |
12,4 |
18,3 |
|
0,0 |
.. |
|||
|
|
|
|
|
|
|
|
|
|||
Unweighted average |
|
|
|
|
|
|
|
|
|||
|
|
|
|
|
|
|
|
|
|||
OECD-Total |
33,5 |
26,2 |
1,1 |
5,4 |
32,9 |
|
0,6 |
0,4 |
|||
|
|
|
|
|
|
|
|
|
|
|
|
|
|
|
Source: |
OECD. |
Revenue |
Statistics |
1965—1995. |
http://www.oecd.org/ctp/tax- |
|||
policy/revenue-statistics-tax-structures.htm
Tax evasion and tax avoidance
Tax evasion should be distinguished from tax avoidance, which is the reorganization of economic activity, possibly at some cost, to lower tax payment. Tax avoidance is legal, tax evasion is not.
In practice, the distinction is not clear because tax avoidance schemes frequently need to be tested in court to clarify their legality. The terms black, shadow or hidden economy refer to all economic activities for which payment is made but are not officially declared. Under these headings different illegal activities are included, such as the drug trade, and legal but unmeasured activities such as agricultural output by smallholders. They would also incorporate the legal, but undeclared income which constitutes tax evasion.
This discussion reveals that there are several issues concerning how economic activity should be divided between the regular economy and the shadow economy.
For instance, most systems of national accounts do not include criminal activity (although Italy, for example, does make some adjustment for smuggling).
In principle, the UN System of National Accounts includes both legal and illegal activities and it has been suggested that criminal activity should be made explicit when the system is revised.
Table 12 shows a number of estimates of the size of the hidden economy on a range of countries.
Table 12
Hidden Economy as % of GDP, Average Over 1990-93
Developing |
Transition |
OECD |
Egypt 68-76% |
Georgia 28-43% |
Italy 24-30% |
Thailand 70% |
Ukraine 28-43% |
Spain 24-30% |
Mexico 40-60% |
Hungary 20-28% |
Denmark 13-23% |
Malaysia 38-50% |
Russia 20-27% |
France 13-23% |
Tunisia 39-45% |
Latvia 20-27% |
Japan 8-10% |
Singapore 13% |
Slovakia 9-16% |
Austria 8-10% |
Source: Schneider F., and Enste D.H., 2000, ‖Shadow economies: Size, causes, and consequences‖, Journal of Economic Literature, 38, 77-114.
TOPIC 8. THE ANALYSIS OF EXPENDITURE POLICY
Questions for the lectures and the seminars:
Budget of a Federal state: main expenditures of the state. Forms of public spending: Public purchases and transfers. The problem of balancing the state budget. Public debt: types, structure, funding sources. Fiscal Federalism. The division of responsibilities. Principles of fiscal federalism.
Budget is a form of generation and withdrawal of monetary funds intended for financial
support of the federal government and local authorities.
Main expenses of any country can be divided into five groups:
1)costs of public administration (defence, law enforcement, etc.);
2)social expenditures (healthcare, education, culture, social security);
3)financing of economy (transport, information infrastructure, science, agriculture);
4)inter-budgetary equalization, i.e. redistribution of budget resources to smoothing territorial differences;
5)debt service.

The ratio between these groups is determined by many factors: the level of socio-economic development of the country, its relations with other countries, historical traditions and a commitment to a particular model of economic regulation.
The share of public expenditure in GDP in the leading industrial countries is shown in table
13.
Table 13 The share of public expenditure in GDP in the leading industrial countries 1950-2015., %
|
|
|
|
|
law |
|
Social expenses |
|
|
||
Country |
Year |
Total |
government |
defence |
|
|
|
|
others |
||
|
|
Public |
pensions, |
||||||||
|
|
|
|
|
enforcement |
total |
education |
health |
grants |
|
|
|
|
|
|
|
|
|
|||||
|
|
|
|
|
|
|
|
|
|
|
|
|
1880 |
8,0 |
|
|
|
|
|
|
|
|
|
|
1913 |
8,0 |
|
|
|
|
|
|
|
|
|
|
1938 |
19,8 |
|
|
|
|
|
|
|
|
|
USA |
1950 |
24,9 |
0,8 |
13,1 |
0,5 |
7,0 |
3,2 |
0,5 |
3,2 |
3,5 |
|
1980 |
33,5 |
1,5 |
8,5 |
1,3 |
18,2 |
6,6 |
1,5 |
10,1 |
4,0 |
||
|
|||||||||||
|
1990 |
35,0 |
1,6 |
6,9 |
1,5 |
19,0 |
6,9 |
1,6 |
10,5 |
6,0 |
|
|
2000 |
35,7 |
1,7 |
4,7 |
1,6 |
20,8 |
7,2 |
1,9 |
10,7 |
6,9 |
|
|
2015* |
36,5 |
1,0 |
2,6 |
1,4 |
24,6 |
7,7 |
2,3 |
14,6 |
6,9 |
|
|
1880 |
10,0 |
|
|
|
|
|
|
|
|
|
|
1913 |
17,7 |
|
|
|
|
|
|
|
|
|
|
1938 |
42,4 |
|
|
|
|
|
|
|
|
|
Germany |
1950 |
28,4 |
1,9 |
4,3 |
1,4 |
18,4 |
2,7 |
3,5 |
12,2 |
2,4 |
|
1980 |
42,4 |
3,2 |
4,4 |
2,4 |
25,6 |
4,8 |
6,8 |
14,0 |
6,8 |
||
|
1990 |
42,9 |
3,2 |
4,2 |
2,6 |
26,5 |
5,1 |
7,1 |
14,1 |
6,7 |
|
|
2000 |
42,9 |
3,5 |
4,0 |
2,7 |
27,1 |
5,4 |
7,2 |
14,5 |
5,6 |
|
|
2015* |
42,8 |
2,6 |
2,5 |
2,5 |
27,7 |
5,7 |
7,5 |
14,5 |
7,5 |
|
|
1880 |
15,0 |
|
|
|
|
|
|
|
|
|
|
1913 |
8.9 |
|
|
|
|
|
|
|
|
|
|
1938 |
23,2 |
|
|
|
|
|
|
|
|
|
France |
1950 |
31,4 |
2,0 |
7,8 |
0,8 |
19,6 |
4,7 |
2,4 |
12,5 |
1,2 |
|
1980 |
45,3 |
2,8 |
5,0 |
1,7 |
32,6 |
8,3 |
4,4 |
19,9 |
3,3 |
||
|
|||||||||||
|
1990 |
47,2 |
3,5 |
5,7 |
1,3 |
33,5 |
8,7 |
4,8 |
20,0 |
3,3 |
|
|
2000 |
47,5 |
3,3 |
4,7 |
1,4 |
34,3 |
8,7 |
5,1 |
20,5 |
3,8 |
|
|
2015* |
45,5 |
2,5 |
3,0 |
1,3 |
34,8 |
8,8 |
5,6 |
20,5 |
3,8 |
|
|
1880 |
10,0 |
|
|
|
|
|
|
|
|
|
|
1913 |
13,3 |
|
|
|
|
|
|
|
|
|
|
1938 |
28,8 |
|
|
|
|
|
|
|
|
|
UK |
1950 |
32,1 |
1,5 |
4,6 |
1,5 |
17,9 |
5,1 |
5,1 |
7,7 |
6,4 |
|
1980 |
40,6 |
1,9 |
6,9 |
2,5 |
22,5 |
6,9 |
6,9 |
8,8 |
6,9 |
||
|
|||||||||||
|
1990 |
42,9 |
1,9 |
6,7 |
2,4 |
25,6 |
6,9 |
6,9 |
11,9 |
6,3 |
|
|
2000 |
43,1 |
2,0 |
5,7 |
2,4 |
26,8 |
7,0 |
7,3 |
12,5 |
6,1 |
|
|
2015* |
43,4 |
1,7 |
3,5 |
2,3 |
29,8 |
7,2 |
8,1 |
14,5 |
6,1 |
|
|
1950 |
22,5 |
1,5 |
3,0 |
1,5 |
14,5 |
3,5 |
3,0 |
8,0 |
2,0 |
|
|
1980 |
38,1 |
2,8 |
3,2 |
2,8 |
24,7 |
6,3 |
5,1 |
13,3 |
4,5 |
|
Italy |
1990 |
47,9 |
3,7 |
3,7 |
3,2 |
31,8 |
7,4 |
6,5 |
18,0 |
5,5 |
|
|
2000 |
49,0 |
3,6 |
3,2 |
3,2 |
34,3 |
7,2 |
6,5 |
20,6 |
4,8 |
|
|
2015* |
45,5 |
2,8 |
2,0 |
2,8 |
33,1 |
6,7 |
6,5 |
19,8 |
4,8 |
|
|
1880 |
11,0 |
|
|
|
|
|
|
|
|
|
|
1913 |
14,2 |
|
|
|
|
|
|
|
|
|
Japan |
1938 |
30,3 |
|
|
|
|
|
|
|
|
|
|
1950 |
13,2 |
1,6 |
1,1 |
1,6 |
6,8 |
3,2 |
0,5 |
3,2 |
2,1 |
|
|
1980 |
25,0 |
1,9 |
1,0 |
1,9 |
16,2 |
5,4 |
0,6 |
10,3 |
3,9 |
|
|
|
|
|
|
|
|
|
|
|
|
|