Отчет по лабораторной работе №5 МСвСПД
.docxМИНИСТЕРСТВО ЦИФРОВОГО РАЗВИТИЯ И МАССОВЫХ КОММУНИКАЦИЙ РОССИЙСКОЙ ФЕДЕРАЦИИ
Федеральное государственное бюджетное образовательное учреждение
высшего образования
«Санкт-Петербургский государственный университет телекоммуникаций
им. проф. М. А. Бонч-Бруевича»
Кафедра сетей связи и передачи данных
Отчет по лабораторной работе №5
«Моделирование канала ДСК и Z-канала в системе Octave»
По дисциплине: «Многофункциональный синтез в системах передачи данных»
Цель работы:
Ознакомиться с принципами построения моделей каналов в системе Octave на примере канала Гилберта–Эллиотта и провести моделирование канала ДСК и Z-канала.
Ход выполнения работы:
Канал ДСК
Листинг lab_5.m
pkg load communications
p0 =[1e-4 5e-4 1e-3 5e-3 1e-2 5e-2 1e-1];
b = 1e5
n = 5
a = zeros (1,b);
inbuilt_BSC = zeros (n+1,7);
function_BSC = zeros (n+1,7);
for i1 = 1:1:n
for i2 = 1:1:7
rec = bsc (a,p0(i2));
[ num , rate ]= biterr (a,rec);
inbuilt_BSC(i1,i2) = rate;
endfor
endfor
for i3= 1:1:7
inbuilt_BSC(n+1,i3) = mean(inbuilt_BSC(1:n,i3));
endfor
%
for i4 = 1:1:n
for i5 = 1:1:7
rec2 = bsc_project(a,p0(i5),0);
[ num , rate ]= biterr (a,rec2);
function_BSC(i4,i5) = rate;
endfor
endfor
for i6= 1:1:7
function_BSC(n+1,i6) = mean(function_BSC(1:n,i6));
endfor
%
format long ;
inbuilt_BSC
function_BSC
%
mfig = figure ;
subplot(3,1,1)
loglog (p0,inbuilt_BSC(1:n,:),"r",p0,inbuilt_BSC(n+1,:),"g")
hold on;
title ( sprintf ('function BSC channel') ) ;
xlabel (" BER in BSC channel , p0") ;
ylabel ("Symbol Error rate") ;
%
subplot(3,1,2)
loglog (p0,function_BSC(1:n,:),"r",p0,function_BSC(n+1,:),"g")
hold on ;
title ( sprintf ('Inbuilt BSC channel') ) ;
xlabel (" BER in BSC channel , p0") ;
ylabel ("Symbol Error rate") ;
%
subplot(3,1,3)
loglog (p0,inbuilt_BSC(n+1,:),"b",p0,function_BSC(n+1,:),"g")
hold on ;
title ( sprintf (' Mean ') ) ;
xlabel (" BER in BSC channel , p0") ;
ylabel ("mid Symbol Error rate") ;
Листинг bsc_project.m
function [outArr, lastState] = bsc_project(dataArr,p0,initState)
State = initState;
[Height, Width] = size(dataArr);
outArr = zeros(Height, Width);
for Cnt1 = 1:Height
for Cnt2 = 1:Width
if State == 0
outArr(Cnt1,Cnt2) = xor(dataArr(Cnt1,Cnt2),rand(1)<=p0);
State = rand(1)<=p0;
elseif State == 1
outArr(Cnt1,Cnt2) = xor(dataArr(Cnt1,Cnt2), rand(1)<=p0);
State = rand(1)>1-p0;
else
printf('Error: Incorect state\n');
break;
endif
endfor
endfor
lastState = State;
end
Вывод в консоль:
inbuilt_BSC =
Columns 1 through 3:
1.400000000000000e-04 5.300000000000000e-04 1.050000000000000e-03
8.000000000000001e-05 4.500000000000000e-04 9.700000000000001e-04
6.999999999999999e-05 4.100000000000000e-04 8.899999999999999e-04
1.000000000000000e-04 5.300000000000000e-04 1.060000000000000e-03
1.200000000000000e-04 5.200000000000000e-04 1.060000000000000e-03
1.020000000000000e-04 4.880000000000000e-04 1.006000000000000e-03
Columns 4 through 6:
5.300000000000000e-03 1.004000000000000e-02 4.961000000000000e-02
4.930000000000000e-03 9.820000000000001e-03 5.089000000000000e-02
4.910000000000000e-03 1.012000000000000e-02 4.950000000000000e-02
4.920000000000000e-03 1.040000000000000e-02 5.021000000000000e-02
4.880000000000000e-03 1.020000000000000e-02 5.043000000000000e-02
4.988000000000000e-03 1.011600000000000e-02 5.012800000000001e-02
Column 7:
1.009600000000000e-01
1.001600000000000e-01
1.003100000000000e-01
1.003300000000000e-01
1.000500000000000e-01
1.003620000000000e-01
function_BSC =
Columns 1 through 3:
1.600000000000000e-04 5.800000000000000e-04 9.500000000000000e-04
9.000000000000001e-05 5.900000000000000e-04 8.800000000000000e-04
9.000000000000001e-05 4.500000000000000e-04 1.080000000000000e-03
1.100000000000000e-04 4.600000000000000e-04 9.600000000000000e-04
8.000000000000001e-05 5.400000000000000e-04 1.030000000000000e-03
1.060000000000000e-04 5.239999999999999e-04 9.800000000000000e-04
Columns 4 through 6:
5.060000000000000e-03 9.990000000000001e-03 4.987000000000000e-02
5.100000000000000e-03 9.540000000000000e-03 5.002000000000000e-02
5.180000000000000e-03 1.007000000000000e-02 4.971000000000000e-02
4.860000000000000e-03 9.370000000000000e-03 4.999000000000000e-02
5.020000000000000e-03 1.032000000000000e-02 4.914000000000000e-02
5.044000000000000e-03 9.858000000000000e-03 4.974600000000000e-02
Column 7:
9.873999999999999e-02
9.987000000000000e-02
1.001900000000000e-01
9.976000000000000e-02
1.000800000000000e-01
9.972800000000001e-02
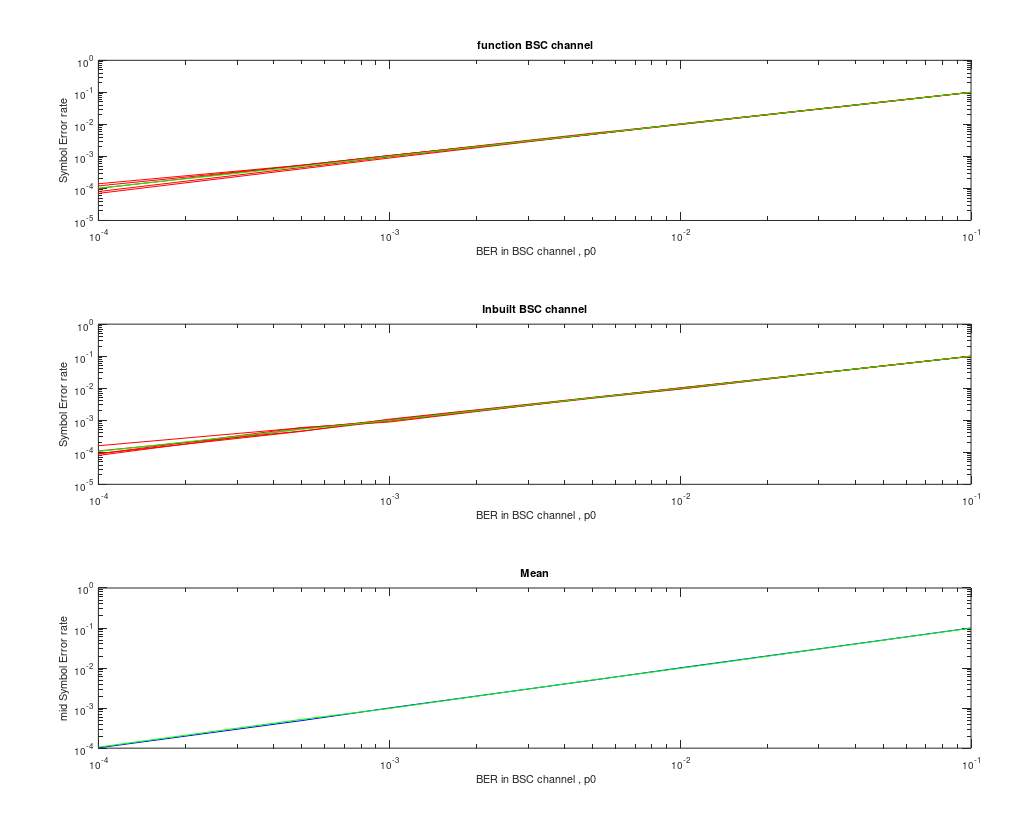
Рисунок 1. Сравнение результатов модели ДСК и встроенной в систему Octave модели канала ДСК
Z-канал
Листинг lab_5_Z.m
pkg load communications
p0 =[1e-4 5e-4 1e-3 5e-3 1e-2 5e-2 1e-1];
b = 1e5
n = 5
data_zeros = zeros (1,b);
data_ones = ones (1,b);
data_randint = randint (1,b);
Z_ones = zeros (n+1,7);
Z_zero = zeros (n+1,7);
Z_randint = zeros (n+1,7);
for i1 = 1:1:n
for i2 = 1:1:7
ones_bzc = sum(data_randint);
rec_zeros = Z_channel (data_zeros,p0(i2));
rec_ones = Z_channel (data_ones,p0(i2));
rec_randint = Z_channel (data_randint,p0(i2));
error_Z_zero = sum(rec_zeros);
error_Z_ones = b - sum(rec_ones);
error_Z_randint = (ones_bzc - sum(rec_randint));
%
ex_err_Z_zeros = error_Z_zero/b;
ex_err_Z_ones = error_Z_ones/b;
ex_err_Z_randint = error_Z_randint/b;
%
Z_zero(i1,i2) = ex_err_Z_zeros;
Z_ones(i1,i2) = ex_err_Z_ones;
Z_randint(i1,i2) = ex_err_Z_randint;
endfor
endfor
for i3= 1:1:7
Z_ones(n+1,i3) = mean(Z_ones(1:n,i3));
Z_zero(n+1,i3) = mean(Z_zero(1:n,i3));
Z_randint(n+1,i3) = mean(Z_randint(1:n,i3));
endfor
%
format long ;
Z_ones
Z_zero
Z_randint
%
subplot(3,1,1)
loglog (p0,Z_ones(1:n,:),"r",p0,Z_ones(n+1,:),"g")
hold on;
title ( sprintf ('Ones') ) ;
xlabel (" BER in Z-channel, p0") ;
ylabel ("Symbol Error rate") ;
%
subplot(3,1,2)
loglog (p0,Z_zero(1:n,:),"r",p0,Z_zero(n+1,:),"g")
hold on ;
title ( sprintf ('Zeros') ) ;
xlabel (" BER in Z-channel, p0") ;
ylabel ("Symbol Error rate") ;
%
subplot(3,1,3)
loglog (p0,Z_randint(1:n,:),"r",p0,Z_randint(n+1,:),"g")
hold on ;
title ( sprintf ('Randint') ) ;
xlabel (" BER in Z-channel, p0") ;
ylabel ("Symbol Error rate") ;
%
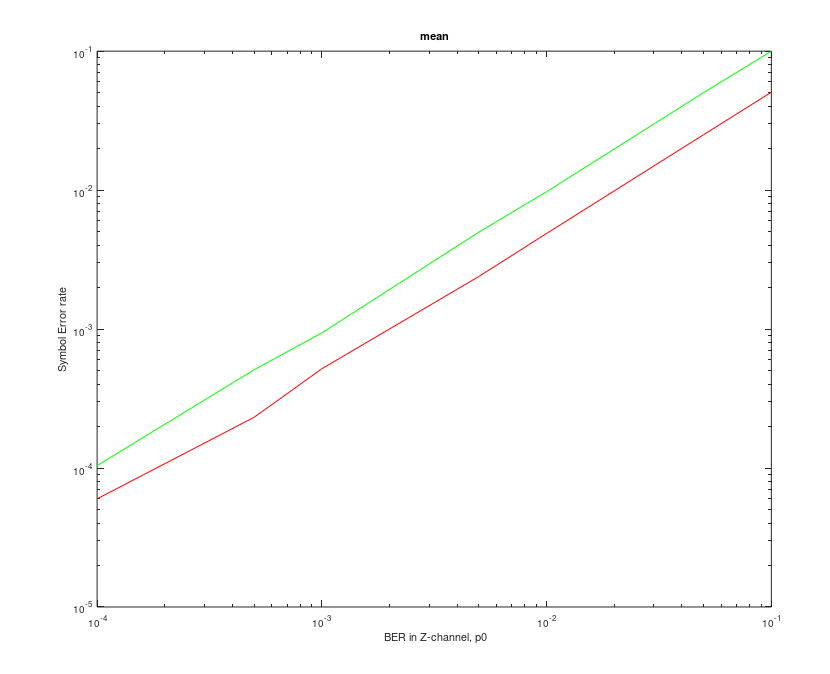
mfig = figure ;
loglog (p0,Z_zero(n+1,:),"b",p0,Z_ones(n+1,:),"g",p0,Z_randint(n+1,:),"r")
hold on;
title ( sprintf ('mean') ) ;
xlabel (" BER in Z-channel, p0") ;
ylabel ("Symbol Error rate") ;
Листинг Z_channel.m
function [outArr] = Z_channel(dataArr, p0)
[Height, Width] = size(dataArr);
outArr = zeros(Height, Width);
for Cnt1 = 1:Height
for Cnt2 = 1:Width
if dataArr(Cnt1,Cnt2) == 1
outArr(Cnt1,Cnt2) = xor(dataArr(Cnt1,Cnt2),rand(1)<=p0);
endif
endfor
endfor
end
Вывод в консоль:
Z_ones =
Columns 1 through 3:
1.000000000000000e-04 4.800000000000000e-04 9.900000000000000e-04
1.000000000000000e-04 5.200000000000000e-04 8.200000000000000e-04
6.999999999999999e-05 4.900000000000000e-04 1.090000000000000e-03
1.200000000000000e-04 5.300000000000000e-04 9.000000000000000e-04
1.300000000000000e-04 5.300000000000000e-04 8.899999999999999e-04
1.040000000000000e-04 5.100000000000000e-04 9.379999999999999e-04
Columns 4 through 6:
4.820000000000000e-03 9.490000000000000e-03 5.138000000000000e-02
5.230000000000000e-03 9.809999999999999e-03 5.003000000000000e-02
4.950000000000000e-03 1.000000000000000e-02 4.924000000000000e-02
5.090000000000000e-03 9.520000000000001e-03 5.032000000000000e-02
4.850000000000000e-03 9.830000000000000e-03 5.072000000000000e-02
4.988000000000000e-03 9.729999999999999e-03 5.033800000000001e-02
Column 7:
1.004000000000000e-01
1.003700000000000e-01
9.783000000000000e-02
1.009100000000000e-01
9.970000000000000e-02
9.984200000000000e-02
Z_zero =
0 0 0 0 0 0 0
0 0 0 0 0 0 0
0 0 0 0 0 0 0
0 0 0 0 0 0 0
0 0 0 0 0 0 0
0 0 0 0 0 0 0
Z_randint =
Columns 1 through 3:
6.999999999999999e-05 2.600000000000000e-04 5.500000000000000e-04
1.000000000000000e-04 2.300000000000000e-04 5.800000000000000e-04
6.000000000000000e-05 2.200000000000000e-04 3.900000000000000e-04
5.000000000000000e-05 2.400000000000000e-04 5.600000000000000e-04
2.000000000000000e-05 2.100000000000000e-04 5.100000000000000e-04
6.000000000000001e-05 2.320000000000000e-04 5.180000000000000e-04
Columns 4 through 6:
2.420000000000000e-03 4.440000000000000e-03 2.515000000000000e-02
2.250000000000000e-03 4.660000000000000e-03 2.540000000000000e-02
2.520000000000000e-03 5.100000000000000e-03 2.504000000000000e-02
2.250000000000000e-03 5.200000000000000e-03 2.488000000000000e-02
2.520000000000000e-03 4.980000000000000e-03 2.492000000000000e-02
2.392000000000000e-03 4.876000000000000e-03 2.507800000000000e-02
Column 7:
5.002000000000000e-02
5.022000000000000e-02
5.106000000000000e-02
5.133000000000000e-02
5.068000000000000e-02
5.066200000000000e-02
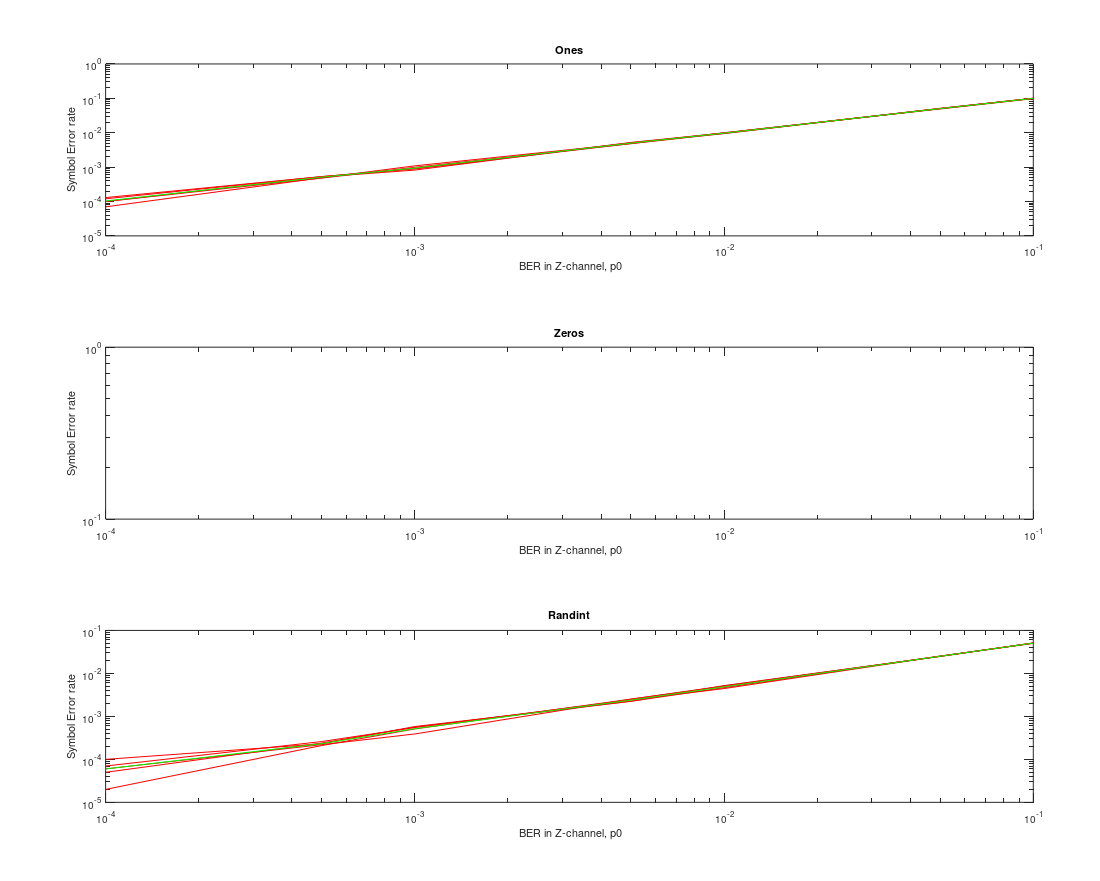
Рисунок 2. Графики зависимости результирующей вероятности ошибки на выходе Z-канала