

Licensed for single user. © 2017 ASHRAE, Inc.
This file is licensed to John Murray (John9@gmail.com). Publication Date: 6/1/2017
Ventilation and Infiltration
for business or hobby purposes, which may introduce air contaminants not addressed in Standard 62.2; portions of these residences may require ventilation air as required by Standard 62.1 or industrial guidelines.
Source Control
When considering how much whole-house ventilation should be supplied, both typical and unusual sources of indoor pollution should be controlled first to limit the required ventilation rate. This can be done either by mitigating the source itself or by using local exhaust to extract contaminants before they can mix into the indoor environment. Typical sources that should be considered include the following.
Clothes Dryers and Central Vacuum Systems. Clothes dryer exhaust is heavily laden with moisture and laundry by-products such as flammable lint and various gaseous contaminants. Many moisture problems have been traced to clothes dryers vented indoors or to attics, crawlspaces, garages, or other inappropriate locations. Exhaust from clothes dryers, which is typically about 70 L/s, must be vented directly to the outdoors. Similarly, central vacuum systems must be vented directly outdoors to exhaust the finer particles that pass through their filters.
Combustion. Water and carbon dioxide are always produced during combustion of hydrocarbons in air. Dangerous compounds are created, as well. All these products of combustion must be vented directly outdoors, preferably using sealed combustion or direct-vent equipment. Venting must meet or exceed all applicable codes. For buildings with naturally aspirated combustion appliances, excessive depressurization of the building by exhaust systems must be avoided to eliminate backdrafting. Consider a depressurization safety test, such as described in ASTM Standard E1998 or CGSB Standard 51.71. Fireplace combustion products should be isolated from the occupied space using tight-fitting doors and outdoor air intakes, when necessary. Flues and chimneys must be designed and installed to disperse combustion products well away from air intakes and operable windows, for example. Chapter 35 of the 2016 ASHRAE Hand- book—HVAC Systems and Equipment has more information on venting systems. Exhaust hoods and fans for ranges and cooktops must vent outdoors.
Carbon monoxide is one of the most unwelcome indoor contaminants, and in significant concentration, poses an imminent threat to life. It can come from virtually any source of combustion, including from motorized vehicles and generators (Emmerich et al. 2013). Even combustion appliances that meet manufacturers’ specifications can interact with the building and emit carbon monoxide. At least one carbon monoxide alarm meeting safety standards such as CSA Standard 6.19 should be installed near sleeping areas in each dwelling, including each unit of multifamily residential buildings, that has combustion appliances (e.g., fireplaces, stoves, furnaces, water heaters) within the pressure boundary, or has attached garages or storage sheds. Carbon monoxide alarms also should be considered for nonresidential buildings: poisonings have occurred in many building types, including hotels, motels, stores, restaurants, nursing homes, dormitories, laundromats, and schools.
Garages. Garages and storage spaces often contain many sources of contaminants. Doors between them and occupied spaces must be well sealed with gaskets or weatherstripping, including their sills, and possibly be self closing. Depressurized sections of HVAC systems for the regularly occupied portions of residences, such as the systems’ air handlers or return or intake ducts, should not be located in garages. If such sections must pass through garages, they must be well sealed and never have registers or grilles installed in the garages or storage spaces; if such spaces need conditioning, they must use their own isolated systems. Take care to ensure that there is a good pressure barrier between the garage and the occupied
16.21
space, typically using an air/moisture retarder such as heavy polyethylene as well as excellent sealing of the door between. Carbon monoxide sources may be present in garages, so pressure barriers, fire-rated compartmentation, and ventilation of attached residences are life-safety measures. Separate ventilation systems that slightly depressurize attached garages and storage spaces and that exhaust directly outdoors should be considered, especially when these support spaces are tightly constructed or are in cold climates. Several studies (Batterman et al. 2006; Emmerich et al. 2003; Fugler 2004) of contaminant sources and transport in garages found that, in some cases, significant fractions of infiltration air enter houses from attached garages, and that modern residential garages are tighter than older garages to reduce energy consumption and to improve comfort; garages were previously assumed to be leaky enough to avoid many related IAQ problems.
Particulates. The ventilation system should be designed such that return and any outdoor air is well filtered before passing through the thermal conditioning components of the HVAC system. Pressure drops associated with this filtration must be considered in the design and installation of the air-handling system. Particulate filters or air cleaners should have a minimum efficiency of 60% for 3 m particles, which is equivalent to a MERV 6 designated filter according to ASHRAE Standard 52.2.
Microbiologicals. Because ventilation can increase the source as well as removal rates of various air pollutants, it is, at best, moderately effective at reducing exposures to many airborne microbiologicals. Ventilation can, however, be part of the moisture balance that is critical to retarding fungal growth on surfaces and spores released into the air, depending on indoor and outdoor conditions.
Radon and Other Soil Gases. Buildings are exposed to gases and water that migrate through the soil into occupied spaces through cracks or other leaks. Soil gases vary with time and conditions, and can contain toxins from pesticides, landfills, fuels, or sewers, but the highest-profile pollutant in this category is radon and its radioactive- decay-produced “daughters.” Source control measures, such as differential pressure control and ground-to-building airtightening, are far more effective than ventilation mechanisms at controlling exposure to soil gas in buildings. See Chapter 11 for more information.
Volatile Organic Compounds (VOCs). VOCs are ubiquitous in modern life. Examples of products that emit VOCs include manufactured wood products, paints, stains, varnishes, solvents, pesticides, adhesives, wood preservatives, waxes, polishes, cleansers, lubricants, sealants, dyes, air fresheners, fuels, plastics, copy machines, printers, tobacco products, perfumes, cooking by-prod- ucts, and dry-cleaned clothes. Whenever possible, VOCs and other toxic compounds should be stored outside the occupied space in loosely constructed or ventilated enclosures such as garden sheds or detached garages, and away from occupied buildings’ ventilation intakes and operable windows. When unusual amounts of such compounds are present, consider using additional ventilation should be considered (e.g., extra ventilation during and for a while after construction projects). Reduced-VOC-emitting products are often available.
Outdoor Air. Outdoor air may at times contain unacceptably high levels of pollutants, including ozone, pollen, carbon monoxide, particulate matter, odors, or toxic agents. At such times, it may be impossible to provide acceptable indoor air quality using solely outdoor air, and increased ventilation rates can actually decrease indoor air quality. In locations where this problem may be anticipated, provide automatic or manual controls to allow temporary reduction of the ventilation rate. If these events are frequent, consider a means to more effectively clean recirculated air during these times.
Local Exhaust
After source elimination, the single most important source control mechanism in dwellings is local exhaust. Kitchens, utility

Licensed for single user. © 2017 ASHRAE, Inc.
This file is licensed to John Murray (John9@gmail.com). Publication Date: 6/1/2017
16.22 |
2017 ASHRAE Handbook—Fundamentals (SI) |
rooms, bathrooms, and other spaces designed to allow specific contaminant releases should be provided with local exhaust that is vented to the outdoors. Workshops, recreation rooms, smoking areas, art studios, greenhouses, and hobby rooms may also require local ventilation and/or air cleaning to remove contaminants generated by the activities involved. Contaminants of concern should be evaluated to determine how much additional ventilation is required. Many of these rooms can be adequately ventilated by following the requirements for kitchens or bathrooms. If unvented combustion appliances must be used, rooms with these appliances should also meet general ventilation requirements for kitchens, because such appliances generate significant amounts of moisture and, often, ultrafine particles, even when operating properly.
Mechanical exhaust (i.e., a fan with ducting to the outdoors) with adequate makeup air is the preferred method for providing local ventilation. Normally, such an exhaust system is designed to operate intermittently under manual control to send contaminated air outdoors when occupants recognize the need for ventilation. However, in many circumstances, a continuous, lower-flow-rate exhaust can work as well. Specific provisions for intermittent versus continuous exhaust rates are typically included in ventilation standards such as ASHRAE Standard 62.2; some example information is provided here.
Continuous Local Mechanical Exhaust. A continuously operating mechanical exhaust system is intended to operate without occupant intervention. This exhaust may be part of a balanced whole-building mechanical ventilation system. The system should be designed to operate during all hours in which the dwelling is occupied. Override control, to provide higher exhaust rates when needed, should be provided. The minimum delivered ventilation should be at least that given in Table 1.
Intermittent Local Mechanical Exhaust. An intermittently operating local mechanical exhaust is intended to be operated as needed by the occupant. Shutoff timers, occupancy controls, multi- ple-speed fans, and switching integral with room lighting are helpful, provided they do not impede occupant control. The minimum airflow rate should be at least that given in Table 2.
Alternatives. Cleaning recirculated air can sometimes be substituted for local exhaust, if it can be shown to be effective and reliable in removing contaminants of concern. Natural ventilation is not generally a suitable method for local exhaust and ventilation air needs in many climates and spaces. Using natural ventilation can cause reentrainment problems when contaminated exhaust or exfiltrating air reenters the building. In milder climates, natural ventilation may be acceptable when the contaminant of concern is related to odor rather than health or safety. Purpose-designed passive exhaust systems have shown acceptable ventilation in some European settings, and may be considered in lieu of mechanical systems. Axley (2001b) discusses evaluation and design of passive residential ventilation systems further.
Whole-House Ventilation
Although control of significant sources of pollution in a dwelling is important, whole-house ventilation through centrally introduced, conditioned, and distributed outdoor air may still be needed. Each dwelling should be provided with outdoor air according to code adopted by the local jurisdiction; general guidance according to ASHRAE Standard 62.2 is given in Table 3 of this chapter. The rate is the sum of the Area-Based and Occupancy-Based columns. Design occupancy expectations in the United States can be based on the number of bedrooms as follows: first bedroom, two persons; each additional bedroom, one person. Additional ventilation should be considered when occupant densities exceed one person per 25 m3.
Natural whole-house ventilation that relies on occupant operation should not be used to make up any part of the minimum total whole-house ventilation air requirement. However, because
Table 1 Continuous Exhaust Airflow Rates
Application |
Airflow Rate |
Notes |
|
|
|
Enclosed kitchen |
5 ach |
Based on kitchen volume |
Restroom |
10 L/s |
Not less than 2 ach |
|
|
|
Table 2 Intermittent Exhaust Airflow Rates
Application |
Airflow Rate |
Notes |
|
|
|
Kitchen |
50 L/s |
With a vented range hood |
|
150 L/s |
With other exhaust fans, including |
|
|
downdraft |
Restroom |
25 L/s |
Not less than 2 ach |
|
|
|
Table 3 Total Ventilation Air Requirements
Area Based |
Occupancy Based |
|
|
0.15 L/s per square metre of |
3.5 L/s per person, based on normal |
floor space |
occupancy |
|
|
occupancy and sources vary significantly, the capacity to ventilate above minimum rates can be provided by operable exterior openings such as doors and windows.
Air Distribution
Ventilation air should be provided to each habitable room through mechanical and natural air distribution. If a room does not have a balance between air supply and return or exhaust, pathways for transfer air should be provided. These pathways may be door undercuts, transfer ducts with grilles, or simply grilles where ducts are not necessary; however, building codes must be checked, because compartmentation requirements for limiting fire and smoke movement may restrict transfer air means or require rated fire and smoke dampers, for example.
In houses without central air handlers, special provisions to distribute outdoor air may be required. Rooms in which occupants spend many continuous hours, such as bedrooms, may require special consideration. Local and whole-house ventilation equipment should be chosen to be energy efficient, easy to maintain, reliable, durable, and quiet. Consider using heat recovery, especially in cold climates.
Selection Principles for Residential Ventilation Systems
Occupant comfort, energy efficiency, ease of use, service life, initial and life-cycle costs, value-added features, and indoor environmental quality should be considered when selecting a strategy and system. Poorly designed, installed, or maintained HVAC and related systems can be potential contributors to poor indoor air quality. For example, occupants may not use the ventilation systems as intended if operation results in thermal or acoustical discomfort or excessive energy use. The resulting lack of ventilation might produce poor indoor air quality. Therefore, careful design, construction, commissioning, operation, and maintenance is necessary to provide optimum effectiveness.
All exhaust, supply, or air handler fans have the potential to change the pressure of an indoor space relative to the outdoors. High-flow fans, such as in the air handler and with some cooking exhausts, can cause significant depressurization, particularly in tightly constructed homes. Considering these effects is essential in design. Excessive depressurization of the living space relative to outdoors may cause backdrafting of combustion appliances and increased migration of contaminants such as radon or other soil gases, car exhaust, or insulation particles into the living space. Depressurization can also result in increased moisture intrusion into building cavities in warm, moist climates and may cause more structural damage and fungal growth. Pressurization of the living space can cause condensation in building cavities in cold climates, also resulting in structural damage. Excess pressure can best be prevented by balancing
Licensed for single user. © 2017 ASHRAE, Inc.
This file is licensed to John Murray (John9@gmail.com). Publication Date: 6/1/2017
Ventilation and Infiltration
ventilation and exhaust systems and tightly sealing duct systems. In addition, adequate pathways must be available for all return air to the air-handling devices.
Occupant activities, operation of exhaust fans, and leaky ducts may depressurize the structure. Options to address backdrafting concerns include
•Using combustion appliances with sealed combustion systems
•Locating combustion appliances in a ventilated room isolated from depressurized zones by well-sealed partitions
•Providing supply or makeup air to balance exhaust from the zone
•Testing to ensure that depressurization is not excessive
The system must also be designed, built, operated, and maintained in a way that discourages growth of biological contaminants. Typical precautions include sloping condensate drain pans toward the drain, keeping condensate drains free of obstructions, keeping cooling coils free of dirt and other obstructions, maintaining humidifiers, and checking for and eliminating any cause of moisture inside ducts. Additional information on residential ventilation system design and IAQ control may be found in ASHRAE
Guideline 24.
10. SIMPLIFIED MODELS OF RESIDENTIAL VENTILATION AND INFILTRATION
This section describes several calculation procedures, ranging from simple estimation techniques to more physical models. Orme (1999) provides a more thorough review of simplified models. For energy modeling or code compliance, a particular building’s air change rate cannot be reliably deduced from the building’s construction or age, or from a simple visual inspection. Some measurement is necessary, such as a pressurization test of envelope airtightness or a detailed quantification of the leakage sites and their magnitude. The air change rate of a building may be calculated given (1) the location and leakage function for every opening in the building envelope and between major building zones, (2) the wind pressure coefficients over the building envelope, and (3) any mechanical ventilation airflow rates. These data are generally unavailable for all except very simple structures or extremely well studied buildings. Therefore, their values must be assumed. The appropriateness of these assumptions influences the accuracy of predictions of air change rates.
Empirical Models
These models of residential infiltration are based on statistical fits of infiltration rate data for specific houses. They use pressurization test results to account for house airtightness and take the form of simple relations between infiltration rate, an airtightness rating, and, in most cases, weather conditions. Empirical models account for envelope infiltration only and do not include intentional ventilation. In one approach, the calculated air change rate at 50 Pa based on a pressurization test is simply divided by a constant approximately equal to 20 (Sherman 1987). This technique does not account for the effect of infiltration-driving mechanisms on air exchange. Empirical models that do account for weather effects have been developed by Kronvall (1980), Reeves et al. (1979), and Shaw (1981).
The latter two models account for building air leakage using the values of c and n from Equation (40). The only other data required are wind speed and temperature difference. These empirical models predict long-term (one-week) infiltration rates very well in the houses from which they were developed; they do not, however, work as well in other houses because of the building-specific nature of leakage distribution, wind pressure, and internal partitioning. Persily (1986) and Persily and Linteris (1983) compared measured
16.23
and predicted house infiltration rates for these and other models. The average long-term differences between measurements and predictions are generally about 40%, although individual predictions can be inaccurate by 100% or more (Persily 1986; Walker and Wilson 1998).
Multizone Models
Multicell models of airflow in buildings treat buildings as a series of interconnected zones and assume that air within each zone is well mixed. Several such models have been developed by Allard and Herrlin (1989), Etheridge and Alexander (1980), Feustel and Raynor-Hoosen (1990), Herrlin (1985), Liddament and Allen (1983), Walton (1984, 1989), and Walton and Dols (2003). They are all based on a mass balance for each zone of the building. These mass balances are used to solve for interior static pressures in the building by requiring that inflows and outflows for each zone balance to zero. The user must provide information describing building envelope leakage, values to account for wind pressure on the building envelope, temperatures for each zone, and any mechanical ventilation airflow rates. Wind pressure coefficient data in the literature, air leakage measurement results from the building or its components, and air leakage data from research can be used as estimates. These models not only solve for whole-building and individual zone air change rates, but also determine airflow rates and pressure differences between zones. These interzone airflow rates are useful for predicting pollutant transport within buildings with well mixed zones. Chapter 13 has more details on multizone airflow and IAQ modeling.
Single-Zone Models
Several procedures have been developed to calculate building air change rates that are based on physical models of the building interior as a single zone. These single-zone models are only appropriate for buildings with minimal internal resistance to airflow, and are therefore inappropriate for large, multizone buildings. Some models of this type have been developed by Cole et al. (1980), Sherman and Grims-rud (1980), Walker and Wilson (1998), and Warren and Webb (1980). The section on Residential Calculation Examples uses both basic and enhanced models (Bradley 1993; CHBA 1994; Hamlin and Pushka 1994; Palmiter and Bond 1994; Walker and Wilson 1998).
The basic model uses effective air leakage area AL at 4 Pa, which can be obtained from a whole-building pressurization test. The enhanced model uses pressurization test results to characterize house air leakage through leakage coefficient c and pressure exponent n. The enhanced model improves on the basic model by using a power law to represent envelope leakage, including a flue as a separate leakage path, and having separate wind effects for houses with crawlspaces or basements instead of slab-on-grade foundations.
For both models, the user must provide the wind speed, the temperature difference, information on the distribution of leakage over the building envelope, a wind shelter parameter or local shielding for the basic model, and a terrain coefficient. The predictive accuracy of the enhanced model can be very good, typically ±10% when parameters are well known for the building in question (Palmiter and Bond 1994; Sherman and Modera 1986; Walker and Wilson 1998). All models’ results are sensitive to the user-provided data, and some of these parameters are often quite difficult to determine.
Superposition of Wind and Stack Effects
Simplified physical models of infiltration solve the problem of two natural driving forces (wind and stack) separately and then combine them in a process called superposition. Superposition is necessary because each physical process can affect internal and external air pressures on the building’s envelope, and can cause interactions between physical processes that are otherwise independent. An exact

Licensed for single user. © 2017 ASHRAE, Inc.
This file is licensed to John Murray (John9@gmail.com). Publication Date: 6/1/2017
16.24
solution is impossible, because (1) detailed properties of all the building leaks are unknown and (2) leakage is a nonlinear process. Therefore, most modelers have developed a simplified superposition process to combine stack and wind effects. Sherman (1992b) compared various superposition procedures and derived a generalized superposition equation involving simple leakage distribution parameters, and showed that the result is always subadditive. Typically, only 35% of infiltration from the smaller effect can be added to the larger effect. Depending on the specific building and conditions, that percentage could go as high as 85% or as low as zero. Walker and Wilson (1993) compared several superposition techniques to measured data. Sherman, as well as Walker and Wilson, found quadrature, shown in Equation (47), to be a robust superposition technique:
Q = |
Q |
2 |
+ Q |
2 |
(47) |
|
|
s |
|
w |
|
The following sections discuss how superposition is combined with calculation of wind and stack flows to determine total flow.
Residential Calculation Examples
2017 ASHRAE Handbook—Fundamentals (SI)
•X = 0 (equal amounts of leakage in the floor and ceiling)
•Heights of one-, two-, and three-story buildings = 2.5, 5.0, and 7.5 m, respectively
Example 2. Estimate the infiltration at winter design conditions for a twostory house in Lincoln, Nebraska. The house has effective air leakage area of 500 cm2 and volume of 340 m3, and the predominant wind is perpendicular to the street (shelter class 3). The indoor air temperature is 20°C.
Solution: The 99% design temperature for Lincoln is –19°C. Assume a design wind speed of 6.7 m/s. From Equation (48), with Cs = 0.000 290 from Table 4 and Cw = 0.000 231 from Table 6, the airflow rate caused by infiltration is
500 |
0.000 290 39 + 0.000 231 6.7 |
2 |
|
Q = ----------- |
|
||
1000 |
|
|
|
= 0.0736 m3/s = 265 m3/h
From Equation (2), air change rate I is equal to Q divided by the building volume:
I = (265 m3/h)/340 m3 = 0.78 h–1 = 0.78 ach
Basic Model. The following calculations are based on the Sherman and Grimsrud (1980) model, which uses the effective air leakage area at 4 Pa. This leakage area can be obtained from a whole-building pressurization test. Using effective air leakage area, the airflow rate from infiltration is
AL |
C |
|
T |
|
+ C |
|
U |
2 |
(48) |
Q = ----------- |
|
|
|
|
|||||
1000 |
|
s |
|
|
|
w |
|
|
|
where
Q = airflow rate, m3/s
AL = effective air leakage area, cm2 Cs = stack coefficient, (L/s)2/(cm4·K)
T = average indoor-outdoor temperature difference for time interval of calculation, K
Cw = wind coefficient, (L/s)2/[cm4·(m/s)2]
U= average wind speed measured at local weather station for time interval of calculation, m/s
Table 4 shows values of Cs for one-, two-, and three-story houses. The value of wind coefficient Cw depends on the local shelter class
of the building (Table 5) and the building height. Table 6 shows values of Cw for one-, two-, and three-story houses in shelter classes
1 to 5. In calculating values in Tables 4 and 6, the following assumptions were made:
•Terrain used for converting meteorological to local wind speeds is that of a rural area with scattered obstacles
•R = 0.5 (half the building leakage in the walls)
Table 4 Basic Model Stack Coefficient Cs
|
|
House Height (Stories) |
|
|
|
|
|
|
One |
Two |
Three |
|
|
|
|
Stack coefficient |
0.000 145 |
0.000 290 |
0.000 435 |
|
|
|
|
|
Table 5 Local Shelter Classes |
|
|
Shelter Class |
Description |
1No obstructions or local shielding
2Typical shelter for an isolated rural house
3Typical shelter caused by other buildings across street from building under study
4Typical shelter for urban buildings on larger lots where sheltering obstacles are more than one building height away
5Typical shelter produced by buildings or other structures immediately adjacent (closer than one house height: e.g., neighboring houses on same side of street, trees, bushes)
Example 3. Predict the average infiltration during a one-week period in January for a one-story house in Portland, Oregon. During this period, the average indoor/outdoor temperature difference is 17 K, and average wind speed is 2.7 m/s. The house has volume of 255 m3 and effective air leakage area of 690 cm2, and it is located in an area with buildings and trees within 10 m in most directions (shelter class 4).
Solution: From Equation (48), the airflow rate caused by infiltration is
690 |
0.000 |
145 17 + 0.000 |
104 2.7 |
2 |
|
Q = ----------- |
|
||||
1000 |
|
|
|
|
|
= 0.0392 m3/s = 141 m3/h The air change rate is therefore
I = 141/255 = 0.55 h–1 = 0.55 ach
Example 4. Estimate the average infiltration over the heating season in a two-story house with volume of 310 m3 and leakage area of 848 cm2. The house is located on a lot with several large trees but no other close buildings (shelter class 3). Average wind speed during the heating season is 3.2 m/s, and the average indoor/outdoor temperature difference is 20 K.
Solution: From Equation (48), the airflow rate from infiltration is
848 |
0.000 |
290 20 + 0.000 |
231 3.2 |
2 |
|
Q = ----------- |
|
||||
1000 |
|
|
|
|
|
= 0.077 m3/s = 276 m3/h
The average air change rate is therefore
I = 276/310 = 0.89 h–1 = 0.89 ach
Enhanced Model. This section presents a simple, single-zone approach to calculating air infiltration rates in houses based on the Walker and Wilson (1998) model. The airflow rate from stack and wind infiltration is
Q |
s |
= cC |
Tn |
(49) |
|||
|
|
|
|
s |
|
|
|
Q |
w |
= cC |
w |
(sU)2n |
(50) |
||
where
Qs = stack airflow rate, m3/s
Table 6 Basic Model Wind Coefficient Cw
Shelter |
|
House Height (Stories) |
|
|
|
|
|
Class |
One |
Two |
Three |
|
|
|
|
1 |
0.000 319 |
0.000 420 |
0.000 494 |
2 |
0.000 246 |
0.000 325 |
0.000 382 |
3 |
0.000 174 |
0.000 231 |
0.000 271 |
4 |
0.000 104 |
0.000 137 |
0.000 161 |
5 |
0.000 032 |
0.000 042 |
0.000 049 |
|
|
|
|

Licensed for single user. © 2017 ASHRAE, Inc.
This file is licensed to John Murray (John9@gmail.com). Publication Date: 6/1/2017
Ventilation and Infiltration
Qw = wind airflow rate, m3/s
c = flow coefficient, m3/(s·Pan) Cs = stack coefficient, (Pa/K)n Cw = wind coefficient, (Pa·s2/m )n
s = shelter factor
T = indoor – outdoor temperature difference, K n = pressure exponent
16.25
Qs = (0.051)(0.089)[20 – (–19)]0.67 = 0.053 m3/s
The wind flow is calculated using Equation (50):
Qw = (0.051)(0.156)(0.64 3.95)1.34 = 0.027 m3/s
Substituting Qs and Qw into Equation (47) gives Q = 0.059 m3/s = 214 m3/h. From Equation (2), air change rate I is equal to Q divided by the building volume:
In calculating tabulated values of Cs, Cw , and s, the assumptions were
•Each story is 2.5 m high.
•The flue is 15 cm in diameter and reaches 2 m above the upper ceiling.
•The flue is unsheltered.
•Half of envelope leakage (not including the flue) is in the walls and one-quarter each is at the floor and ceiling, respectively.
•n = 0.67
The following examples use typical values for terrain factors, house height, and wind speed measurement height, wind speed multiplier G given in Table 7, and use a relationship based on equations found in Chapter 24.
Example 5. Estimate the infiltration at winter design conditions for a two-story slab-on-grade house with a flue in Lincoln, Nebraska. The house has a flow coefficient of c = 0.051 m3/(s·Pan) and a pressure exponent of n = 0.67 (corresponding to effective leakage area of 500 cm2 at 4 Pa). The building volume is 340 m3. The 97.5% design temperature is –19°C, and design wind speed is 6.7 m/s.
Solution: For a slab-on-grade two-story house with a flue, Table 8 gives Cs = 0.089 (Pa/K)n and Cw = 0.156 (Pa·s2/m2)n. The house is maintained at 20°C indoors. The building wind speed is determined by taking the design wind speed Umet and applying by the wind speed multiplier G from Table 7:
U = GUmet = 0.59(6.7) = 3.95 m/s
From Table 5, the shelter class for a typical urban house is 4. Table 9 gives the shelter factor for a two-story house with a flue and shelter class 4 as s = 0.64. The stack flow is calculated using Equation (49):
Table 7 Enhanced Model Wind Speed Multiplier G
|
House Height (Stories) |
||
|
|
|
|
|
One |
Two |
Three |
|
|
|
|
Wind speed multiplier G |
0.48 |
0.59 |
0.67 |
|
|
|
|
Table 8 Enhanced Model Stack and Wind Coefficients
|
One Story |
|
Two Story |
|
Three Story |
|||
|
|
|
|
|
|
|
|
|
|
|
With |
|
|
With |
|
|
With |
|
No Flue |
Flue |
|
No Flue |
Flue |
|
No Flue |
Flue |
|
|
|
|
|
|
|
||
Cs |
0.054 |
0.069 |
0.078 |
0.089 |
0.098 |
0.107 |
||
Cw for slab-on- |
0.156 |
0.142 |
0.170 |
0.156 |
0.170 |
0.167 |
||
grade |
|
|
|
|
|
|
|
|
Cw for crawl- |
0.128 |
0.128 |
0.142 |
0.142 |
0.151 |
0.154 |
||
space |
|
|
|
|
|
|
|
|
I = (214 m3/h)/340 m3 = 0.63 h–1 = 0.63 ach
Example 6. Estimate the average infiltration over a one-week cold-weather period for a single-story house with a crawlspace in Redmond, Washington. The house has a flow coefficient of c = 0.078 m3/(s·Pan) and a pressure exponent of n = 0.6 (corresponding to effective leakage area of 690 cm2 at 4 Pa). The building volume is 255 m3. During this period, the average indoor-to-outdoor temperature difference is 16 K, and wind speed is 2.7 m/s. The house is electrically heated and has no flue.
Solution: For a single-story house with no flue, Cs =0.054 (Pa/K)n. For a crawlspace, Cw = 0.128 (Pa·s2/m2)n. From Table 7, for a one-story house, G = 0.48.
U = GUmet = 0.48(2.7) = 1.3 m/s
Table 9 gives shelter factor s = 0.50 for a house with no flue and shelter class 4. Stack flow is calculated using Equation (49):
Qs = (0.078)(0.054)(16)0.6 = 0.022 m3/s
Wind flow is calculated using Equation (50):
Qw = (0.078)(0.128)(0.50 1.3)1.34 = 0.006 m3/s
Substituting Qs and Qw into Equation (47) gives Q = 0.023 m3/s = 83 m3/h. From Equation (2), air change rate I is equal to Q divided by the building volume:
I = (83 m3/h)/(255 m3) = 0.32 h–1 = 0.32 ach
Example 7. Estimate the infiltration for a three-story house in San Francisco, California. The house has a flow coefficient of c = 0.102 m3/(s·Pan) and a pressure exponent of n = 0.67 (corresponding to effective leakage area of 1000 cm2 at 4 Pa). The building volume is 395 m3. The indoor/ outdoor temperature difference is 5 K and wind speed is 4.47 m/s. The house has a flue and a crawlspace.
Solution: For a three-story house with a flue, Cs = 0.107(Pa/K)n. For a crawlspace, Cw = 0.154 (Pa·s2/m2)n. From Table 7, for a three-story house, G = 0.67.
|
U = GUmet = |
0.67(4.47) = 3.0 m/s |
The |
prevailing wind blows |
along the row of houses parallel to |
the |
street, so the house has a shelter class of 5. Table 9 gives the shelter |
|
factor for a three-story house with a flue and shelter class 5 as s = 0.43.
Qs = (0.102)(0.107)(5)0.67 = 0.032 m3/s
Qw = (0.102)(0.154)(0.43 3.0)1.34 = 0.022 m3/s
Substituting Qs and Qw in Equation (47) gives Q = 0.039 m3/s = 140 m3/h. The air changes per hour are
I = (140 m3/h)/(395 m3) = 0.35 h–1 = 0.35 ach
Table 9 Enhanced Model Shelter Factor s
Shelter |
|
One Story |
Two Story |
Three Story |
Class |
No Flue |
with Flue |
with Flue |
with Flue |
|
|
|
|
|
1 |
1.00 |
1.10 |
1.07 |
1.06 |
2 |
0.90 |
1.02 |
0.98 |
0.97 |
3 |
0.70 |
0.86 |
0.81 |
0.79 |
4 |
0.50 |
0.70 |
0.64 |
0.61 |
5 |
0.30 |
0.54 |
0.47 |
0.43 |
|
|
|
|
|
Combining Residential Infiltration and Mechanical Ventilation
Significant infiltration and mechanical ventilation often occur simultaneously in residences. The pressure difference from Equation (31) can be used for each building leak, and the flow network (including mechanical ventilation) for the building can be solved to find the airflow through all the leaks while accounting for the effect of the mechanical ventilation. However, for simplified models, natural infiltration and mechanical ventilation are usually determined

Licensed for single user. © 2017 ASHRAE, Inc.
This file is licensed to John Murray (John9@gmail.com). Publication Date: 6/1/2017
16.26
separately and require a superposition method to combine the flow rates.
Sherman (1992b) compared various procedures and derived a generalized superposition equation that involves simple leakage distribution parameters. The result is always subadditive. For small, unbalanced fans, typically only half the mechanically introduced outdoor airflow contributes to the total, but this fraction can be anywhere between 0 and 100%, depending on leakage distribution. When the makeup air fan’s flow rate is large, infiltration may be ignored, because the building becomes either neutrally or positively pressurized.
In special cases when the leakage distribution is known and highly skewed, it may be necessary to work through the superposition method in more detail. For example, in a wind-dominated situation, a makeup air fan has a much bigger effect than an exhaust fan on changing the total ventilation rate; the same is true for houses with high neutral pressure levels in cold climates. For the general case, when details are not known or can be assumed to be broad and typical, the following superposition gives good results:
Q |
= Q |
+ |
Q2 |
+ Q 2 |
(51) |
comb |
bal |
|
unbal |
infiltration |
|
Typical Practice
The preceding sections on estimating infiltration in low-rise residences represent current analytical techniques typically used for research and remediation purposes, but most small residential buildings are designed and constructed without direct involvement of ventilation engineers. Contractors, who typically prepare these buildings’ designs, are required to follow mandates in various codes and standards, and they apply experience-based rules of thumb when determining, for example, exhaust needs. Often, leaky buildings or air quality problems result. Research and experience have shown that tightening building envelopes and using mechanical ventilation with heat recovery can improve indoor air quality and reduce energy consumption. Retaining the services of a ventilation engineer before construction begins is advisable in some situations.
11.COMMERCIAL AND INSTITUTIONAL
AIR LEAKAGE
Envelope Leakage
ASTM Standard E779 and CGSB Standard 149.10 include methods to measure the airtightness of building envelopes of singlezone buildings. Although many multizone buildings can be treated as single-zone buildings for testing by opening interior doors or by inducing equal pressures in adjacent zones, these standards provide no guidelines for dealing with problems arising in tall buildings, such as stack and wind effects. Tall buildings require refinement and extensions of established procedures because they have obstacles to accurate measurement not present in small buildings, including large envelope leakage area, interfloor leakage, vertical shafts, and large wind and stack pressures. Chapter 4 in the 2015 ASHRAE Handbook—HVAC Applications discusses tall buildings and their challenges in detail.
For conducting a pressurization test in a large building, the building’s own air-handling equipment sometimes can be used to induce test pressures, as described in CGSB Standard 149.15. In other cases, a large fan is brought to the building to perform the test, as described by CIBSE Standard TM23. ASHRAE RP-1478’s final report (Anis and Brennan 2014) discusses how to test the envelope leakage of large commercial buildings.
In the past, building envelopes of large commercial buildings were often assumed to be quite airtight. Tamura and Shaw (1976a) found that, assuming a flow exponent n of 0.65 in Equation (40), air leakage measurements in eight Canadian office buildings with sealed windows ranged from 610 to 2440 cm3/(s·m2). Persily and Grot (1986) performed whole-building pressurization tests in large
2017 ASHRAE Handbook—Fundamentals (SI)
office buildings that showed that pressurization airflow rate divided by building volume was relatively low compared to that of houses. However, if these airflow rates are normalized by building envelope area instead of by volume, the results indicate envelope airtightness levels similar to those in typical North American houses. The same study also looked at eight U.S. office buildings and found air leakage ranging from 1080 to 5220 cm3/(s·m2) at 75 Pa. This means that the office buildings’ envelopes were leakier than expected. Typical air leakage values per unit wall area at 75 Pa were 500, 1500, and 3000 cm3/(s·m2) for tight, average, and leaky walls, respectively (Tamura and Shaw 1976a).
Emmerich and Persily (2014) summarized available measured airtightness data for almost 400 buildings, including about 70 constructed between 2000 and 2010. The average air leakage for the buildings was 20% tighter than the average for the 228 buildings included in a similar 2011 analysis. The data were analyzed to determine factors that affect airtightness (e.g., building type, height). Recent additions to the database, previously reported by Emmerich and Persily (2005), include numerous buildings constructed to meet the specifications of sustainable building programs such as U.S. Green Building Council’s LEED® rating system, as well as buildings designed and constructed with air retarders. The overall average airtightness reported was 13.1 m3/(h·m2) for six-sided (i.e., including slabs and basement surfaces) envelope surface areas at 75 Pa. The data show only weak trends related to year of construction, height, floor area, wall construction, or building type, but do demonstrate that buildings designed and constructed with attention to airtightness are much tighter than typical commercial buildings. The analysis found that the 79 buildings with air retarders had an average air leakage almost 70% less than the average for the 290 buildings not specified as having air retarders, thus demonstrating the critical need to design and construct commercial buildings with dedicated air retarders to support sustainable building design. However, the wide variation among the measures taken to limit or reduce air leakage among these buildings and the lack of detailed descriptions of the air retarders make it difficult to predict a specific level of airtightness that will result from use of a specific air retarder approach.
In the United States, commercial building construction practices are addressed by various standards, codes, and green building program requirements, and Table 10 summarizes some of the relevant air leakage limits from these requirements. Both ASHRAE Standards 90.1 and 189.1 require continuous air barriers (CABs) for most commercial buildings. Since 2010, Standard 90.1 requires the CAB to meet either a material tightness limit [0.02 L/(s·m2) under a pressure differential of 75 Pa] or an assembly tightness limit [0.2 L/(s·m2) under a pressure differential of 75 Pa], but it does not include a whole-building tightness limit or a requirement for wholebuilding pressurization testing. The building commissioning requirements of Standard 189.1-2014 include a whole-building test demonstrating the building meets a tightness limit of 1.25 L/(s·m2) under a pressure differential of 75 Pa or the implementation of a rigorous envelope commissioning program.
The 2012 International Energy Conservation Code® (IECC®) (ICC 2012a) has requirements with options for a CAB with material or assembly tightness or a whole-building test. The 2012 International Green Construction Code® (IgCC®) (ICC 2012b) includes the same requirements as the 2012 IECC but also includes a wholebuilding testing requirement consistent with the U.S. Army Corps of Engineers (USACE 2009) value. Many U.S. state building codes currently or will include requirements for continuous air barriers either through reference to IECC, IGCC, ASHRAE Standard 90.1 or 189.1, or their own independent requirements; a current list of requirements is available at www.airbarrier.org.
Since 2009, the USACE has required that conditioned buildings be built or retrofitted to include a continuous air barrier to control air leakage through the building envelope (USACE 2009). The
Licensed for single user. © 2017 ASHRAE, Inc.
This file is licensed to John Murray (John9@gmail.com). Publication Date: 6/1/2017
Ventilation and Infiltration |
16.27 |
Table 10 Summary of Building Airtightness Data
|
Air Leakage, L/(s·m2) at 75 Pa |
||
Standard or Code |
Material |
Assembly |
Whole Building* |
|
|
|
|
ASHRAE 90.1 |
0.02 |
0.2 |
— |
ASHRAE 189.1 |
0.02 |
0.2 |
1.25 |
IECC |
0.02 |
0.2 |
2.0 |
IgCC |
Same as IECC |
Same as IECC |
1.25 |
USACE |
0.02 |
— |
1.25 |
GSA |
0.02 |
0.2 |
2.0 |
Notes: IECC= International Energy Conservation Code IgCC = International Green Construction Code USACE = U.S. Army Corps of Engineers
GSA = U.S. General Services Administration
*Whole-building limits are based on six-sided enclosure, including slab and belowgrade walls.
specification requires whole-building testing with a maximum leakage of 1.25 L/(s·m2) at 75 Pa based on the six-sided building enclosure area (including slab and subgrade walls). The average tightness for a set of 285 new and retrofitted USACE buildings was reported to be 0.9 L/(s·m2) (Zhivov 2013). Also, the U.S. General Services Administration (GSA 2010) since 2010 requires all new U.S. federal buildings for the Public Buildings Service to include an air barrier with the whole building having an air leakage rate of not more than 2.0 L/(s·m2) at 75 Pa.
Grot and Persily (1986) also found that eight recently constructed office buildings had infiltration rates ranging from 0.1 to 0.6 ach when outdoor air intakes were deactivated. Infiltration rates exhibited varying degrees of weather dependence, generally much lower than that measured in houses. Infiltration in commercial buildings can have many negative consequences, including reduced thermal comfort, interference with proper operation of mechanical ventilation systems, degraded indoor air quality, moisture damage of building envelope components, and increased energy consumption. These results suggest strongly that commercial buildings’ envelopes require tighter construction, and that continuous air barrier systems should be used in the enclosures of all conditioned buildings. Since 1997, the Building Environment and Thermal Envelope Council of the National Institute of Building Sciences has sponsored several symposia on air barriers for buildings in North American climates. Others have also published articles on the importance of limiting air leakage in commercial buildings (Anis 2001; Ask 2003; Fennell and Haehnel 2005).
Envelope leakage in commercial buildings also depends on HVAC system operation. Often, commercial buildings and their HVAC systems are in operation during normal daytime business hours but switch into “unoccupied” operation at nights and on weekends and holidays. If pressurized while their HVAC systems operate, infiltration is often very low or even eliminated in buildings with tight envelopes. However, in unoccupied mode, this pressurization is often lost, so infiltration and potentially moisture intrusion may be significant at times.
Air Leakage Through Internal Partitions
In large buildings, air leakage associated with internal partitions becomes very important. Walls, doors, floors, ceilings, plenums, chases, transfer ducts and grilles, and elevator and stairway enclosures are the major separations of concern in these buildings. Their leakage characteristics are needed in multizone models to predict infiltration through exterior walls and airflow patterns in a building. These internal resistances are also important in the event of a fire to predict smoke movement patterns and evaluate smoke management systems.
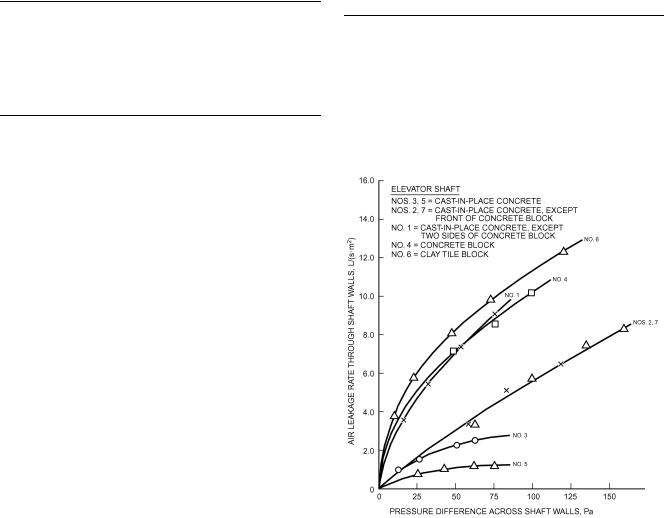
Table 11 gives air leakage areas calculated at 75 Pa with CD = 0.65 for different internal partitions of commercial buildings (Klote et al. 2012). Figure 13 presents examples of measured air leakage rates of
Table 11 Air Leakage Areas for Internal Partitions in Commercial Buildings (at 75 Pa and CD = 0.65)
Construction Element |
Wall Tightness |
Area Ratio |
|
|
|
|
|
AL/Aw |
Stairwell walls |
Tight |
0.14 10 4 |
|
Average |
0.11 10 3 |
|
Loose |
0.35 10 3 |
Elevator shaft walls |
Tight |
0.18 10 3 |
|
Average |
0.84 10 3 |
|
Loose |
0.18 10 2 |
|
|
AL/Af |
Floors |
Average |
|
0.52 10 4 |
||
AL = air leakage area |
Aw = wall area |
Af = floor area |
Fig. 13 Air Leakage Rates of Elevator Shaft Walls
elevator shaft walls (Tamura and Shaw 1976b), the type of data used to derive the values in Table 11. Consult Chapter 53 of the 2015
ASHRAE Handbook—HVAC Applications for performance models and applications of smoke control systems. As with the exterior shell, making significant effort to seal unintentional openings in internal partitions in large buildings can improve thermal comfort and energy efficiency, as well as improve the building’s performance in a fire.
Leakage paths, intentional or otherwise, at the top of elevator shafts are often equivalent to orifice areas of 0.4 to 1.0 m2. Air leakage rates through stair tower and elevator doors are shown in Figure 14 as a function of average crack width around the door. Sealing elevator and stair doors well, and possibly using indoor vestibules for them, can reduce air as well as smoke flow rates significantly. Air leakage areas associated with other openings in commercial buildings are also important for air movement calculations. These include interior doors and partitions, suspended ceilings in buildings where space above the ceiling is used for air supply or return, and other components of the air distribution system.
Air Leakage Through Exterior Doors
Door infiltration depends on the type and use of door, room, and building, and on air speed and pressure differentials. In residences

Licensed for single user. © 2017 ASHRAE, Inc.
This file is licensed to John Murray (John9@gmail.com). Publication Date: 6/1/2017
16.28 |
2017 ASHRAE Handbook—Fundamentals (SI) |
Fig. 14 Air Leakage Rate of Door Versus Average Crack Width
and small buildings where doors are used infrequently, a closed door is assumed, and air exchange can be estimated based on air leakage through cracks between door, frame, and sill. Where exterior door are used frequently, airflow through them increases significantly as door-opening frequency increases. Consider using vestibules or revolving doors for high-frequency applications.
Air Leakage Through Automatic Doors
Automatically swinging, sliding, rotating, or overhead doors are a major source of air leakage. They are normally installed where large numbers of people use the doors or where bulk goods or vehicles are transported through the doorways. These doors stay open longer with each use than manually operated doors. Air leakage through an automatic door can be reduced by installing a vestibule. However, pairs of automatic doors on the inside and outside of a vestibule normally have overlapping open periods, even when used by only one person at a time. Therefore, it is important that designers include airflow through automatic doors when calculating heating and cooling loads in adjacent spaces.
To calculate the average airflow rate through an automatic door, the designer must consider the area of the door, the pressure difference across it, the discharge coefficient of the door when it is open, and the fraction of time that it is open. Obtaining the discharge coefficient is complicated by the fact that it changes as the door opens and closes.
To simplify this calculation, ASHRAE research project RP-763 (Yuill 1996) developed Figure 15 to combine the discharge coefficients of doors as they open and close with the fraction of time that doors are open at a particular level of use. This figure presents an overall airflow coefficient as a function of the number of people using a door per hour. To obtain the average infiltration rate through an automatic door, multiply this coefficient by the door’s opening area and by the square root of the pressure difference between the outdoor and indoor air at the door’s location. The pressure difference across a door in a building is difficult to predict accurately and depends on wind pressure on the building, stack effect caused by the indoor/outdoor temperature difference, and effects of air-handling system operation. It also depends on leakage characteristics of the building’s exterior walls and of internal partitions.
Fig. 15 Airflow Coefficient for Automatic Doors
Fig. 16 Pressure Factor for Automatic Doors
Two simplified design methods are presented here. The first method uses practical assumptions to determine design values for Rp, the square root of the pressure difference across the automatic door, given in Figure 16. The second method requires explicit calculation of envelope pressures.
In Figure 16, airflows shown for outdoor air temperatures of 27 and 38°C, represented by dotted lines, are outward flows. They intercept the vertical axis at a lower point than the other lines because wind pressure coefficients on the building’s downwind face, where the greatest outward flows occur, are lower than on the upward face. In many buildings, air pressure in the building is controlled by varying the flow rate through return or exhaust fan(s) or by controlling the relief air dampers. These systems are usually set to maintain a pressure slightly above ambient in the lobby, but in a large building, multiple sensors may be used to regulate air pressure on each floor independently, for example. Subtracting the interior pressure maintained from the wind pressure gives the net pressure for estimating airflow through an exterior door.
Method 1. For the first method, the infiltration rate through the automatic door is
Q = CAARp |
(52) |
where
Q = airflow rate, L/s

Licensed for single user. © 2017 ASHRAE, Inc.
This file is licensed to John Murray (John9@gmail.com). Publication Date: 6/1/2017
Ventilation and Infiltration |
|
|
16.29 |
|||
CA = airflow coefficient from Figure 15, L/(s·m2 ·Pa0.5) |
Air Exchange Through Air Curtains |
|||||
A = area of the door opening, m2 |
|
|
|
Air curtains are jets of air projected across envelope openings |
||
Rp = pressure factor from Figure 16, Pa0.5 |
|
with the intention of reducing air exchange and the entrance of dust |
||||
Method 2. Airflow Q is |
|
|
|
and insects, for example. They are commonly applied to loading |
||
|
|
|
dock doorways and high-use building entrances. Performance of air |
|||
Q = CA A |
p |
(53) |
||||
curtains strongly depends on factors such as jet characteristics, |
||||||
where |
|
|
|
wind, and building pressurization. More discussion on air curtain |
||
|
|
|
performance is available in the research literature and in Chapter 20 |
|||
Q = airflow rate, L/s |
|
|
|
|||
|
|
|
of the 2016 ASHRAE Handbook—HVAC Systems and Equipment. |
|||
CA = airflow coefficient from Figure 15, L/(s·m2 ·Pa0.5) |
||||||
|
|
|||||
A = area of the door opening, m2 |
|
|
12. COMMERCIAL AND INSTITUTIONAL |
|||
p = pressure difference across door, Pa |
|
|
||||
|
|
VENTILATION |
||||
|
|
|
|
|
||
To find p, it is necessary to find the pressure differential created |
|
ASHRAE Standard 62.1 contains requirements on ventilation |
||||
by both wind and stack effect. To give the largest possible pressure |
and indoor air quality for commercial, institutional, and high-rise |
|||||
difference across the door, there are no interactions between the two |
residential buildings. These requirements address system and |
|||||
natural pressures: |
|
|
|
equipment issues, design ventilation rates, commissioning and sys- |
||
p = pw – ps |
(54) |
tems start-up, and operation and maintenance. The user’s manual |
||||
where |
|
|
|
for Standard 62.1-2010 (ASHRAE 2010b) provides details to help |
||
|
|
|
design, install, and operate building systems to meet requirements. |
|||
pw = wind-induced surface pressure relative to static pressure, Pa |
The design requirements include two alternative procedures: |
|||||
ps = pressure difference caused by stack effect, Pa |
• |
The prescriptive ventilation rate procedure (VRP) contains a |
||||
|
|
|
|
|||
Example Calculations |
|
|
|
|
table of outdoor air ventilation requirements for a variety of |
|
Find the maximum possible winter infiltration through an automatic |
|
space types, with adjustments for air distribution in rooms and |
||||
door on the ground floor of a 20-story building. The area of the door is |
|
systems serving multiple spaces. These requirements consist of |
||||
0.91 2.1 m = 1.9 m2. Each floor is 4 m high. Approximately 300 peo- |
|
both a per-person rate and a per-floor-area rate. Minimum out- |
||||
ple per hour pass through the door. The design wind conditions are |
|
door air ventilation rates are based, in part, on research by Berg- |
||||
6.7 m/s, indoor temperature is 21°C, and outdoor temperature is –7°C. |
|
|||||
|
Munch et al. (1986), Cain et al. (1983), Iwashita et al. (1989), and |
|||||
The airflow coefficient from Figure 15, using the line for doors without |
|
|||||
|
Yaglou et al. (1936), as well as years of experience of designers |
|||||
vestibules, is approximately 306 L/(s·m2 ·Pa0.5). |
|
|
||||
Method 1: |
|
|
|
|
and building operators. |
|
|
|
|
• |
The performance indoor air quality procedure (IAQP) seeks |
||
The pressure factor from Figure 16 is 9.6 Pa0.5. Equation (52) gives |
|
acceptable indoor air quality by controlling indoor contaminant |
||||
the door’s airflow as |
|
|
|
|
concentrations through source control, air cleaning, and ventila- |
|
|
|
|
|
|
||
Q = 306(1.9)9.6 = 5600 L/s |
|
|
tion. It allows for either or both improved indoor air quality and |
|||
Method 2: |
|
|
|
|
reduced energy consumption. Chapter 29 of the 2016 ASHRAE |
|
|
|
|
|
Handbook—HVAC Systems and Equipment has information on |
||
The worst possible case for wind surface pressure coefficient Cp at |
|
|||||
|
air cleaning. |
|||||
any point and in any position on the ground floor of the building is |
|
|||||
inferred from the figures in Chapter 24 to be about 0.75. Using this in |
|
The ventilation rate procedure is by far the more commonly used |
||||
Equation (25), together with |
the |
specified wind |
speed, results in |
because of its prescriptive nature. |
||
pw = 20 Pa. Assume that H is one-half the door height (1.1 m). To have |
|
Combining source control and local exhaust, as opposed to dilu- |
||||
maximum pressure across the door, assume the neutral pressure plane is |
|
|||||
tion with ventilation air, is the method of choice in many industrial |
||||||
located halfway up the building such that |
|
|||||
|
environments. Industrial ventilation is discussed in Chapters 31 and |
|||||
1 |
|
4 m |
|
|||
|
|
32 of the 2015 ASHRAE Handbook—HVAC Applications and in In- |
||||
HNPL = -- 20 stories ----------- = 40 m |
|
dustrial Ventilation: A Manual of Recommended Practice (ACGIH |
||||
2 |
|
story |
|
|||
Substituting these values into Equation (24) gives ps = –47 Pa. This |
2016). Ventilation of medical facilities, where high indoor air qual- |
|||||
ity is expected, is discussed in ASHRAE Standard 62.1, Chapter 8 |
||||||
is the maximum stack pressure difference given no internal resistance to |
||||||
airflow. To find the actual stack pressure difference, it is necessary to |
of the 2015 ASHRAE Handbook—HVAC Applications, and other |
|||||
multiply this by a draft coefficient. For this example, the coefficient is |
publications [e.g., FGI (2014)]. |
|||||
assumed to be 0.9, which is the highest value that has been found for |
|
Commercial and institutional building ventilation systems are |
||||
tall buildings. Therefore, ps = 0.9( –47 Pa) = – 42 Pa. The total pres- |
typically designed to provide slight pressurization to reduce infiltra- |
|||||
sure is then p = 20 – (–42) = 62 Pa. Substituting into Equation (53), |
tion. This pressurization is achieved by having the outdoor or make- |
|||||
|
|
|
|
|||
Q = 306(1.9) |
62 = 4580 L/s |
|
up airflow rate higher than the exhaust or relief airflow rate. In these |
|||
|
buildings, infiltration is therefore usually neglected in HVAC design |
|||||
If the building has a vestibule, the airflow coefficient is read from |
||||||
except in areas such as lobbies and loading docks, where infiltration |
||||||
Figure 15 using the line for doors with vestibules, and it is approxi- |
can be important because of doors. However, as discussed previous- |
|||||
mately 208 L/(s·m2 ·Pa0.5), reducing airflow to |
3100 L/s into the |
|||||
ly, this little to no infiltration may only be achieved in practice with |
||||||
building. |
|
|
|
|||
|
|
|
very tight envelope construction (e.g., including a continuous air |
|||
|
|
|
|
|||
Standard-sized revolving doors are often used where there is |
barrier). As discussed in the section on Driving Mechanisms for |
|||||
high use, but typically not where people would often be carrying |
Ventilation and Infiltration, wind and stack effect can also cause sig- |
|||||
large bags or pushing carts. Dols et al. (2014) applied a coupled |
nificant infiltration and exfiltration. Ventilation airflow rates for |
|||||
building energy and airflow simulation tool to simulate airflow |
commercial and institutional buildings are typically determined us- |
|||||
through entry doors in a prototype medium office building created |
ing procedures in ASHRAE Standard 62.1. In these procedures for |
|||||
by Ng et al. (2012) and found that using a vestibule reduced infil- |
designing mechanical ventilation systems, no credit is given for in- |
|||||
tration through the building entrance by 23%. More information on |
filtration. However, weather-driven pressure differentials may be |
|||||
predicting infiltration rates through standard and extra-large revolv- |
significant and need to be considered when designing the ventilation |
|||||
ing doors is still needed. |
|
|
|
system. |
||
Licensed for single user. © 2017 ASHRAE, Inc.
This file is licensed to John Murray (John9@gmail.com). Publication Date: 6/1/2017
16.30
Ventilation Rate Procedure
Per ASHRAE Standard 62.1, the design ventilation rate is determined starting with a table of minimum ventilation requirements for different space types. These requirements are expressed as an outdoor airflow rate per occupant or per unit floor area, or often both, depending on space type. These ventilation rates are based on air pollutants generated by people, activities, and building materials and furnishings. The rates are then adjusted for various parameters (e.g., multiple zones, type of room air distribution).
The HVAC designer faces several challenges in designing an air distribution system to deliver outdoor air to building occupants. The first is to determine whether the outdoor air is acceptable for use, and to design a system for cleaning the air if it is not acceptable. A second is to design an air intake and distribution system that will deliver the required level of outdoor air to the occupied portions of the building, and not just admit it to an air handler. This outdoor air must be delivered not only at design conditions, but throughout the year. The task is complicated by weather-related variations in indoor/outdoor pressure difference. Other complications include pressure variations caused by building components such as intermittent exhaust fans or dirty filters, and probably most significantly by supply flow variations associated with variable-air-volume (VAV) systems (Janu et al. 1995; Mumma and Wong 1990). This delivery issue is related to the discussion in the section on Air Change Effectiveness.
Multiple Spaces
Many commercial and institutional buildings have multiplezone, recirculating ventilation systems wherein one or more conventional air handlers condition a mixture of outdoor and recirculated air (supply air) to more than one ventilation zone. Each zone may have a different outdoor air fraction required by ASHRAE Standard 62.1, but each air handler can typically only provide one outdoor air fraction. Therefore, the zone that requires the greatest outdoor air fraction (the critical zone) defines the outdoor air intake rate of the air handler. Consequently, all other zones receive more outdoor air than their minimum requirement. These zones can be considered to have unused ventilation air, which could be returned to the air handler and recirculated; thus, the outdoor air fraction at the air handler could be reduced while still meeting the needs of the critical zone. A method to address multiple-zone recirculating systems, based on the system ventilation efficiency equation (SVEE), is provided in the ventilation rate procedure of Standard 62.1. ASHRAEsponsored research experimentally tested the validity of this equation and confirmed that the SVEE is a valid predictor of ventilation distribution in a building (Yuill et al. 2012).
Secondary Path Systems. Some systems circulate unused ventilation air through paths other than through the central air handler. Common examples include transfer fans and fan-powered boxes. Warden (1995) suggested that Standard 62.1 should allow for the increased distribution efficiency that is possible with these systems, and presented a generalized SVEE that includes secondary air paths. A form of this equation is given in Equation (A-3) of ASHRAE Standard 62.1-2010.
Equation (A-3) depends on the ventilating ability of the secondary air Er . The standard previously described Er in terms of the proportion of average system return air directly recirculated from the critical zone. Yuill et al. (2008) argued that the formulation of Equation (A-3) implicitly defines Er as a descriptor of the vitiation of the secondary air, and presented a formal definition of Er , a version of which was adopted for Standard 62.1. Under this definition, if secondary air is drawn from an area that is less contaminated than the building average, values of Er greater than 1 are possible. Yuill et al. (2012) measured Er in several locations in an office building and found results ranging from 0.74 to 1.01. Results in the same building
2017 ASHRAE Handbook—Fundamentals (SI)
could have ranged from 0.14 to 1.13 if the fan-powered boxes had been located differently.
Survey of Ventilation Rates in Office Buildings
Relatively few measurements of as-built office building ventilation performance have been conducted, and those data generally have not used consistent measurement methods or involved representative collections of buildings. The U.S. Environmental Protection Agency (EPA) Building Assessment Survey and Evaluation (BASE) study involved indoor environmental measurements, including ventilation, in 100 randomly selected office buildings using a standardized protocol (EPA 2003). Persily et al. (2005) analyzed the BASE data and found that outdoor air ventilation rates measured using duct traverses at air handler intakes were higher than might be expected, with a mean of about 55 L/s per person. However, these elevated values are partially explained by low occupant density (mean of about four persons per 100 m2) and high outdoor air fractions (mean of about 35%). Considering only values that correspond to minimum outdoor air intake, the mean ventilation rate was 11 L/s per workstation. About one-half the ventilation rates under minimum outdoor air intake were below 9.4 L/s per person. Another key outcome of this study is documentation of measured airflow rates that are quite different from their design values. This finding highlights the need for good system commissioning and maintenance to achieve design intent. Designing and configuring systems to encourage regular maintenance by providing easy access to key system components is also important.
13.OFFICE BUILDING EXAMPLE
Ventilation and infiltration principles from this chapter, Standard 62.1-2010, and elsewhere are applied to a conventional office building in Atlanta, Georgia. The infiltration, local exhaust, or ventilation airflow rates determined can be used later in the design process (1) as input for the heating and cooling load calculations; (2) for sizing fans, ducts, and dampers; and (3) for inclusion in the construction documents’ air-handling units (AHUs) schedules and specifications.
This example relies on the 2010 edition of ASHRAE Standard 62.1; because this and other standards are updated frequently, users should check for the latest edition.
Location
The example building is about 13 km northeast of downtown Atlanta, and is close to a major highway and its access roads. Atlanta’s climate is hot and humid in the summer, and has relatively mild winters. The average annual outdoor air temperature is about 15.9°C and the heating kelvin-days per year, base 18.3°C
(HKD18.3), are about 1814 (Rock 2005). From Chapter 14, the winter 99% design outdoor air (OA) temperature is –5°C, whereas the
1% cooling dry-bulb temperature is 32.8°C, with a mean coincident wet-bulb temperature of 23.3°C. The 99.6 and 0.4% design wind speeds are 5.4 m/s in the winter and 4 m/s in the summer, both from the northwest. Warm and humid winds also travel north from the Gulf of Mexico, and occasionally the wind is from the Atlantic Ocean from the southeast.
Building
The approximately 2835 m2 building is a two-story, flat-roofed, slab-on-grade commercial office building with a substantial roof overhang in each direction. Materials and construction quality are average commercial grade. Double-paned windows, and similar spandrel glass, are fixed in their metal curtain wall frames; all windows are nonoperable. The remaining portions of the exterior walls are brick. There are relatively few exterior doors, as described later in this example. The building is surrounded by black asphalt driveways, a parking lot, and some vegetation. The nearby highway is across a parallel two-lane access road, to the northwest.