01 POWER ISLAND / 01 CCPP / V. Ganapathy-Industrial Boilers and HRSG-Design (2003)
.pdfFIGURE 8.27 Effect of gas pressure on heat transfer—flow inside tubes. (From Ref. 1.)
Copyright © 2003 Marcel Dekker, Inc.
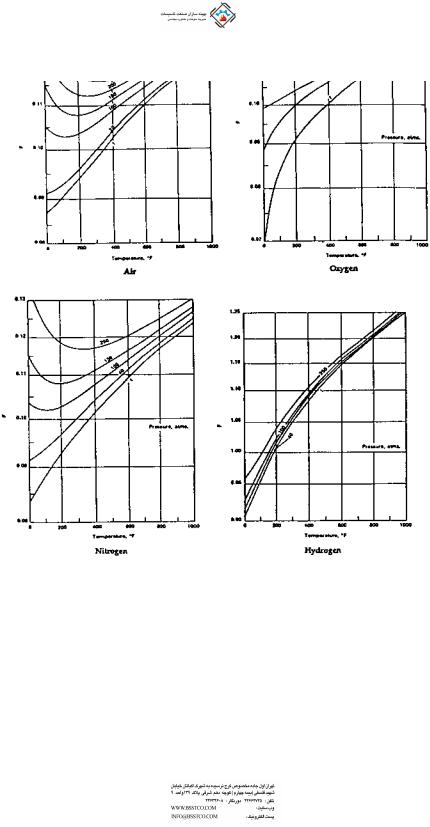
FIGURE 8.28 Effect of gas pressure on heat transfer—flow outside tubes. (From Ref. 1.)
Copyright © 2003 Marcel Dekker, Inc.

hydrogen plant is cooled in a waste heat boiler, whereas in case 2, flue gas in an incineration plant is cooled. Maximum allowable heat flux is 100,000 Btu=ft2 h.
Case 1. Reformed gas. Flow ¼ 100,000 lb=h; gas pressure ¼ 300 psig; gas analysis (vol%):
CO2 ¼ 5; H2O ¼ 30; N2 ¼ 0:1; H2 ¼ 52; CH4 ¼ 2:9; CO ¼ 10.
Case 2. Flue gas. Flow ¼ 100,000 lb=h; gas pressure ¼ atmospheric; gas analysis (vol%):
CO2 ¼ 7; H2O ¼ 12; N2 ¼ 75; O2 ¼ 6.
Steam is generated at 500 psig using 230 F feedwater. Blowdown ¼ 2%. Use fouling factors of 0.001 on both gas and steam sides. Tubes are 1.5 in. OD and 1.14 in. ID. Material is T11 for reformed gas boiler and carbon steel for flue gas boiler. Saturation temperature is 470 F.
A:
Calculations were done using the procedure discussed in Q8.10. The results are presented in Table 8.45. The following points may be noted:
The boiler is much smaller when the gas pressure is higher because of the high gas density.
The heat transfer coefficient is much higher for the reformed gas owing to the presence of hydrogen and water vapor. The heat flux is also very high compared to that in the flue gas boiler.
TABLE 8.45 Effect of Gas Analysis and Pressure on Design of
Fire Tube Boiler
Item |
Reformed gas |
Flue gas |
|
|
|
Gas flow, lb=h |
100,000 |
100,000 |
Gas inlet temp, F |
1650 |
1650 |
Gas exit temp, F |
650 |
650 |
Gas pressure, psia |
315 |
15 |
Duty, MM Btu=h |
70.00 |
28.85 |
Steam generation, lb=h |
69,310 |
28,570 |
Gas pressure drop, in.WC |
9 |
5 |
Heat flux, Btu=ft2 h |
92,200 |
12,300 |
Surface area, ft2 |
1566 |
4266 |
No. of tubes |
350 |
1300 |
Length, ft |
15 |
11 |
Heat transfer coeff, U |
87 |
13.4 |
Max gas velocity, ft=s |
68 |
165 |
Tube wall temp, F |
653 |
498 |
Copyright © 2003 Marcel Dekker, Inc.

TABLE 8.46 Composition of Typical Waste Gases
|
|
|
|
|
|
|
|
|
vol% component |
|
|
|
|
|
Waste gasa |
Temp ( C) |
|
|
|
|
|
|
|
|
|
|
|
|
|
Pressure (psig) |
|
N2 |
NO |
H2O O2 |
SO2 |
SO3 CO2 |
CO |
CH4 |
H2S |
H2 |
NH3 HCL |
|||
1 |
300–1000 |
1 |
80 |
|
|
10 |
10 |
|
|
|
|
|
|
|
2 |
250–500 |
1 |
81 |
|
|
11 |
1 |
7 |
|
|
|
|
|
|
3 |
250–850 |
3–10 |
66 |
9 |
19 |
6 |
|
|
|
|
|
|
|
|
4 |
200–1100 |
1 |
70 |
|
18 |
3 |
|
9 |
|
|
|
|
|
|
5 |
300–1100 |
30–50 |
0.5 |
|
37 |
|
|
6 |
8 |
5.5 |
|
43 |
|
|
6 |
200–500 |
200–450 |
20 |
|
|
|
|
|
|
|
|
60 |
20 |
|
7 |
100–600 |
1 |
75 |
|
7 |
15 |
|
3 |
|
|
|
|
|
|
8 |
175–1000 |
1 |
72 |
|
10 |
6 |
|
12 |
|
|
|
|
trace |
|
9 |
250–1350 |
1 |
76 |
|
8 |
4 |
|
7 |
|
|
|
|
5 |
|
10 |
150–1000 |
1 |
73 |
|
20 |
2 |
|
5 |
|
|
|
|
|
|
11 |
300–1450 |
1.5 |
55 |
|
23 |
|
6 |
6 |
3 |
|
3 |
4 |
|
|
a1, Raw sulfur gases; 2, SO3 gases after converter; 3, nitrous gases; 4, reformer flue gases; 5, reformed gas; 6, synthesis gas; 7, gas turbine exhaust; 8, MSW incinerator exhaust; 9, chlorinated plastics incineration; 10, fume or VOC incinerator exhaust; 11, sulfur condenser effluent.
Copyright © 2003 Marcel Dekker, Inc.

The tube wall temperature is also higher with reformed gas. Hence steamside fouling should be low in these boilers.
It is obvious that gas analysis and pressure play a significant role in the design of boilers. Table 8.46 gives the analysis and gas pressure for typical waste gas streams.
NOMENCLATURE
ASurface area, ft2
A ; A |
; A ; A |
o |
Fin, total, inside, and obstruction surface areas, ft2=ft |
f t |
i |
Area of tube wall, ft2=ft |
|
A |
|
|
|
w |
|
|
|
BFactor used in Grimson’s correlation
bFin thickness, in.
CFactor used to estimate heat transfer coefficient
Cp |
Specific heat, Btu=lb F; subscripts g; w; m stand for gas, water, |
|
and mixture |
C1–C6 |
Factors used in heat transfer and pressure drop calculations for |
|
finned tubes |
DExchanger diameter, in.
d; di |
Tube outer and inner diameter, in. |
eEscalation factor used in life-cycle costing calculations; base of natural logarithm
EEfficiency of HRSG or fins
fFrequency, Hz or cps; subscripts a; e; n stand for acoustic, vortex shedding, and natural
ff |
Fouling factor, ft2 h F=Btu; subscripts i and o stand for inside |
|
and outside |
FFactor used in the estimation of outside heat transfer coefficient and in the estimation of capitalized costs
GGas mass velocity, lb=ft2 h
hFin height, in.
hc |
Convective heat transfer coefficient, Btu=ft2 h F |
hi; ho |
Heat transfer coefficients inside and outside tubes, Btu=ft2 h F |
hlf |
Heat loss factor, fraction |
hN |
Nonluminous heat transfer coefficient, Btu=ft2 h F |
Dh |
Change in enthalpy, Btu=lb |
iInterest rate
kThermal conductivity, Btu=ft h F or Btu in.=ft2 h F; subscript m
|
stands for mixture |
Km |
Metal thermal conductivity, Btu=ft h F |
K1; K2 |
Constants |
Copyright © 2003 Marcel Dekker, Inc.

LLength, ft; thickness of insulation, in.; or beam length
Le |
Equivalent thickness of insulation, in. |
mFactor used in Eq. (47, 51)
Mc |
Water equivalent, Btu= F |
Me |
Weight of tube, lb=ft |
MW |
Molecular weight |
nNumber of fins per inch
NConstant used in Grimson’s correlation; also number of tubes
Nu |
Nusselt number |
NTU |
Number of transfer units |
PTerm used in temperature cross-correction
Pw; Pc |
Partial pressure of water vapor and carbon dioxide |
Pr |
Prandtl number |
QEnergy transferred, Btu=h; heat flux, Btu=ft2 h
qHeat flux, heat loss, Btu=ft2 h
q |
c |
Critical heat flux, Btu=ft2 h |
RThermal resistance, ft2 h F=Btu; subscripts i; o, and t stand for inside, outside, and total
Re |
Reynolds number |
Rm |
Metal thermal resistance, ft2 h F=Btu |
SFin clearance, in.; Strouhal number; surface area, ft2
ST ; SL |
Transverse and longitudinal pitch, in. |
tFluid temperature, F; subscripts a; s; b stand for ambient,
|
surface, fin base |
tf |
Fin tip temperature, F |
tm |
Metal temperature, F |
tsat |
Saturation temperature, F |
TAbsolute temperature, K or R; subscripts g and w stand for gas and wall
DT |
Log-mean temperature difference, F |
UOverall heat transfer coefficient, Btu=ft2 h F
VFluid velocity, ft=s or ft=min
Vs |
Sonic velocity, ft=s |
WFluid flow, lb=h; subscripts g; s; w stand for gas, steam, and
water
wFlow per tube, lb=h
xSteam quality, fraction
yVolume fraction of gas
eEffectiveness factor
ec; ew; eg |
Emissivity of CO2, water, gas emissivity |
De |
Emissivity correction term |
Copyright © 2003 Marcel Dekker, Inc.

ZFin effectiveness
m |
Viscosity, lb=ft h; subscript m stands for mixture |
rgas density, lb=cu ft
lwavelength, ft
nratio of specific heats
REFERENCES
1.V Ganapathy. Applied Heat Transfer. Tulsa, OK: PennWell Books, 1982.
2.DQ Kern. Process Heat Transfer. New York: McGraw-Hill, 1950.
3.V Ganapathy. Nomogram determines heat transfer coefficient for water flowing in pipes or tubes. Power Engineering, July 1977, p 69.
4.V Ganapathy. Charts simplify spiral finned tube calculations. Chemical Engineering. Apr 25, 1977, p 117.
5.V Ganapathy. Estimate nonluminous radiation heat transfer coefficients. Hydrocarbon Processing, April 1981, p 235.
6.V Ganapathy. Evaluate the performance of waste heat boilers. Chemical Engineering, Nov 16, 1981, p 291.
7.WC Turner, JF Malloy. Thermal Insulation Handbook. New York: McGraw-Hill, 1981, pp 40–45.
8.V Ganapathy. Waste Heat Boiler Deskbook. Atlanta, GA: Fairmont Press, 1991.
9.ESCOA Corp. ESCOA Fintube Manual. Tulsa, OK: ESCOA, 1979.
10.V Ganapathy. Evaluate extended surfaces carefully. Hydrocarbon Processing, October 1990, p 65.
11.V Ganapathy. Fouling—the silent heat transfer thief. Hydrocarbon Processing, October 1992, p 49.
12.V Ganapathy. HRSG temperature profiles guide energy recovery. Power, September 1988.
13.W Roshenow, JP Hartnett. Handbook of Heat Transfer. New York: McGraw-Hill, 1972, pp 13–56.
Copyright © 2003 Marcel Dekker, Inc.