

Статистика пожаров / Центр пожарной статистики CTIF / ctif_report25_world_fire_statistics_2020
.pdf
|
|
|
|
|
|
Table/Таблица/Tabelle 10 |
|||
|
Trends in firefighter deaths in the countries of the World in 2014-2018 |
|
|||||||
|
Динамика гибели пожарных в странах мира за 2014-2018 г.г. |
|
|
||||||
|
Dynamik der Anzahl verunglückter Feuerwehrleute in den Staaten für 2014-2018 |
|
|||||||
|
Country |
Population, |
|
Number of firefighter deaths |
|
Average |
|||
|
thous. inh. |
2014 |
2015 |
2016 |
2017 |
2018 |
per year |
||
|
|
||||||||
№ |
Страна |
Население, |
|
Число погибших |
|
|
Среднее |
||
тыс. чел. |
2014 |
2015 |
2016 |
2017 |
2018 |
в год |
|||
|
|
||||||||
|
Staat |
Einwohner |
|
Anzahl der FM getötet |
|
Mittelwert |
|||
|
in 1.000 |
2014 |
2015 |
2016 |
2017 |
2018 |
je Jahr |
||
|
|
||||||||
1 |
USA |
327 167 |
64 |
68 |
69 |
60 |
64 |
65,0 |
|
2 |
Russia |
146 781 |
19 |
12 |
19 |
- |
8 |
14,5 |
|
3 |
Japan |
128 130 |
9 |
- |
- |
- |
- |
9,0 |
|
4 |
Republic of Korea |
51 629 |
- |
- |
- |
- |
7 |
7,0 |
|
5 |
Ukraine |
42 270 |
1 |
5 |
1 |
2 |
0 |
1,8 |
|
6 |
Poland |
38 411 |
0 |
0 |
- |
2 |
- |
0,7 |
|
7 |
Romania |
20 121 |
- |
1 |
1 |
0 |
- |
0,7 |
|
8 |
Kazachstan |
18 611 |
- |
- |
- |
2 |
4 |
3,0 |
|
9 |
Netherlands |
17 082 |
1 |
0 |
- |
- |
- |
0,5 |
|
10 |
Greece |
10 788 |
- |
- |
- |
- |
1 |
1,0 |
|
11 |
Czech Republic |
10 650 |
0 |
0 |
0 |
2 |
0 |
0,4 |
|
12 |
Jordan |
10 378 |
- |
0 |
0 |
1 |
- |
0,3 |
|
13 |
Sweden |
10 230 |
- |
1 |
- |
0 |
2 |
1,0 |
|
14 |
Hungary |
9 778 |
0 |
0 |
0 |
0 |
0 |
0,0 |
|
15 |
Belarus |
9 475 |
0 |
0 |
2 |
2 |
2 |
1,2 |
|
16 |
Austria |
8 837 |
1 |
- |
- |
- |
- |
1,0 |
|
17 |
Switzerland |
8 500 |
0 |
1 |
- |
0 |
0 |
0,3 |
|
18 |
Israel |
8 300 |
- |
- |
0 |
- |
- |
0,0 |
|
19 |
Serbia |
7 187 |
1 |
- |
- |
- |
- |
1,0 |
|
20 |
Bulgaria |
7 050 |
0 |
0 |
0 |
1 |
1 |
0,4 |
|
21 |
Denmark |
5 786 |
0 |
0 |
0 |
0 |
1 |
0,2 |
|
22 |
Finland |
5 483 |
- |
0 |
0 |
0 |
0 |
0,0 |
|
23 |
Norway |
5 109 |
0 |
- |
- |
- |
- |
0,0 |
|
24 |
Croatia |
4 087 |
0 |
0 |
0 |
0 |
0 |
0,0 |
|
25 |
Slovenia |
2 881 |
0 |
0 |
- |
- |
1 |
0,3 |
|
26 |
Lithuania |
2 848 |
1 |
0 |
0 |
0 |
- |
0,3 |
|
27 |
Latvia |
1 950 |
0 |
0 |
0 |
0 |
- |
0,0 |
|
28 |
Estonia |
1 317 |
0 |
0 |
0 |
0 |
0 |
0,0 |
|
29 |
Luxemburg |
602 |
- |
- |
- |
- |
0 |
0,0 |
|
30 |
Liechtenstein |
38 |
- |
0 |
- |
- |
0 |
0,0 |
|
Total/Итого/Gesamt |
921476 |
97 |
88 |
92 |
72 |
91 |
88,0 |
||
|
|
|
|
|
|
Table/Таблица/Tabelle 10.1 |
|||
|
Trends in firefighter injuries in the countries of the World in 2014-2018 |
|
|||||||
|
Динамика травмирования пожарных в странах мира за 2014-2018 г.г. |
|
|||||||
|
Dynamik der Anzahl verunglückter Feuerwehrleute in den Staaten für 2014-2018 |
|
|||||||
|
Country |
Population, |
|
Number of firefighter injuries |
|
Average |
|||
|
thous. inh. |
2014 |
2015 |
2016 |
2017 |
2018 |
per year |
||
|
|
||||||||
№ |
Страна |
Население, |
|
Число травмированных пожарных |
|
Среднее |
|||
тыс. чел. |
2014 |
2015 |
2016 |
2017 |
2018 |
в год |
|||
|
|
||||||||
|
Staat |
Einwohner |
|
Anzahl der FM verletzt |
|
Mittelwert |
|||
|
in 1.000 |
2014 |
2015 |
2016 |
2017 |
2018 |
je Jahr |
||
|
|
||||||||
1 |
USA |
327 167 |
63 350 |
68 085 |
62 085 |
58 835 |
58 250 |
62 121 |
|
2 |
Russia |
146 781 |
320 |
230 |
42 |
- |
67 |
165 |
|
3 |
Japan |
128 130 |
384 |
- |
- |
- |
- |
384 |
|
4 |
Prepublic of Korea |
51 629 |
- |
- |
- |
- |
728 |
728 |
|
5 |
Ukraine |
42 270 |
10 |
34 |
21 |
15 |
29 |
22 |
|
6 |
Poland |
38 411 |
- |
- |
- |
204 |
- |
204 |
|
7 |
Romania |
20 121 |
- |
16 |
25 |
1 |
- |
14 |
|
8 |
Kazachstan |
18 611 |
- |
- |
- |
- |
11 |
11 |
|
9 |
Greece |
10 788 |
- |
- |
- |
- |
16 |
16 |
|
10 |
Czech Republic |
10 650 |
428 |
242 |
182 |
182 |
253 |
257 |
|
11 |
Jordan |
10 378 |
- |
82 |
76 |
52 |
- |
70 |
|
12 |
Sweden |
10 230 |
- |
- |
- |
- |
113 |
113 |
|
13 |
Hungary |
9 778 |
53 |
52 |
72 |
72 |
84 |
67 |
|
14 |
Belarus |
9 475 |
11 |
3 |
14 |
6 |
5 |
8 |
|
15 |
Austria |
8 837 |
949 |
- |
- |
- |
- |
949 |
|
16 |
Switzerland |
8 500 |
155 |
133 |
- |
188 |
146 |
156 |
|
17 |
Israel |
8 300 |
- |
- |
120 |
- |
- |
120 |
|
18 |
Serbia |
7 187 |
34 |
- |
- |
- |
- |
34 |
|
19 |
Bulgaria |
7 050 |
25 |
19 |
22 |
23 |
14 |
21 |
|
20 |
Finland |
5 483 |
- |
66 |
81 |
43 |
84 |
69 |
|
21 |
Croatia |
4 087 |
8 |
11 |
24 |
101 |
22 |
33 |
|
22 |
Slovenia |
2 881 |
17 |
5 |
- |
- |
6 |
9 |
|
23 |
Lithuania |
2 848 |
22 |
14 |
21 |
23 |
- |
20 |
|
24 |
Latvia |
1 950 |
43 |
57 |
57 |
49 |
- |
52 |
|
25 |
Estonia |
1 317 |
38 |
51 |
52 |
57 |
54 |
50 |
|
26 |
Luxemburg |
602 |
- |
- |
- |
- |
27 |
27 |
|
27 |
Malta |
421 |
- |
0 |
0 |
- |
- |
0 |
|
28 |
Liechtenstein |
37 |
- |
0 |
- |
- |
0 |
0 |
|
Total/Итого/Gesamt |
893 919 |
65 847 |
69 100 |
62 894 |
59 851 |
59 909 |
63 520 |
||
* - Includes firefighter deaths and injuries during earthquake and tsunami / Учтены жертвы землетрясения и цунами / incl. getöteter FM während Erdbeben und Tsunami

Table/Таблица/Tabelle 11
Country
№Страна
Staat
Statistics of fire services in the countries of the World in 2001-2018 (most recent data) |
|
||||||
Численность противопожарных служб в странах мира в 2001-2018 годах |
|
|
|||||
Personal und Ausstattung der Feuerwehren der Staaten in 2001-2018 |
|
|
|||||
Population |
Fire |
Number of |
|
Number of firefighters |
|
||
thous.inh. |
stations |
engines |
ladders |
career |
part time |
volunt. |
total |
|
|
||||||
Население, |
Пожарные |
Число |
Численность личного состава |
||||
тыс. чел. |
депо |
АЦ и АН |
АЛ и КП |
проф. |
совмест. |
добр. |
всего |
Einwohner |
Feuer- |
Anzahl der Fahrzeuge |
|
Personal der Feuerwehr |
|
||
in 1.000 |
wachen |
LF, TLF |
DL, TM |
BF |
Teilzeit |
FF |
Gesamt |
1 |
China |
1 386 000 |
- |
- |
- |
130 000 |
- |
7 500 000 |
7 630 000 |
2 |
USA |
327 167 |
51 000 |
66 400 |
7 200 |
373 600 |
- |
682 600 |
1 056 200 |
3 |
Russia |
146 781 |
21 931 |
22 735 |
1 326 |
271 000 |
- |
956 600 |
1 227 600 |
4 |
Japan |
128 130 |
3 145 |
21 954 |
1 204 |
164 873 |
0 |
843 667 |
1 008 540 |
5 |
Vietnam |
95 990 |
269 |
1 630 |
412 |
9 825 |
- |
920 729 |
930 554 |
6 |
Germany |
83 020 |
37 175 |
41 064 |
2 509 |
48 558 |
- |
994 042 |
1 042 600 |
7 |
France |
66 628 |
6 528 |
7 542 |
1 195 |
40 646 |
- |
193 800 |
234 446 |
8 |
Great Britain |
64 553 |
2 053 |
2 900 |
235 |
40 100 |
19 000 |
1 400 |
60 500 |
9 |
Iran |
64 000 |
452 |
1 300 |
20 |
9 285 |
- |
- |
9 285 |
10 |
Italy |
61 000 |
902 |
2 330 |
307 |
28 870 |
- |
20 060 |
48 930 |
11 |
Republic of Korea |
51 629 |
219 |
2 144 |
460 |
57 779 |
- |
94 257 |
152 036 |
12 |
Ukraine |
42 270 |
976 |
3 344 |
301 |
53 286 |
- |
149 541 |
202 827 |
13 |
Poland |
38 411 |
16 656 |
19 774 |
721 |
30 240 |
- |
645 842 |
676 082 |
14 |
Canada |
35 544 |
- |
- |
- |
26 000 |
- |
126 650 |
152 650 |
15 |
Peru |
26 000 |
174 |
- |
- |
- |
- |
- |
- |
16 |
Malaysia |
23 800 |
193 |
426 |
25 |
8 928 |
- |
11 338 |
20 266 |
17 |
Taiwan |
22 450 |
544 |
959 |
197 |
8 180 |
- |
26 500 |
34 680 |
18 |
Romania |
20 121 |
356 |
936 |
102 |
26 456 |
- |
100 835 |
127 291 |
19 |
Australia |
20 016 |
- |
4 448 |
- |
- |
- |
- |
- |
20 |
Kazachstan |
18 611 |
418 |
1 522 |
335 |
17 500 |
- |
43 000 |
60 500 |
21 |
Netherlands |
17 181 |
1 206 |
1 070 |
130 |
5 375 |
- |
18 857 |
24 232 |
22 |
Portugal |
11 000 |
473 |
1 600 |
- |
4 100 |
0 |
45 000 |
49 100 |
23 |
Greece |
10 788 |
330 |
1 941 |
108 |
13 291 |
- |
- |
13 291 |
24 |
Belgium |
10 667 |
252 |
1 680 |
270 |
5 519 |
0 |
12 230 |
17 749 |
25 |
Czech Republic |
10 650 |
7 185 |
4 632 |
426 |
12 692 |
- |
68 463 |
81 155 |
26 |
Jordan |
10 378 |
200 |
320 |
22 |
15 787 |
- |
126 |
15 913 |
27 |
Sweden |
10 230 |
944 |
- |
- |
5 273 |
11 450 |
- |
16 723 |
28 |
Hungary |
9 778 |
323 |
998 |
105 |
10 205 |
- |
19 517 |
29 722 |
29 |
Belarus |
9 475 |
752 |
1 922 |
168 |
10 649 |
- |
6 699 |
17 348 |
30 |
Austria |
8 837 |
4 808 |
8 824 |
323 |
- |
- |
- |
337 017 |
31 |
Switzerland |
8 500 |
1 247 |
- |
- |
1 248 |
0 |
82 731 |
83 979 |
32 |
Israel |
8 300 |
120 |
420 |
31 |
2 000 |
- |
2 200 |
4 200 |
33 |
Serbia |
7 187 |
186 |
886 |
40 |
3 169 |
0 |
- |
3 169 |
34 |
Bulgaria |
7 050 |
243 |
693 |
66 |
6 476 |
0 |
3 138 |
9 614 |
35 |
Laos |
6 522 |
17 |
52 |
1 |
244 |
0 |
0 |
244 |
36 |
Denmark |
5 786 |
285 |
358 |
103 |
1 368 |
4 416 |
- |
5 784 |
37 |
Singapore |
5 612 |
21 |
86 |
23 |
2 742 |
- |
- |
2 742 |
38 |
Finland |
5 474 |
896 |
1 535 |
80 |
3 846 |
3 806 |
11 615 |
19 267 |
39 |
Slovakia |
5 412 |
116 |
454 |
106 |
3 740 |
- |
69 700 |
73 440 |
40 |
Georgia |
5 266 |
119 |
200 |
15 |
5 128 |
- |
- |
5 128 |
41 |
Norway |
5 109 |
597 |
963 |
70 |
3 718 |
8 152 |
- |
11 870 |
42 |
Costa Rica |
4 973 |
76 |
- |
- |
- |
- |
- |
- |
43 |
New Zealand |
4 748 |
635 |
714 |
31 |
2 406 |
- |
11 295 |
13 701 |
44 |
Ireland |
4 581 |
219 |
300 |
46 |
2 012 |
2 076 |
0 |
4 088 |
45 |
Croatia |
4 087 |
1 923 |
2 248 |
115 |
3 425 |
1 070 |
54 219 |
58 714 |
46 |
Kuwait |
3 800 |
39 |
50 |
11 |
3 800 |
- |
- |
3 800 |
47 |
Albania |
3 601 |
45 |
68 |
6 |
724 |
- |
- |
724 |
48 |
Moldova |
3 553 |
62 |
163 |
25 |
1381 |
- |
90 |
1 471 |
49 |
Mongolia |
3 120 |
42 |
70 |
5 |
2 396 |
- |
- |
2 396 |
50 |
Armenia |
2 973 |
60 |
147 |
10 |
2 298 |
- |
- |
2 298 |
51 |
Lithuania |
2 848 |
81 |
240 |
52 |
2 990 |
- |
1 547 |
4 537 |
52 |
Slovenia |
2 081 |
1 358 |
2 505 |
38 |
952 |
0 |
164 662 |
165 614 |
53 |
Latvia |
1 950 |
92 |
265 |
44 |
2 701 |
- |
- |
2 701 |
54 |
Estonia |
1 317 |
191 |
104 |
11 |
1 583 |
0 |
1 938 |
3 521 |
55 |
Cyprus |
858 |
31 |
86 |
6 |
618 |
116 |
- |
734 |
56 |
Luxemburg |
602 |
100 |
106 |
23 |
506 |
- |
4 750 |
5 256 |
57 |
Brunei |
333 |
16 |
8 |
18 |
987 |
- |
1 695 |
2 682 |
58 |
Barbados |
267 |
6 |
13 |
2 |
214 |
- |
- |
214 |
59 |
Liechtenstein |
38 |
15 |
13 |
3 |
0 |
0 |
603 |
603 |
Total/Итого/Gesamt |
2 947 053 |
168 302 |
237 142 |
19 082 |
1 490 689 |
50 086 |
13 891 936 |
15 432 711 |
|
Table/Таблица/Tabelle 12
Fire service personnel by gender in the countries of the World in 2010-2018 (most recent data)
Распределение персонала по гендерному признаку в странах мира в 2010-2018 годах
Personal der Feuerwehren der Staaten nach Gender in 2010-2018
|
Country |
Population |
Number of firefighters |
|
||
|
thous.inh. |
Male |
Female |
Total |
||
|
|
|||||
|
|
|
||||
№ |
Страна |
Население, |
Число пожарных |
|
||
тыс. чел. |
Мужчины |
Женщины |
всего |
|||
|
|
|||||
|
Staat |
Einwohner |
Personal der Feuerwehr |
|
||
|
in 1.000 |
Männer |
Frauen |
Gesamt |
||
|
|
|||||
1 |
USA |
323 128 |
978 300 |
77 900 |
1 056 200 |
|
2 |
Russia* |
146 781 |
233 227 |
37 773 |
271 000 |
|
3 |
Japan |
128 130 |
1 025 591 |
25 974 |
1 051 565 |
|
4 |
Germany |
82 218 |
938 525 |
89 471 |
1 027 996 |
|
5 |
France |
66 628 |
197 921 |
36 525 |
234 446 |
|
6 |
Italy |
61 000 |
47 503 |
1 427 |
48 930 |
|
7 |
Republic of Korea |
51 629 |
146 035 |
39 006 |
185 041 |
|
8 |
Poland |
38 411 |
614 813 |
61 269 |
676 082 |
|
9 |
Romania |
20 121 |
126 059 |
1 241 |
127 300 |
|
10 |
Netherlands |
17 181 |
28 140 |
1 424 |
29 564 |
|
11 |
Denmark |
17 081 |
22 757 |
1 286 |
24 043 |
|
12 |
Greece |
10 788 |
13 291 |
1 851 |
15 142 |
|
13 |
Czech Republic |
10 579 |
81 819 |
1 395 |
83 214 |
|
14 |
Sweden |
10 230 |
15 696 |
1 027 |
16 723 |
|
15 |
Hungary* |
9 778 |
29 016 |
706 |
29 722 |
|
16 |
Austria |
8 837 |
313 966 |
23 051 |
337 017 |
|
17 |
Switzerland* |
8 500 |
75 645 |
8 334 |
83 979 |
|
18 |
Serbia |
7 187 |
3 104 |
65 |
3 169 |
|
19 |
Bulgaria |
7 050 |
9 614 |
286 |
9 900 |
|
20 |
Denmark |
5 786 |
5 756 |
220 |
5 976 |
|
21 |
Singapore |
5 612 |
1 928 |
407 |
2 335 |
|
22 |
Finland |
5 483 |
17 976 |
1 505 |
19 481 |
|
23 |
Slovakia |
5 412 |
60 736 |
12 704 |
73 440 |
|
24 |
Norway |
5 109 |
11 673 |
197 |
11 870 |
|
25 |
Ireland |
4 459 |
3 547 |
0 |
3 547 |
|
26 |
New Zealand |
4 271 |
8 453 |
836 |
9 289 |
|
27 |
Croatia |
4 087 |
57 644 |
7 833 |
65 477 |
|
28 |
Armenia |
2 972 |
2 164 |
67 |
2 231 |
|
29 |
Lithuania |
2 848 |
4 529 |
8 |
4 537 |
|
30 |
Slovenia |
2 081 |
63 411 |
12 535 |
75 946 |
|
31 |
Latvia |
1 969 |
2 701 |
0 |
2 701 |
|
32 |
Estonia |
1 317 |
3 212 |
309 |
3 521 |
|
33 |
Cyprus |
862 |
686 |
64 |
750 |
|
34 |
Luxemburg |
602 |
4 438 |
818 |
5 256 |
|
35 |
Liechtenstein |
37 |
586 |
17 |
603 |
|
Total/Итого/Gesamt |
1 078 164 |
5 150 462 |
447 531 |
5 597 993 |
||
* - career / профессионалы / BF
Table/Таблица/Tabelle 13
Number of young firefighters in the countries of the World in 2010-2018 (most recent data)
Численность юных пожарных в странах мира в 2010-2018 годах
Anzahl der Jugendlichen in den Feuerwehren der Staaten in 2010-2018
|
Country |
Population |
Number of young firefighters |
|
|
thous.inh. |
|||
|
|
|
||
№ |
Страна |
Население, |
Число юных пожарных |
|
тыс. чел. |
||||
|
|
|
||
|
Staat |
Einwohner |
Jugendfeuerwehrmitglieder |
|
|
in 1.000 |
|||
|
|
|
||
1 |
Russia |
146 781 |
262 354 |
|
2 |
Japan |
128 130 |
420 000 |
|
3 |
Germany |
82 218 |
249 027 |
|
4 |
France |
66 628 |
27 598 |
|
5 |
Republic of Korea |
51 629 |
26 550 |
|
6 |
Poland |
38 411 |
8 440 |
|
7 |
Romania |
20 121 |
19 940 |
|
8 |
Greece |
10 788 |
407 |
|
9 |
Hungary |
9 778 |
2 512 |
|
10 |
Belarus |
9 475 |
152 839 |
|
11 |
Austria |
8 837 |
27 465 |
|
12 |
Croatia |
4 087 |
21 927 |
|
13 |
Slovenia |
2 081 |
41 660 |
|
14 |
Latvia |
1 969 |
300 |
|
15 |
Luxemburg |
602 |
1 185 |
|
16 |
Liechtenstein |
38 |
38 |
|
Total/Итого/Gesamt |
581 573 |
1 262 242 |
||
USA |
|
|
|
|
|
|
|
|
|
|
|
|
|
|
|
|
|
|
|
|
|
|
|
|
|
|
|
|
|
|
|
|
|
|
|
|
103,9 |
|
|
|
|
|
|
|
|
|
|
|
|
|
|
|
|
|
|
|
|
|
|
|
|
|
|
|
|
|
|
|
|
|
|
|
|
|
|||
Luxemburg |
|
|
|
|
|
|
|
|
|
|
|
|
|
|
|
|
|
|
|
|
|
|
|
|
|
|
|
|
|
|
|
|
|
|
|
|
101,6 |
|
|
|
|
|
|
|
|
|
|
|
|
|
|
|
|
|
|
|
|
|
|
|
|
|
|
|
|
|
|
|
|
|
|
|
|
|
|||
Slovenia |
|
|
|
|
|
|
|
|
|
|
|
|
|
|
|
|
|
|
|
|
|
|
|
|
|
|
|
|
|
|
|
73,7 |
|
|
|
|
|
|
|
|
|
|
|
|
|
|
|
|
|
|
|
|
|
|
|
|
|
|
|
|
|
|
|
|
|
|
|
|
|
|
|
|
|
||||
France |
|
|
|
|
|
|
|
|
|
|
|
|
|
|
|
|
|
|
|
|
|
|
|
|
|
|
|
|
|
|
68,7 |
|
|
|
|
|
|
|
|
|
|
|
|
|
|
|
|
|
|
|
|
|
|
|
|
|
|
|
|
|
|
|
|
|
|
|
|
|
|
|
|
|
|
||||
Japan |
|
|
|
|
|
|
|
|
|
|
|
|
|
|
|
|
|
|
|
|
|
|
|
|
|
|
|
|
|
65,7 |
|
|
|
|
|
|
||
|
|
|
|
|
|
|
|
|
|
|
|
|
|
|
|
|
|
|
|
|
|
|
|
|
|
|
|
|
|
|
|
|
|
|||||
Ireland |
|
|
|
|
|
|
|
|
|
|
|
|
|
|
|
|
|
|
|
|
|
|
|
|
|
|
|
49,3 |
|
|
|
|
|
|
|
|
|
|
|
|
|
|
|
|
|
|
|
|
|
|
|
|
|
|
|
|
|
|
|
|
|
|
|
|
|
|
|
|
|
|
|
|
|
|
|||
Germany |
|
|
|
|
|
|
|
|
|
|
|
|
|
|
|
|
|
|
|
|
|
|
|
|
|
|
47,5 |
|
|
|
|
|
|
|
|
|
|
|
|
|
|
|
|
|
|
|
|
|
|
|
|
|
|
|
|
|
|
|
|
|
|
|
|
|
|
|
|
|
|
|
|
|
|
||||
Singapore |
|
|
|
|
|
|
|
|
|
|
|
|
|
|
|
|
|
|
|
|
|
|
|
|
31,8 |
|
|
|
|
|
|
|
|
|
|
|
|
|
|
|
|
|
|
|
|
|
|
|
|
|
|
|
|
|
|
|
|
|
|
|
|
|
|
|
|
|
|
|
|
|
|
|
|
||||
Austria |
|
|
|
|
|
|
|
|
|
|
|
|
|
|
|
|
|
|
|
|
|
|
|
|
30,2 |
|
|
|
|
|
|
|
|
|
|
|
|
|
|
|
|
|
|
|
|
|
|
|
|
|
|
|
|
|
|
|
|
|
|
|
|
|
|
|
|
|
|
|
|
|
|
|
|
|
|||
Romania |
|
|
|
|
|
|
|
|
|
|
|
|
|
|
|
|
|
|
|
|
|
|
21,1 |
|
|
|
|
|
|
|
|
|
|
|
|
|
|
|
|
|
|
|
|
|
|
|
|
|
|
|
|
|
|
|
|
|
|
|
|
|
|
|
|
|
|
|
|
|
|
|
|
|
|
||||
Estonia |
|
|
|
|
|
|
|
|
|
|
|
|
|
|
|
|
|
|
|
|
|
19,4 |
|
|
|
|
|
|
|
|
|
|
|
|
|
|
|
|
|
|
|
|
|
|
|
|
|
|
|
|
|
|
|
|
|
|
|
|
|
|
|
|
|
|
|
|
|
|
|
|
|
|
|
||||
Finland |
|
|
|
|
|
|
|
|
|
|
|
|
|
|
|
|
|
|
|
|
16,4 |
|
|
|
|
|
|
|
|
|
|
|
|
|
|
|
||
|
|
|
|
|
|
|
|
|
|
|
|
|
|
|
|
|
|
|
|
|
|
|
|
|
|
|
|
|
|
|
|
|
|
|||||
New Zealand |
|
|
|
|
|
|
|
|
|
|
|
|
|
|
|
|
|
|
|
|
16,0 |
|
|
|
|
|
|
|
|
|
|
|
|
|
|
|
||
|
|
|
|
|
|
|
|
|
|
|
|
|
|
|
|
|
|
|
|
|
|
|
|
|
|
|
|
|
|
|
|
|
|
|||||
Italy |
|
|
|
|
|
|
|
|
|
|
|
|
|
|
|
|
|
|
|
14,4 |
|
|
|
|
|
|
|
|
|
|
|
|
|
|
|
|||
|
|
|
|
|
|
|
|
|
|
|
|
|
|
|
|
|
|
|
|
|
|
|
|
|
|
|
|
|
|
|
|
|
||||||
Poland |
|
|
|
|
|
|
|
|
|
|
|
|
|
|
|
|
|
|
12,4 |
|
|
|
|
|
|
|
|
|
|
|
|
|
|
|
||||
|
|
|
|
|
|
|
|
|
|
|
|
|
|
|
|
|
|
|
|
|
|
|
|
|
|
|
|
|
|
|
|
|||||||
Jordan |
|
|
|
|
|
|
|
|
|
|
|
|
|
|
|
|
|
12,2 |
|
|
|
|
|
|
|
|
|
|
|
|
|
|
|
|||||
|
|
|
|
|
|
|
|
|
|
|
|
|
|
|
|
|
|
|
|
|
|
|
|
|
|
|
|
|
|
|
||||||||
Sweden |
|
|
|
|
|
|
|
|
|
|
|
|
|
|
|
|
12,1 |
|
|
|
|
|
|
|
|
|
|
|
|
|
|
|
||||||
|
|
|
|
|
|
|
|
|
|
|
|
|
|
|
|
|
|
|
|
|
|
|
|
|
|
|
|
|
|
|||||||||
Israel |
|
|
|
|
|
|
|
|
|
|
|
|
|
|
|
11,7 |
|
|
|
|
|
|
|
|
|
|
|
|
|
|
|
|||||||
|
|
|
|
|
|
|
|
|
|
|
|
|
|
|
|
|
|
|
|
|
|
|
|
|
|
|
|
|
||||||||||
Malta |
|
|
|
|
|
|
|
|
|
|
|
|
|
|
11,5 |
|
|
|
|
|
|
|
|
|
|
|
|
|
|
|
|
|||||||
|
|
|
|
|
|
|
|
|
|
|
|
|
|
|
|
|
|
|
|
|
|
|
|
|
|
|
|
|
||||||||||
Costa Rica |
|
|
|
|
|
|
|
|
|
|
|
|
|
11,0 |
|
|
|
|
|
|
|
|
|
|
|
|
|
|
|
|
||||||||
|
|
|
|
|
|
|
|
|
|
|
|
|
|
|
|
|
|
|
|
|
|
|
|
|
|
|
|
|||||||||||
Latvia |
|
|
|
|
|
|
|
|
|
|
|
|
10,1 |
|
|
|
|
|
|
|
|
|
|
|
|
|
|
|
|
|
||||||||
|
|
|
|
|
|
|
|
|
|
|
|
|
|
|
|
|
|
|
|
|
|
|
|
|
|
|
|
|||||||||||
Great Britain |
|
|
|
|
|
|
|
|
|
|
|
9,8 |
|
|
|
|
|
|
|
|
|
|
|
|
|
|
|
|
|
|||||||||
|
|
|
|
|
|
|
|
|
|
|
|
|
|
|
|
|
|
|
|
|
|
|
|
|
|
|
||||||||||||
Netherlands |
|
|
|
|
|
|
|
|
|
|
9,5 |
|
|
|
|
|
|
|
|
|
|
|
|
|
|
|
|
|
||||||||||
|
|
|
|
|
|
|
|
|
|
|
|
|
|
|
|
|
|
|
|
|
|
|
|
|
|
|||||||||||||
Czech Republic |
|
|
|
|
|
|
|
|
|
9,5 |
|
|
|
|
|
|
|
|
|
|
|
|
|
|
|
|
|
|||||||||||
|
|
|
|
|
|
|
|
|
|
|
|
|
|
|
|
|
|
|
|
|
|
|
|
|
||||||||||||||
Lithuania |
|
|
|
|
|
|
|
|
|
9,4 |
|
|
|
|
|
|
|
|
|
|
|
|
|
|
|
|
|
|||||||||||
|
|
|
|
|
|
|
|
|
|
|
|
|
|
|
|
|
|
|
|
|
|
|
|
|
||||||||||||||
Mauritius |
|
|
|
|
|
|
|
|
9,1 |
|
|
|
|
|
|
|
|
|
|
|
|
|
|
|
|
|
||||||||||||
|
|
|
|
|
|
|
|
|
|
|
|
|
|
|
|
|
|
|
|
|
|
|
|
|||||||||||||||
Russia |
|
|
|
|
|
|
|
8,7 |
|
|
|
|
|
|
|
|
|
|
|
|
|
|
|
|
|
|
||||||||||||
|
|
|
|
|
|
|
|
|
|
|
|
|
|
|
|
|
|
|
|
|
|
|
|
|||||||||||||||
Bulgaria |
|
|
|
|
|
|
8,0 |
|
|
|
|
|
|
|
|
|
|
|
|
|
|
|
|
|
|
|||||||||||||
|
|
|
|
|
|
|
|
|
|
|
|
|
|
|
|
|
|
|
|
|
|
|
||||||||||||||||
Switzerland |
|
|
|
|
|
7,9 |
|
|
|
|
|
|
|
|
|
|
|
|
|
|
|
|
|
|
||||||||||||||
|
|
|
|
|
|
|
|
|
|
|
|
|
|
|
|
|
|
|
|
|
|
|||||||||||||||||
Denmark |
|
|
|
|
7,2 |
|
|
|
|
|
|
|
|
|
|
|
|
|
|
|
|
|
|
|||||||||||||||
|
|
|
|
|
|
|
|
|
|
|
|
|
|
|
|
|
|
|
|
|
||||||||||||||||||
Spain |
|
|
|
6,9 |
|
|
|
|
|
|
|
|
|
|
|
|
|
|
|
|
|
|
|
|||||||||||||||
|
|
|
|
|
|
|
|
|
|
|
|
|
|
|
|
|
|
|
|
|
||||||||||||||||||
Hungary |
|
|
6,7 |
|
|
|
|
|
|
|
|
|
|
|
|
|
|
|
|
|
|
|
||||||||||||||||
|
|
|
|
|
|
|
|
|
|
|
|
|
|
|
|
|
|
|
|
|||||||||||||||||||
Armenia |
|
|
6,5 |
|
|
|
|
|
|
|
|
|
|
|
|
|
|
|
|
|
|
|
||||||||||||||||
|
|
|
|
|
|
|
|
|
|
|
|
|
|
|
|
|
|
|
|
|||||||||||||||||||
Greece |
|
|
6,1 |
|
|
|
|
|
|
|
|
|
|
|
|
|
|
|
|
|
|
|
||||||||||||||||
|
|
|
|
|
|
|
|
|
|
|
|
|
|
|
|
|
|
|
|
|||||||||||||||||||
Belarus |
|
|
5,9 |
|
|
|
|
|
|
|
|
|
|
|
|
|
|
|
|
|
|
|
||||||||||||||||
|
|
|
|
|
|
|
|
|
|
|
|
|
|
|
|
|
|
|
|
|||||||||||||||||||
Slovakia |
|
|
5,7 |
|
|
|
|
|
|
|
|
|
|
|
|
|
|
|
|
|
|
|
||||||||||||||||
|
|
|
|
|
|
|
|
|
|
|
|
|
|
|
|
|
|
|
|
|||||||||||||||||||
Croatia |
|
|
5,7 |
|
|
|
|
|
|
|
|
|
|
|
|
|
|
|
|
|
|
|
||||||||||||||||
|
|
|
|
|
|
|
|
|
|
|
|
|
|
|
|
|
|
|
|
|||||||||||||||||||
Ukraine |
|
|
5,1 |
|
|
|
|
|
|
|
|
|
|
|
|
|
|
|
|
|
|
|
|
|||||||||||||||
|
|
|
|
|
|
|
|
|
|
|
|
|
|
|
|
|
|
|
|
|
||||||||||||||||||
Serbia |
|
|
3,8 |
|
|
|
|
|
|
|
|
|
|
|
|
|
|
|
|
|
|
|
|
|
|
|
|
|
||||||||||
|
|
|
|
|
|
|
|
|
|
|
|
|
|
|
|
|
|
|
|
|
|
|
|
|
|
|||||||||||||
Peru |
|
|
3,7 |
|
|
|
|
|
|
|
|
|
|
|
|
|
|
|
|
|
|
|
|
|
|
|
|
|
||||||||||
|
|
|
|
|
|
|
|
|
|
|
|
|
|
|
|
|
|
|
|
|
|
|
|
|
|
|||||||||||||
Norway |
|
|
3,6 |
|
|
|
|
|
|
|
|
|
|
|
|
|
|
|
|
|
|
|
|
|
|
|
|
|
|
|||||||||
|
|
|
|
|
|
|
|
|
|
|
|
|
|
|
|
|
|
|
|
|
|
|
|
|
|
|
||||||||||||
Kuwait |
|
|
3,3 |
|
|
|
|
|
|
|
|
|
|
|
|
|
|
|
|
|
|
|
|
|
|
|
|
|
|
|||||||||
|
|
|
|
|
|
|
|
|
|
|
|
|
|
|
|
|
|
|
|
|
|
|
|
|
|
|
||||||||||||
Kazachstan |
|
|
2,9 |
|
|
|
|
|
|
|
|
|
|
|
|
|
|
|
|
|
|
|
|
|
|
|
|
|
|
|||||||||
|
|
|
|
|
|
|
|
|
|
|
|
|
|
|
|
|
|
|
|
|
|
|
|
|
|
|
||||||||||||
Republic of Korea |
|
|
2,9 |
|
|
|
|
|
|
|
|
|
|
|
|
|
|
|
|
|
|
|
|
|
|
|
|
|
|
|||||||||
|
|
|
|
|
|
|
|
|
|
|
|
|
|
|
|
|
|
|
|
|
|
|
|
|
|
|
||||||||||||
Qatar |
1,1 |
|
|
|
|
|
|
|
|
|
|
|
|
|
|
|
|
|
|
|
|
|
|
|
|
|
|
|
|
|
|
|
|
|||||
|
|
|
|
|
|
|
|
|
|
|
|
|
|
|
|
|
|
|
|
|
|
|
|
|
|
|
|
|
|
|
|
|||||||
|
|
|
|
|
|
|
|
|
|
|
|
|
|
|
|
|
|
|
|
|
|
|
|
|
|
|
|
|
|
|
|
|
|
|
|
|
|
|
0 |
20 |
|
40 |
60 |
80 |
100 |
120 |
|||||||||||||||||||||||||||||||
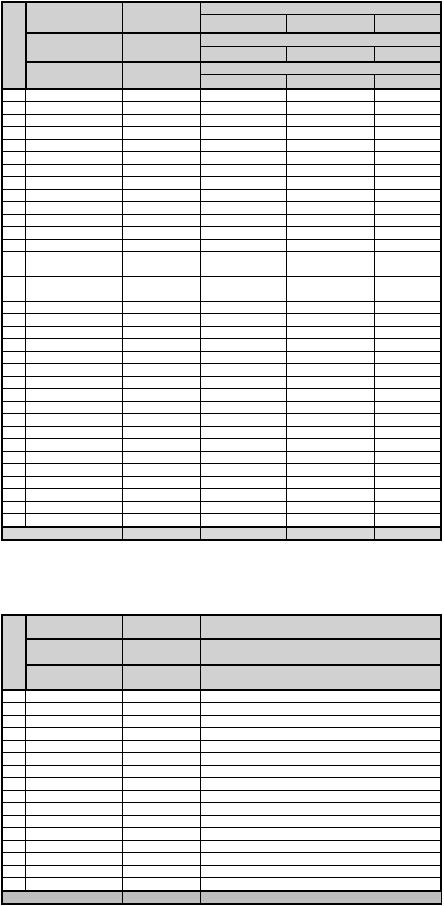
Fig. 1: Average number of calls per 1.000 inh. (2014-2018)
Рис. 1: Среднее число выездов на 1.000 чел. (2014-2108) Bild 1: Mittlere Einsatzanzahl je 1.000 Einwohner (2014-2018)
Barbados |
|
|
|
|
|
|
|
|
|
|
|
|
|
|
|
|
|
|
|
|
|
|
|
|
|
|
|
|
|
|
|
|
|
|
|
|
|
|
|
|
|
|
|
|
|
|
6,95 |
|
|
|
|
|
|
|
|
|
|
|
|
|
|
|
|
|
|
|
|
|
|
|
|
|
|
|
|
|
|
|
|
|
|
|
|
|
|
|
|
|
|
|
|
|
|
|
|
||
Suriname |
|
|
|
|
|
|
|
|
|
|
|
|
|
|
|
|
|
|
|
|
|
|
|
|
|
|
|
|
|
|
|
|
|
|
|
|
|
|
|
|
|
5,76 |
|
|
|
|
||
Israel |
|
|
|
|
|
|
|
|
|
|
|
|
|
|
|
|
|
|
|
|
|
|
|
|
|
|
|
|
|
|
|
|
|
|
|
|
|
|
|
|
5,66 |
|
|
|
|
|||
Mauritius |
|
|
|
|
|
|
|
|
|
|
|
|
|
|
|
|
|
|
|
|
|
|
|
|
|
|
|
|
|
|
|
|
|
|
|
|
|
|
|
5,54 |
|
|
|
|
||||
|
|
|
|
|
|
|
|
|
|
|
|
|
|
|
|
|
|
|
|
|
|
|
|
|
|
|
|
|
|
|
|
|
|
|
|
|
|
|
|
|
|
|||||||
Latvia |
|
|
|
|
|
|
|
|
|
|
|
|
|
|
|
|
|
|
|
|
|
|
|
|
|
|
|
|
|
|
|
|
|
|
|
|
|
|
5,34 |
|
|
|
|
|
|
|||
Netherlands |
|
|
|
|
|
|
|
|
|
|
|
|
|
|
|
|
|
|
|
|
|
|
|
|
|
|
|
|
|
|
|
|
|
|
|
|
|
5,18 |
|
|
|
|
|
|
|
|||
Austria |
|
|
|
|
|
|
|
|
|
|
|
|
|
|
|
|
|
|
|
|
|
|
|
|
|
|
|
|
|
|
|
|
|
|
|
|
|
5,15 |
|
|
|
|
|
|
|
|||
Ireland |
|
|
|
|
|
|
|
|
|
|
|
|
|
|
|
|
|
|
|
|
|
|
|
|
|
|
|
|
|
|
|
|
|
|
|
|
|
5,13 |
|
|
|
|
|
|
|
|||
France |
|
|
|
|
|
|
|
|
|
|
|
|
|
|
|
|
|
|
|
|
|
|
|
|
|
|
|
|
|
|
|
|
|
|
4,41 |
|
|
|
|
|
|
|
|
|
|
|
|
|
Bulgaria |
|
|
|
|
|
|
|
|
|
|
|
|
|
|
|
|
|
|
|
|
|
|
|
|
|
|
|
|
|
|
|
|
|
|
4,38 |
|
|
|
|
|
|
|
|
|
|
|
|
|
Malta |
|
|
|
|
|
|
|
|
|
|
|
|
|
|
|
|
|
|
|
|
|
|
|
|
|
|
|
|
|
|
|
|
|
|
4,38 |
|
|
|
|
|
|
|
|
|
|
|
|
|
Costa Rica |
|
|
|
|
|
|
|
|
|
|
|
|
|
|
|
|
|
|
|
|
|
|
|
|
|
|
|
|
|
|
|
|
|
|
4,36 |
|
|
|
|
|
|
|
|
|
|
|
|
|
Estonia |
|
|
|
|
|
|
|
|
|
|
|
|
|
|
|
|
|
|
|
|
|
|
|
|
|
|
|
|
|
|
|
|
|
4,18 |
|
|
|
|
|
|
|
|
|
|
|
|
|
|
Lithuania |
|
|
|
|
|
|
|
|
|
|
|
|
|
|
|
|
|
|
|
|
|
|
|
|
|
|
|
|
|
|
|
|
4,08 |
|
|
|
|
|
|
|
|
|
|
|
|
|
||
USA |
|
|
|
|
|
|
|
|
|
|
|
|
|
|
|
|
|
|
|
|
|
|
|
|
|
|
|
|
|
|
|
|
4,05 |
|
|
|
|
|
|
|
|
|
|
|
|
|
||
Italy |
|
|
|
|
|
|
|
|
|
|
|
|
|
|
|
|
|
|
|
|
|
|
|
|
|
|
|
|
|
|
|
|
3,96 |
|
|
|
|
|
|
|
|
|
|
|
|
|
||
Poland |
|
|
|
|
|
|
|
|
|
|
|
|
|
|
|
|
|
|
|
|
|
|
|
|
|
|
|
|
|
|
3,81 |
|
|
|
|
|
|
|
|
|
|
|
|
|
|
|||
Andorra |
|
|
|
|
|
|
|
|
|
|
|
|
|
|
|
|
|
|
|
|
|
|
|
|
|
|
|
|
3,32 |
|
|
|
|
|
|
|
|
|
|
|
|
|
|
|
|
|
|
|
Luxemburg |
|
|
|
|
|
|
|
|
|
|
|
|
|
|
|
|
|
|
|
|
|
|
|
|
|
|
|
|
3,31 |
|
|
|
|
|
|
|
|
|
|
|
|
|
|
|
|
|
|
|
|
|
|
|
|
|
|
|
|
|
|
|
|
|
|
|
|
|
|
|
|
|
|
|
|
|
|
|
|
|
|
|
|
|
|
|
|
|
|
|
|
|
|
|
|
||||
Great Britain |
|
|
|
|
|
|
|
|
|
|
|
|
|
|
|
|
|
|
|
|
|
|
|
|
|
|
|
3,13 |
|
|
|
|
|
|
|
|
|
|
|
|
|
|
|
|
|
|
|
|
Brunei |
|
|
|
|
|
|
|
|
|
|
|
|
|
|
|
|
|
|
|
|
|
|
|
|
2,90 |
|
|
|
|
|
|
|
|
|
|
|
|
|
|
|
|
|
|
|
||||
Spain |
|
|
|
|
|
|
|
|
|
|
|
|
|
|
|
|
|
|
|
|
|
|
|
2,79 |
|
|
|
|
|
|
|
|
|
|
|
|
|
|
|
|
|
|
|
|||||
Slovenia |
|
|
|
|
|
|
|
|
|
|
|
|
|
|
|
|
|
|
|
|
|
|
|
2,73 |
|
|
|
|
|
|
|
|
|
|
|
|
|
|
|
|
|
|
|
|
||||
Croatia |
|
|
|
|
|
|
|
|
|
|
|
|
|
|
|
|
|
|
|
|
|
|
|
2,70 |
|
|
|
|
|
|
|
|
|
|
|
|
|
|
|
|
|
|
|
|
||||
Sweden |
|
|
|
|
|
|
|
|
|
|
|
|
|
|
|
|
|
|
|
|
|
|
|
2,67 |
|
|
|
|
|
|
|
|
|
|
|
|
|
|
|
|
|
|
|
|
||||
Jordan |
|
|
|
|
|
|
|
|
|
|
|
|
|
|
|
|
|
|
|
|
|
|
2,50 |
|
|
|
|
|
|
|
|
|
|
|
|
|
|
|
|
|
|
|
|
|
||||
New Zealand |
|
|
|
|
|
|
|
|
|
|
|
|
|
|
|
|
|
|
|
|
|
|
2,47 |
|
|
|
|
|
|
|
|
|
|
|
|
|
|
|
|
|
|
|
|
|
||||
Denmark |
|
|
|
|
|
|
|
|
|
|
|
|
|
|
|
|
|
|
|
|
|
2,36 |
|
|
|
|
|
|
|
|
|
|
|
|
|
|
|
|
|
|
|
|
|
|
|
|||
Serbia |
|
|
|
|
|
|
|
|
|
|
|
|
|
|
|
|
|
|
|
|
|
2,34 |
|
|
|
|
|
|
|
|
|
|
|
|
|
|
|
|
|
|
|
|
|
|
|
|||
Finland |
|
|
|
|
|
|
|
|
|
|
|
|
|
|
|
|
|
|
|
|
|
2,31 |
|
|
|
|
|
|
|
|
|
|
|
|
|
|
|
|
|
|
|
|
|
|
|
|
||
Greece |
|
|
|
|
|
|
|
|
|
|
|
|
|
|
|
|
|
|
|
|
|
2,27 |
|
|
|
|
|
|
|
|
|
|
|
|
|
|
|
|
|
|
|
|
|
|
|
|
||
Germany |
|
|
|
|
|
|
|
|
|
|
|
|
|
|
|
|
|
|
|
|
|
2,26 |
|
|
|
|
|
|
|
|
|
|
|
|
|
|
|
|
|
|
|
|
|
|
|
|
||
Hungary |
|
|
|
|
|
|
|
|
|
|
|
|
|
|
|
|
|
|
|
|
2,10 |
|
|
|
|
|
|
|
|
|
|
|
|
|
|
|
|
|
|
|
|
|
|
|
|
|
||
Armenia |
|
|
|
|
|
|
|
|
|
|
|
|
|
|
|
|
|
1,88 |
|
|
|
|
|
|
|
|
|
|
|
|
|
|
|
|
|
|
|
|
|
|
|
|
|
|
||||
Ukraine |
|
|
|
|
|
|
|
|
|
|
|
|
|
|
|
|
|
1,82 |
|
|
|
|
|
|
|
|
|
|
|
|
|
|
|
|
|
|
|
|
|
|
|
|
|
|
||||
Czech Republic |
|
|
|
|
|
|
|
|
|
|
|
|
|
|
|
|
|
1,72 |
|
|
|
|
|
|
|
|
|
|
|
|
|
|
|
|
|
|
|
|
|
|
|
|
|
|
|
|||
Slovakia |
|
|
|
|
|
|
|
|
|
|
|
|
|
|
|
|
|
1,70 |
|
|
|
|
|
|
|
|
|
|
|
|
|
|
|
|
|
|
|
|
|
|
|
|
|
|
|
|||
Norway |
|
|
|
|
|
|
|
|
|
|
|
|
|
|
|
|
|
1,70 |
|
|
|
|
|
|
|
|
|
|
|
|
|
|
|
|
|
|
|
|
|
|
|
|
|
|
|
|||
Malaysia |
|
|
|
|
|
|
|
|
|
|
|
|
|
|
|
1,52 |
|
|
|
|
|
|
|
|
|
|
|
|
|
|
|
|
|
|
|
|
|
|
|
|
|
|
|
|
||||
Switzerland |
|
|
|
|
|
|
|
|
|
|
|
|
|
|
|
1,47 |
|
|
|
|
|
|
|
|
|
|
|
|
|
|
|
|
|
|
|
|
|
|
|
|
|
|
|
|
||||
Romania |
|
|
|
|
|
|
|
|
|
|
|
|
|
|
|
1,45 |
|
|
|
|
|
|
|
|
|
|
|
|
|
|
|
|
|
|
|
|
|
|
|
|
|
|
|
|
||||
Oman |
|
|
|
|
|
|
|
|
|
|
|
|
|
|
1,28 |
|
|
|
|
|
|
|
|
|
|
|
|
|
|
|
|
|
|
|
|
|
|
|
|
|
|
|
|
|
|
|
||
Argentina |
|
|
|
|
|
|
|
|
|
|
|
|
|
|
1,24 |
|
|
|
|
|
|
|
|
|
|
|
|
|
|
|
|
|
|
|
|
|
|
|
|
|
|
|
|
|
|
|
||
Mongolia |
|
|
|
|
|
|
|
|
|
|
|
|
|
|
1,23 |
|
|
|
|
|
|
|
|
|
|
|
|
|
|
|
|
|
|
|
|
|
|
|
|
|
|
|
|
|
|
|
||
India |
|
|
|
|
|
|
|
|
|
|
|
|
|
|
1,18 |
|
|
|
|
|
|
|
|
|
|
|
|
|
|
|
|
|
|
|
|
|
|
|
|
|
|
|
|
|
|
|
||
Kuwait |
|
|
|
|
|
|
|
|
|
|
|
|
|
|
1,18 |
|
|
|
|
|
|
|
|
|
|
|
|
|
|
|
|
|
|
|
|
|
|
|
|
|
|
|
|
|
|
|
||
Canada |
|
|
|
|
|
|
|
|
|
|
|
|
|
|
1,03 |
|
|
|
|
|
|
|
|
|
|
|
|
|
|
|
|
|
|
|
|
|
|
|
|
|
|
|
|
|
|
|
|
|
Russia |
|
|
|
|
|
|
|
|
|
|
|
|
|
|
0,97 |
|
|
|
|
|
|
|
|
|
|
|
|
|
|
|
|
|
|
|
|
|
|
|
|
|
|
|
|
|
|
|
|
|
Liechtenstein |
|
|
|
|
|
|
|
|
|
|
|
|
|
|
0,95 |
|
|
|
|
|
|
|
|
|
|
|
|
|
|
|
|
|
|
|
|
|
|
|
|
|
|
|
|
|
|
|
|
|
Republic of Korea |
|
|
|
|
|
|
|
|
|
|
|
0,82 |
|
|
|
|
|
|
|
|
|
|
|
|
|
|
|
|
|
|
|
|
|
|
|
|
|
|
|
|
|
|
|
|
|
|||
Kazachstan |
|
|
|
|
|
|
|
|
0,78 |
|
|
|
|
|
|
|
|
|
|
|
|
|
|
|
|
|
|
|
|
|
|
|
|
|
|
|
|
|
|
|
|
|
||||||
Kyrgyzstan |
|
|
|
|
|
|
|
|
|
|
|
|
|
|
|
|
|
|
|
|
|
|
|
|
|
|
|
|
|
|
|
|
|
|
|
|
|
|
|
|
|
|
|
|||||
|
|
|
|
|
|
|
0,77 |
|
|
|
|
|
|
|
|
|
|
|
|
|
|
|
|
|
|
|
|
|
|
|
|
|
|
|
|
|
|
|
|
|
||||||||
Singapore |
|
|
|
|
|
|
|
|
|
|
|
|
|
|
|
|
|
|
|
|
|
|
|
|
|
|
|
|
|
|
|
|
|
|
|
|
|
|
|
|
|
|||||||
|
|
|
|
|
0,76 |
|
|
|
|
|
|
|
|
|
|
|
|
|
|
|
|
|
|
|
|
|
|
|
|
|
|
|
|
|
|
|
|
|
||||||||||
Belarus |
|
|
|
|
|
|
|
|
|
|
|
|
|
|
|
|
|
|
|
|
|
|
|
|
|
|
|
|
|
|
|
|
|
|
|
|
|
|
|
|
|
|||||||
|
|
|
|
0,69 |
|
|
|
|
|
|
|
|
|
|
|
|
|
|
|
|
|
|
|
|
|
|
|
|
|
|
|
|
|
|
|
|
|
|
||||||||||
Moldova |
|
|
|
|
|
|
|
|
|
|
|
|
|
|
|
|
|
|
|
|
|
|
|
|
|
|
|
|
|
|
|
|
|
|
|
|
|
|
|
|
||||||||
|
|
|
0,52 |
|
|
|
|
|
|
|
|
|
|
|
|
|
|
|
|
|
|
|
|
|
|
|
|
|
|
|
|
|
|
|
|
|
|
|||||||||||
Qatar |
|
|
|
|
|
|
|
|
|
|
|
|
|
|
|
|
|
|
|
|
|
|
|
|
|
|
|
|
|
|
|
|
|
|
|
|
|
|
|
|
||||||||
|
|
|
0,50 |
|
|
|
|
|
|
|
|
|
|
|
|
|
|
|
|
|
|
|
|
|
|
|
|
|
|
|
|
|
|
|
|
|
|
|||||||||||
Peru |
|
|
0,36 |
|
|
|
|
|
|
|
|
|
|
|
|
|
|
|
|
|
|
|
|
|
|
|
|
|
|
|
|
|
|
|
|
|
|
|
|
|
||||||||
Japan |
|
|
0,31 |
|
|
|
|
|
|
|
|
|
|
|
|
|
|
|
|
|
|
|
|
|
|
|
|
|
|
|
|
|
|
|
|
|
|
|
|
|
|
|||||||
Phillippines |
|
0,16 |
|
|
|
|
|
|
|
|
|
|
|
|
|
|
|
|
|
|
|
|
|
|
|
|
|
|
|
|
|
|
|
|
|
|
|
|
|
|
|
|
|
|
||||
Bangladesh |
|
0,11 |
|
|
|
|
|
|
|
|
|
|
|
|
|
|
|
|
|
|
|
|
|
|
|
|
|
|
|
|
|
|
|
|
|
|
|
|
|
|
|
|
|
|
|
|
||
Bhutan |
|
0,09 |
|
|
|
|
|
|
|
|
|
|
|
|
|
|
|
|
|
|
|
|
|
|
|
|
|
|
|
|
|
|
|
|
|
|
|
|
|
|
|
|
|
|
|
|
||
Taiwan |
|
0,07 |
|
|
|
|
|
|
|
|
|
|
|
|
|
|
|
|
|
|
|
|
|
|
|
|
|
|
|
|
|
|
|
|
|
|
|
|
|
|
|
|
|
|
|
|
||
|
|
|
|
|
|
|
|
|
|
|
|
|
|
|
|
|
|
|
|
|
|
|
|
|
|
|
|
|
|
|
|
|
|
|
|
|
|
|
|
|
|
|
|
|||||
Vietnam |
|
0,03 |
|
|
|
|
|
|
|
|
|
|
|
|
|
|
|
|
|
|
|
|
|
|
|
|
|
|
|
|
|
|
|
|
|
|
|
|
|
|
|
|
|
|
|
|
||
|
|
|
|
|
|
|
|
|
|
|
|
|
|
|
|
|
|
|
|
|
|
|
|
|
|
|
|
|
|
|
|
|
|
|
|
|
|
|
|
|
|
|
|
|||||
Myanmar |
|
0,03 |
|
|
|
|
|
|
|
|
|
|
|
|
|
|
|
|
|
|
|
|
|
|
|
|
|
|
|
|
|
|
|
|
|
|
|
|
|
|
|
|
|
|
|
|
||
|
|
|
|
|
|
|
|
|
|
|
|
|
|
|
|
|
|
|
|
|
|
|
|
|
|
|
|
|
|
|
|
|
|
|
|
|
|
|
|
|
|
|
|
|||||
Nepal |
|
0,03 |
|
|
|
|
|
|
|
|
|
|
|
|
|
|
|
|
|
|
|
|
|
|
|
|
|
|
|
|
|
|
|
|
|
|
|
|
|
|
|
|
|
|
|
|
||
0 |
1 |
|
|
|
2 |
|
3 |
|
|
|
4 |
5 |
6 |
7 |
8 |
|||||||||||||||||||||||||||||||||
Fig. 2: Average number of fires per 1.000 inh. (2014-2018)
Рис. 2: Среднее число пожаров на 1.000 чел. (2014-2018) Bild 2: Mittlere Brandanzahl je 1.000 Einwohner (2014-2018)
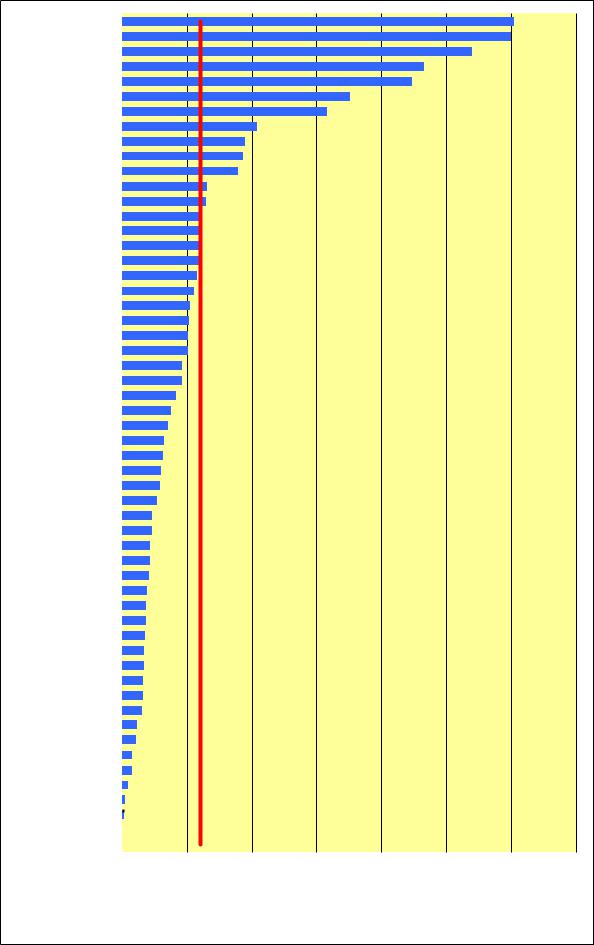
Belarus |
|
|
|
|
|
|
|
|
|
|
|
|
|
|
|
|
|
|
|
|
|
|
|
|
|
|
|
|
|
|
|
6,05 |
|
|
|
|
|
|
|
|
|
|
|
|
|
|
|
|
|
|
|
|
|
|
|
|
|
|
|
|
|
|
|
|
|||
Russia |
|
|
|
|
|
|
|
|
|
|
|
|
|
|
|
|
|
|
|
|
|
|
|
|
|
|
|
|
|
|
|
6,00 |
|
Lithuania |
|
|
|
|
|
|
|
|
|
|
|
|
|
|
|
|
|
|
|
|
|
|
|
|
|
|
|
|
|
|
5,40 |
|
|
Ukraine |
|
|
|
|
|
|
|
|
|
|
|
|
|
|
|
|
|
|
|
|
|
|
|
|
|
|
|
|
4,66 |
|
|
|
|
Latvia |
|
|
|
|
|
|
|
|
|
|
|
|
|
|
|
|
|
|
|
|
|
|
|
|
|
|
|
4,48 |
|
|
|
|
|
Estonia |
|
|
|
|
|
|
|
|
|
|
|
|
|
|
|
|
|
|
|
|
|
|
|
|
|
3,52 |
|
|
|
|
|
|
|
Moldova |
|
|
|
|
|
|
|
|
|
|
|
|
|
|
|
|
|
|
|
|
|
|
|
|
3,17 |
|
|
|
|
|
|
|
|
Kazachstan |
|
|
|
|
|
|
|
|
|
|
|
|
|
|
|
|
|
|
|
|
|
2,08 |
|
|
|
|
|
|
|
|
|
|
|
Romania |
|
|
|
|
|
|
|
|
|
|
|
|
|
|
|
|
|
|
|
1,90 |
|
|
|
|
|
|
|
|
|
|
|
||
Mongolia |
|
|
|
|
|
|
|
|
|
|
|
|
|
|
|
|
|
|
|
1,86 |
|
|
|
|
|
|
|
|
|
|
|
||
Bulgaria |
|
|
|
|
|
|
|
|
|
|
|
|
|
|
|
|
|
|
|
1,79 |
|
|
|
|
|
|
|
|
|
|
|
||
Finland |
|
|
|
|
|
|
|
|
|
|
|
|
|
|
|
|
|
1,32 |
|
|
|
|
|
|
|
|
|
|
|
|
|
|
|
Poland |
|
|
|
|
|
|
|
|
|
|
|
|
|
|
|
|
|
1,30 |
|
|
|
|
|
|
|
|
|
|
|
|
|
|
|
India |
|
|
|
|
|
|
|
|
|
|
|
|
|
|
|
|
1,23 |
|
|
|
|
|
|
|
|
|
|
|
|
|
|
|
|
Greece |
|
|
|
|
|
|
|
|
|
|
|
|
|
|
|
1,21 |
|
|
|
|
|
|
|
|
|
|
|
|
|
|
|
||
Kyrgyzstan |
|
|
|
|
|
|
|
|
|
|
|
|
|
|
|
1,21 |
|
|
|
|
|
|
|
|
|
|
|
|
|
|
|
||
Japan |
|
|
|
|
|
|
|
|
|
|
|
|
|
|
|
1,20 |
|
|
|
|
|
|
|
|
|
|
|
|
|
|
|
||
Denmark |
|
|
|
|
|
|
|
|
|
|
|
|
|
|
|
1,16 |
|
|
|
|
|
|
|
|
|
|
|
|
|
|
|
||
Hungary |
|
|
|
|
|
|
|
|
|
|
|
|
|
|
|
1,11 |
|
|
|
|
|
|
|
|
|
|
|
|
|
|
|
||
Brunei |
|
|
|
|
|
|
|
|
|
|
|
|
|
|
|
1,05 |
|
|
|
|
|
|
|
|
|
|
|
|
|
|
|
||
USA |
|
|
|
|
|
|
|
|
|
|
|
|
|
|
|
1,04 |
|
|
|
|
|
|
|
|
|
|
|
|
|
|
|
||
Czech Republic |
|
|
|
|
|
|
|
|
|
|
|
|
|
|
|
1,02 |
|
|
|
|
|
|
|
|
|
|
|
|
|
|
|
||
Serbia |
|
|
|
|
|
|
|
|
|
|
|
|
|
|
|
1,02 |
|
|
|
|
|
|
|
|
|
|
|
|
|
|
|
||
Slovakia |
|
|
|
|
|
|
|
|
|
|
|
|
|
|
|
0,93 |
|
|
|
|
|
|
|
|
|
|
|
|
|
|
|
||
Sweden |
|
|
|
|
|
|
|
|
|
|
|
|
|
|
|
0,92 |
|
|
|
|
|
|
|
|
|
|
|
|
|
|
|
||
Kuwait |
|
|
|
|
|
|
|
|
|
|
|
|
|
|
0,83 |
|
|
|
|
|
|
|
|
|
|
|
|
|
|
|
|||
Norway |
|
|
|
|
|
|
|
|
|
|
|
|
|
0,76 |
|
|
|
|
|
|
|
|
|
|
|
|
|
|
|
|
|||
Republic of… |
|
|
|
|
|
|
|
|
|
|
|
0,71 |
|
|
|
|
|
|
|
|
|
|
|
|
|
|
|
|
|
||||
Armenia |
|
|
|
|
|
|
|
|
|
|
|
|
0,64 |
|
|
|
|
|
|
|
|
|
|
|
|
|
|
|
|
|
|
||
|
|
|
|
|
|
|
|
|
|
|
|
|
|
|
|
|
|
|
|
|
|
|
|
|
|
|
|
|
|||||
Ireland |
|
|
|
|
|
|
|
|
|
|
|
0,64 |
|
|
|
|
|
|
|
|
|
|
|
|
|
|
|
|
|
|
|||
Croatia |
|
|
|
|
|
|
|
|
|
|
|
0,60 |
|
|
|
|
|
|
|
|
|
|
|
|
|
|
|
|
|
|
|||
Taiwan |
|
|
|
|
|
|
|
|
|
|
0,59 |
|
|
|
|
|
|
|
|
|
|
|
|
|
|
|
|
|
|
||||
Great Britain |
|
|
|
|
|
|
|
|
|
0,54 |
|
|
|
|
|
|
|
|
|
|
|
|
|
|
|
|
|
|
|||||
Iceland |
|
|
|
|
|
|
|
|
0,47 |
|
|
|
|
|
|
|
|
|
|
|
|
|
|
|
|
|
|
||||||
Malaysia |
|
|
|
|
|
|
|
0,46 |
|
|
|
|
|
|
|
|
|
|
|
|
|
|
|
|
|
|
|||||||
Germany |
|
|
|
|
|
|
|
0,44 |
|
|
|
|
|
|
|
|
|
|
|
|
|
|
|
|
|
|
|||||||
France |
|
|
|
|
|
|
|
0,43 |
|
|
|
|
|
|
|
|
|
|
|
|
|
|
|
|
|
|
|||||||
Canada |
|
|
|
|
|
|
|
0,42 |
|
|
|
|
|
|
|
|
|
|
|
|
|
|
|
|
|
|
|||||||
Italy |
|
|
|
|
|
|
0,39 |
|
|
|
|
|
|
|
|
|
|
|
|
|
|
|
|
|
|
||||||||
Spain |
|
|
|
|
|
0,37 |
|
|
|
|
|
|
|
|
|
|
|
|
|
|
|
|
|
|
|||||||||
Bhutan |
|
|
|
|
|
0,37 |
|
|
|
|
|
|
|
|
|
|
|
|
|
|
|
|
|
|
|||||||||
Costa Rica |
|
|
|
|
0,35 |
|
|
|
|
|
|
|
|
|
|
|
|
|
|
|
|
|
|
||||||||||
Qatar |
|
|
|
|
0,34 |
|
|
|
|
|
|
|
|
|
|
|
|
|
|
|
|
|
|
||||||||||
Netherlands |
|
|
|
0,34 |
|
|
|
|
|
|
|
|
|
|
|
|
|
|
|
|
|
|
|||||||||||
New Zealand |
|
|
|
0,32 |
|
|
|
|
|
|
|
|
|
|
|
|
|
|
|
|
|
|
|
||||||||||
Jordan |
|
|
0,32 |
|
|
|
|
|
|
|
|
|
|
|
|
|
|
|
|
|
|
|
|||||||||||
Phillippines |
|
|
0,31 |
|
|
|
|
|
|
|
|
|
|
|
|
|
|
|
|
|
|
|
|||||||||||
Israel |
|
0,23 |
|
|
|
|
|
|
|
|
|
|
|
|
|
|
|
|
|
|
|
|
|||||||||||
Nepal |
|
0,22 |
|
|
|
|
|
|
|
|
|
|
|
|
|
|
|
|
|
|
|
|
|||||||||||
Slovenia |
|
0,16 |
|
|
|
|
|
|
|
|
|
|
|
|
|
|
|
|
|
|
|
|
|
||||||||||
Myanmar |
|
0,16 |
|
|
|
|
|
|
|
|
|
|
|
|
|
|
|
|
|
|
|
|
|
||||||||||
Vietnam |
|
0,09 |
|
|
|
|
|
|
|
|
|
|
|
|
|
|
|
|
|
|
|
|
|
|
|
||||||||
Bangladesh |
|
0,05 |
|
|
|
|
|
|
|
|
|
|
|
|
|
|
|
|
|
|
|
|
|
|
|
|
|||||||
|
|
|
|
|
|
|
|
|
|
|
|
|
|
|
|
|
|
|
|
|
|
|
|
||||||||||
Singapore |
|
0,04 |
|
|
|
|
|
|
|
|
|
|
|
|
|
|
|
|
|
|
|
|
|
|
|
|
|||||||
|
|
|
|
|
|
|
|
|
|
|
|
|
|
|
|
|
|
|
|
|
|
|
|
||||||||||
Liechtenstein |
|
0,00 |
|
|
|
|
|
|
|
|
|
|
|
|
|
|
|
|
|
|
|
|
|
|
|
|
|||||||
Luxemburg |
0,00 |
|
|
|
|
|
|
|
|
|
|
|
|
|
|
|
|
|
|
|
|
|
|
|
|
||||||||
|
|
|
|
|
|
|
|
|
|
|
|
|
|
|
|
|
|
|
|
|
|
|
|
|
|
|
|
|
|
|
|
|
|
0 |
1 |
|
|
|
|
2 |
|
3 |
4 |
5 |
6 |
7 |
|||||||||||||||||||||
Fig. 3: Average number of fire deaths per 100.000 inh. (2014-2018)
Рис. 3: Среднее число погибших на 100.000 чел. (2014-2018) Bild 3: Mittlere Brandtotenanzahl je 100.000 Einwohner (2014-2018)
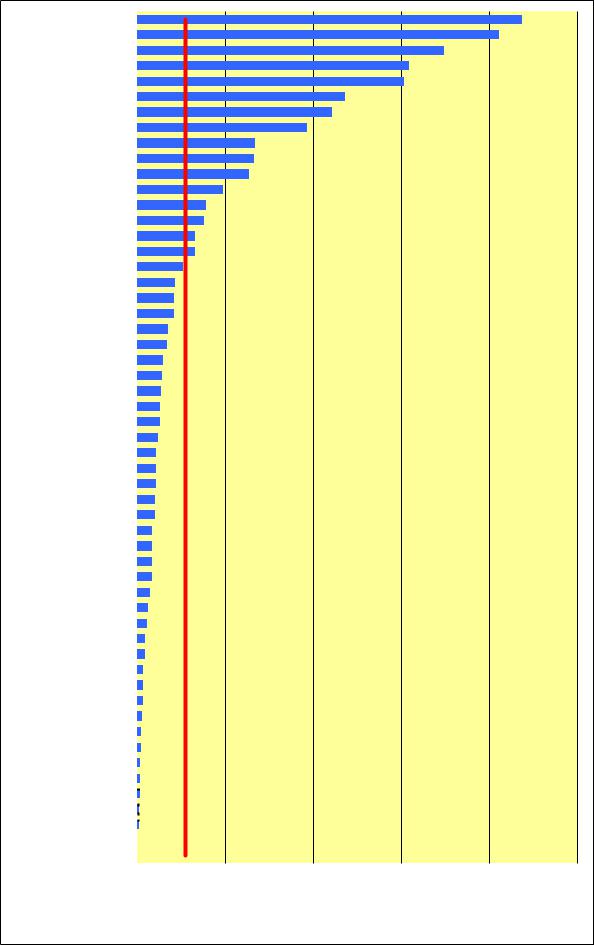
Belarus |
|
|
|
|
|
|
|
|
|
|
|
|
|
|
|
|
|
|
|
|
|
|
|
|
|
|
8,76 |
|
|
|
|
|
|
|
|
|
|
|
|
|
|
|
|
|
|
|
|
|
|
|
|
|
|
|
|||
Taiwan |
|
|
|
|
|
|
|
|
|
|
|
|
|
|
|
|
|
|
|
|
|
|
|
|
|
8,24 |
|
|
Nepal |
|
|
|
|
|
|
|
|
|
|
|
|
|
|
|
|
|
|
|
|
|
|
|
6,99 |
|
|
|
|
Russia |
|
|
|
|
|
|
|
|
|
|
|
|
|
|
|
|
|
|
|
|
|
|
6,18 |
|
|
|
|
|
Moldova |
|
|
|
|
|
|
|
|
|
|
|
|
|
|
|
|
|
|
|
|
|
6,07 |
|
|
|
|
|
|
Myanmar |
|
|
|
|
|
|
|
|
|
|
|
|
|
|
|
|
|
|
|
4,74 |
|
|
|
|
|
|
|
|
Bhutan |
|
|
|
|
|
|
|
|
|
|
|
|
|
|
|
|
|
|
4,44 |
|
|
|
|
|
|
|
|
|
Japan |
|
|
|
|
|
|
|
|
|
|
|
|
|
|
|
|
3,86 |
|
|
|
|
|
|
|
|
|
||
Kazachstan |
|
|
|
|
|
|
|
|
|
|
|
|
|
|
|
2,68 |
|
|
|
|
|
|
|
|
|
|
|
|
Vietnam |
|
|
|
|
|
|
|
|
|
|
|
|
|
|
|
2,65 |
|
|
|
|
|
|
|
|
|
|
|
|
Ukraine |
|
|
|
|
|
|
|
|
|
|
|
|
|
|
|
2,56 |
|
|
|
|
|
|
|
|
|
|
|
|
Phillippines |
|
|
|
|
|
|
|
|
|
|
|
|
|
1,96 |
|
|
|
|
|
|
|
|
|
|
|
|
|
|
Kyrgyzstan |
|
|
|
|
|
|
|
|
|
|
|
|
1,57 |
|
|
|
|
|
|
|
|
|
|
|
|
|
|
|
Mongolia |
|
|
|
|
|
|
|
|
|
|
|
|
1,53 |
|
|
|
|
|
|
|
|
|
|
|
|
|
|
|
Lithuania |
|
|
|
|
|
|
|
|
|
|
|
1,32 |
|
|
|
|
|
|
|
|
|
|
|
|
|
|
||
Romania |
|
|
|
|
|
|
|
|
|
|
|
1,31 |
|
|
|
|
|
|
|
|
|
|
|
|
|
|
||
India |
|
|
|
|
|
|
|
|
|
|
1,04 |
|
|
|
|
|
|
|
|
|
|
|
|
|
|
|
||
Republic of Korea |
|
|
|
|
|
|
|
|
|
|
0,87 |
|
|
|
|
|
|
|
|
|
|
|
|
|
|
|
||
Estonia |
|
|
|
|
|
|
|
|
|
|
0,84 |
|
|
|
|
|
|
|
|
|
|
|
|
|
|
|
||
Latvia |
|
|
|
|
|
|
|
|
|
|
0,84 |
|
|
|
|
|
|
|
|
|
|
|
|
|
|
|
||
Kuwait |
|
|
|
|
|
|
|
|
0,71 |
|
|
|
|
|
|
|
|
|
|
|
|
|
|
|
|
|||
Qatar |
|
|
|
|
|
|
|
0,69 |
|
|
|
|
|
|
|
|
|
|
|
|
|
|
|
|
||||
Czech Republic |
|
|
|
|
|
|
|
0,60 |
|
|
|
|
|
|
|
|
|
|
|
|
|
|
|
|
||||
Finland |
|
|
|
|
|
|
0,57 |
|
|
|
|
|
|
|
|
|
|
|
|
|
|
|
|
|
||||
Slovakia |
|
|
|
|
|
|
0,55 |
|
|
|
|
|
|
|
|
|
|
|
|
|
|
|
|
|
||||
Greece |
|
|
|
|
|
|
0,54 |
|
|
|
|
|
|
|
|
|
|
|
|
|
|
|
|
|
||||
Hungary |
|
|
|
|
|
0,53 |
|
|
|
|
|
|
|
|
|
|
|
|
|
|
|
|
|
|||||
Denmark |
|
|
|
|
|
0,49 |
|
|
|
|
|
|
|
|
|
|
|
|
|
|
|
|
|
|||||
Norway |
|
|
|
|
0,45 |
|
|
|
|
|
|
|
|
|
|
|
|
|
|
|
|
|
||||||
Serbia |
|
|
|
0,43 |
|
|
|
|
|
|
|
|
|
|
|
|
|
|
|
|
|
|||||||
|
|
|
|
|
|
|
|
|
|
|
|
|
|
|
|
|
|
|
||||||||||
Bangladesh |
|
|
0,43 |
|
|
|
|
|
|
|
|
|
|
|
|
|
|
|
|
|
||||||||
Canada |
|
|
0,41 |
|
|
|
|
|
|
|
|
|
|
|
|
|
|
|
|
|
||||||||
Bulgaria |
|
|
0,41 |
|
|
|
|
|
|
|
|
|
|
|
|
|
|
|
|
|
||||||||
Brunei |
|
0,35 |
|
|
|
|
|
|
|
|
|
|
|
|
|
|
|
|
|
|
||||||||
Sweden |
|
0,35 |
|
|
|
|
|
|
|
|
|
|
|
|
|
|
|
|
|
|
||||||||
Poland |
|
0,34 |
|
|
|
|
|
|
|
|
|
|
|
|
|
|
|
|
|
|
||||||||
Armenia |
|
0,34 |
|
|
|
|
|
|
|
|
|
|
|
|
|
|
|
|
|
|
||||||||
Malaysia |
|
0,30 |
|
|
|
|
|
|
|
|
|
|
|
|
|
|
|
|
|
|
||||||||
USA |
|
0,26 |
|
|
|
|
|
|
|
|
|
|
|
|
|
|
|
|
|
|
|
|||||||
Croatia |
|
0,22 |
|
|
|
|
|
|
|
|
|
|
|
|
|
|
|
|
|
|
|
|||||||
|
|
|
|
|
|
|
|
|
|
|
|
|
|
|
|
|
|
|
||||||||||
Germany |
|
0,19 |
|
|
|
|
|
|
|
|
|
|
|
|
|
|
|
|
|
|
|
|||||||
Great Britain |
|
0,17 |
|
|
|
|
|
|
|
|
|
|
|
|
|
|
|
|
|
|
|
|||||||
Spain |
|
0,13 |
|
|
|
|
|
|
|
|
|
|
|
|
|
|
|
|
|
|
|
|
||||||
New Zealand |
|
0,13 |
|
|
|
|
|
|
|
|
|
|
|
|
|
|
|
|
|
|
|
|
||||||
Jordan |
|
0,13 |
|
|
|
|
|
|
|
|
|
|
|
|
|
|
|
|
|
|
|
|
||||||
Ireland |
|
0,12 |
|
|
|
|
|
|
|
|
|
|
|
|
|
|
|
|
|
|
|
|
||||||
France |
|
0,10 |
|
|
|
|
|
|
|
|
|
|
|
|
|
|
|
|
|
|
|
|
||||||
Italy |
|
0,10 |
|
|
|
|
|
|
|
|
|
|
|
|
|
|
|
|
|
|
|
|
||||||
Costa Rica |
|
0,08 |
|
|
|
|
|
|
|
|
|
|
|
|
|
|
|
|
|
|
|
|
||||||
|
|
|
|
|
|
|
|
|
|
|
|
|
|
|
|
|
|
|
|
|||||||||
Netherlands |
|
0,07 |
|
|
|
|
|
|
|
|
|
|
|
|
|
|
|
|
|
|
|
|
||||||
|
|
|
|
|
|
|
|
|
|
|
|
|
|
|
|
|
|
|
|
|||||||||
|
|
|
|
|
|
|
|
|
|
|
|
|
||||||||||||||||
Slovenia |
|
0,06 |
|
|
|
|
|
|
|
|
|
|
|
|
|
|
|
|
|
|
|
|
||||||
|
|
|
|
|
|
|
|
|
|
|
|
|
|
|
|
|
|
|
|
|||||||||
|
|
|
|
|
|
|
|
|
|
|
|
|
|
|
|
|
|
|
|
|||||||||
Singapore |
0,05 |
|
|
|
|
|
|
|
|
|
|
|
|
|
|
|
|
|
|
|
|
|||||||
|
|
|
|
|
|
|
|
|
|
|
|
|
|
|
|
|
|
|
|
|||||||||
|
|
|
|
|
|
|
|
|
|
|
|
|
|
|
|
|
|
|
|
|
|
|
||||||
Israel |
|
0,04 |
|
|
|
|
|
|
|
|
|
|
|
|
|
|
|
|
|
|
|
|
||||||
|
|
|
|
|
|
|
|
|
|
|
|
|
|
|
|
|
|
|
|
|||||||||
|
|
|
|
|
|
|
|
|
|
|
|
|
|
|
|
|
|
|
|
|||||||||
Liechtenstein |
|
0,00 |
|
|
|
|
|
|
|
|
|
|
|
|
|
|
|
|
|
|
|
|
||||||
Luxemburg |
0,00 |
|
|
|
|
|
|
|
|
|
|
|
|
|
|
|
|
|
|
|
|
|||||||
|
|
|
|
|
|
|
|
|
|
|
|
|
|
|
|
|
|
|
|
|
|
|
|
|
|
|
|
|
0 |
2 |
|
4 |
|
|
6 |
8 |
10 |
||||||||||||||||||||
Fig. 4: Average number of fire deaths per 100 fires (2014-2018)
Рис. 4: Среднее число погибших на 100 пожаров (2014-2018)
Bild 4: Mittlere Brandtotenanzahl je 100 Brände (2014-2018)
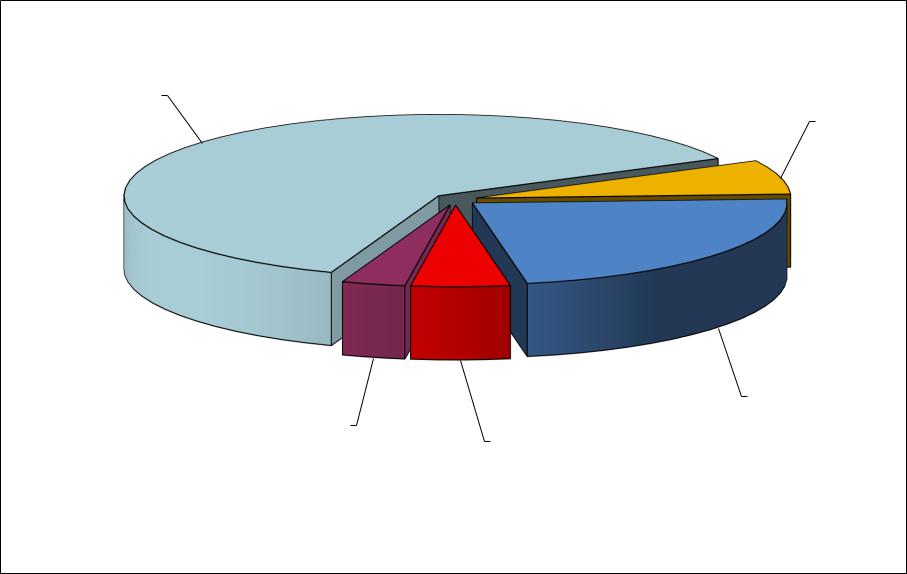
Medical aid/
Мед. помощь/
Medizin. Hilfe 61,8 %
Incidents, accidents/ |
|
Аварии/ |
Fires/ |
Havarie |
Пожары/ |
3,3 % |
Brände |
|
5,1 % |
False/
Ложные/ Fehleinsätze
6,8 %
Other/
Другие/
Sonstiges 23,0 %
Fig. 5: Type of fire service calls (2018)
Рис. 5: Структура выездов пожарных подразделений (2018) Bild 5: Einsatzstruktur der Feuerwehren (2018)
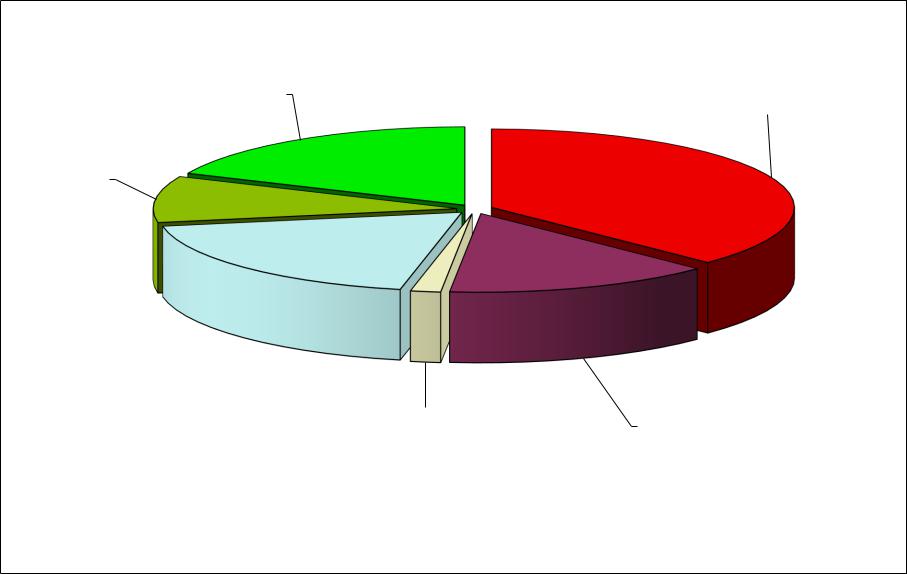
Other/
Другие/
Sonstige 18,3 %
Rubbish/
Мусор/ Müll
9,5 %
Grass,brush/
Трава/
Gras 18,9 %
Forests/
В лесах/
Wald 1,6 %
Structure/
в зданиях/ in Gebäuden
37,4 %
Vehicle/
На транспорте/
Transport 14,3 %
Fig. 6: Distribution of fires by types (2018)
Рис. 6: Распределение пожаров по местам возникновения (2018)
Bild 6: Verteilung der Brände nach Objekten der Brandentstehung (2018)
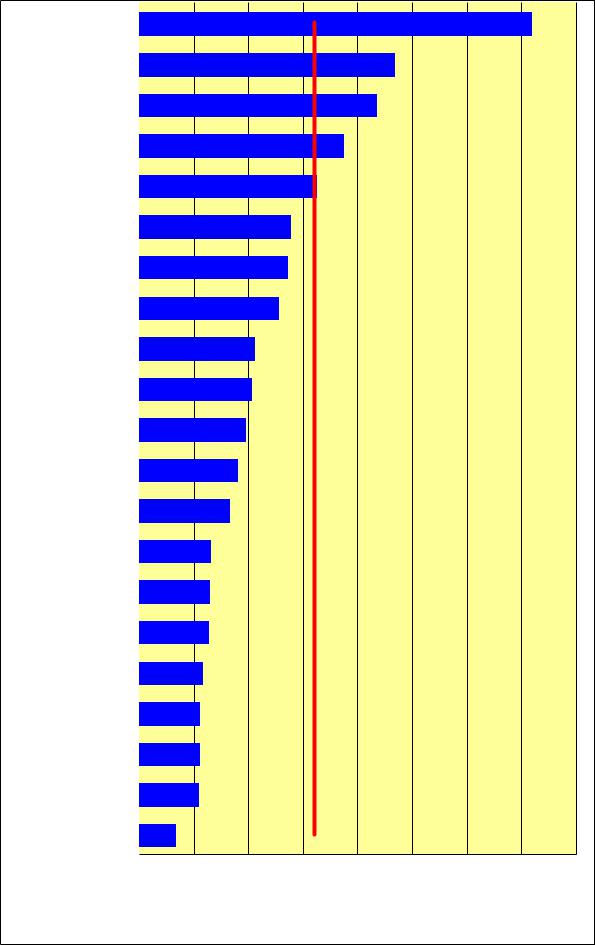
Luxemburg |
|
|
|
|
|
|
|
|
|
|
|
|
|
|
|
|
|
|
|
|
|
|
|
|
|
|
|
|
|
|
|
|
|
|
3,6 |
|
|
|
|
|
|
|
|
|
|
|
|
|
|
|
|
|
|
|
|
|
|
|
|
|
|
|
|
|
|
|
|
|
|
|
|||
|
|
|
|
|
|
|
|
|
|
|
|
|
|
|
|
|
|
|
|
|
|
|
|
|
|
|
|
|
|
|
|
|
|
|
|
|
|
|
|
|
|
|
|
|
|
|
|
|
|
|
|
|
|
|
|
|
|
|
|
|
|
|
|
|
|
|
|
|
|
|
|
|
|
Kazachstan |
|
|
|
|
|
|
|
|
|
|
|
|
|
|
|
|
|
|
|
|
|
|
|
|
2,3 |
|
|
|
|
|
|
|
|
|||
|
|
|
|
|
|
|
|
|
|
|
|
|
|
|
|
|
|
|
|
|
|
|
|
|
|
|
|
|
|
|
|
|||||
|
|
|
|
|
|
|
|
|
|
|
|
|
|
|
|
|
|
|
|
|
|
|
|
|
|
|
|
|
|
|
|
|
|
|
|
|
|
|
|
|
|
|
|
|
|
|
|
|
|
|
|
|
|
|
|
|
|
|
|
|
|
|
|
|
|
|
|
|
|
|
|
|
|
USA |
|
|
|
|
|
|
|
|
|
|
|
|
|
|
|
|
|
|
|
|
|
|
|
2,2 |
|
|
|
|
|
|
|
|
|
|
||
|
|
|
|
|
|
|
|
|
|
|
|
|
|
|
|
|
|
|
|
|
|
|
|
|
|
|
|
|
|
|
|
|
||||
|
|
|
|
|
|
|
|
|
|
|
|
|
|
|
|
|
|
|
|
|
|
|
|
|
|
|
|
|
|
|
|
|
|
|
|
|
|
|
|
|
|
|
|
|
|
|
|
|
|
|
|
|
|
|
|
|
|
|
|
|
|
|
|
|
|
|
|
|
|
|
|
|
|
France |
|
|
|
|
|
|
|
|
|
|
|
|
|
|
|
|
|
|
|
|
1,9 |
|
|
|
|
|
|
|
|
|
|
|
|
|||
|
|
|
|
|
|
|
|
|
|
|
|
|
|
|
|
|
|
|
|
|
|
|
|
|
|
|
|
|
|
|
|
|||||
|
|
|
|
|
|
|
|
|
|
|
|
|
|
|
|
|
|
|
|
|
|
|
|
|
|
|
|
|
|
|
|
|
|
|
|
|
|
|
|
|
|
|
|
|
|
|
|
|
|
|
|
|
|
|
|
|
|
|
|
|
|
|
|
|
|
|
|
|
|
|
|
|
|
Sweden |
|
|
|
|
|
|
|
|
|
|
|
|
|
|
|
|
|
|
|
1,6 |
|
|
|
|
|
|
|
|
|
|
|
|
|
|
|
|
|
|
|
|
|
|
|
|
|
|
|
|
|
|
|
|
|
|
|
|
|
|
|
|
|
|
|
|
|
|
|
|
|
|
|||
|
|
|
|
|
|
|
|
|
|
|
|
|
|
|
|
|
|
|
|
|
|
|
|
|
|
|
|
|
|
|
|
|
|
|
||
|
|
|
|
|
|
|
|
|
|
|
|
|
|
|
|
|
|
|
|
|
|
|
|
|
|
|
|
|
|
|
|
|
|
|
|
|
Finland |
|
|
|
|
|
|
|
|
|
|
|
|
|
|
|
1,4 |
|
|
|
|
|
|
|
|
|
|
|
|
|
|
|
|
||||
|
|
|
|
|
|
|
|
|
|
|
|
|
|
|
|
|
|
|
|
|
|
|
|
|
|
|
|
|
|
|||||||
|
|
|
|
|
|
|
|
|
|
|
|
|
|
|
|
|
|
|
|
|
|
|
|
|
|
|
|
|
|
|
|
|
|
|
|
|
|
|
|
|
|
|
|
|
|
|
|
|
|
|
|
|
|
|
|
|
|
|
|
|
|
|
|
|
|
|
|
|
|
|
|
|
|
Denmark |
|
|
|
|
|
|
|
|
|
|
|
|
|
|
1,4 |
|
|
|
|
|
|
|
|
|
|
|
|
|
|
|
|
|||||
|
|
|
|
|
|
|
|
|
|
|
|
|
|
|
|
|
|
|
|
|
|
|
|
|
|
|
|
|
|
|||||||
|
|
|
|
|
|
|
|
|
|
|
|
|
|
|
|
|
|
|
|
|
|
|
|
|
|
|
|
|
|
|
|
|
|
|
|
|
|
|
|
|
|
|
|
|
|
|
|
|
|
|
|
|
|
|
|
|
|
|
|
|
|
|
|
|
|
|
|
|
|
|
|
|
|
Slovenija |
|
|
|
|
|
|
|
|
|
|
|
|
|
1,3 |
|
|
|
|
|
|
|
|
|
|
|
|
|
|
|
|
|
|||||
|
|
|
|
|
|
|
|
|
|
|
|
|
|
|
|
|
|
|
|
|
|
|
|
|
|
|
|
|
|
|||||||
|
|
|
|
|
|
|
|
|
|
|
|
|
|
|
|
|
|
|
|
|
|
|
|
|
|
|
|
|
|
|
|
|||||
|
|
|
|
|
|
|
|
|
|
|
|
|
|
|
|
|
|
|
|
|
|
|
|
|
|
|
|
|
|
|
|
|
|
|
|
|
Croatia |
|
|
|
|
|
|
|
|
|
|
|
|
1,1 |
|
|
|
|
|
|
|
|
|
|
|
|
|
|
|
|
|
|
|
|
|
|
|
|
|
|
|
|
|
|
|
|
|
|
|
|
|
|
|
|
|
|
|
|
|
|
|
|
|
|
|
|
|
|||||||
|
|
|
|
|
|
|
|
|
|
|
|
|
|
|
|
|
|
|
|
|
|
|
|
|
|
|
|
|
|
|
|
|
||||
|
|
|
|
|
|
|
|
|
|
|
|
|
|
|
|
|
|
|
|
|
|
|
|
|
|
|
|
|
|
|
|
|
|
|
|
|
New Zealand |
|
|
|
|
|
|
|
|
|
|
|
1,0 |
|
|
|
|
|
|
|
|
|
|
|
|
|
|
|
|
|
|
|
|
|
|
||
|
|
|
|
|
|
|
|
|
|
|
|
|
|
|
|
|
|
|
|
|
|
|
|
|
|
|
|
|
|
|||||||
|
|
|
|
|
|
|
|
|
|
|
|
|
|
|
|
|
|
|
|
|
|
|
|
|
|
|
|
|
|
|
|
|
||||
|
|
|
|
|
|
|
|
|
|
|
|
|
|
|
|
|
|
|
|
|
|
|
|
|
|
|
|
|
|
|
|
|
|
|
|
|
Hungary |
|
|
|
|
|
|
|
|
|
1,0 |
|
|
|
|
|
|
|
|
|
|
|
|
|
|
|
|
|
|
|
|
|
|
||||
|
|
|
|
|
|
|
|
|
|
|
|
|
|
|
|
|
|
|
|
|
|
|
|
|
|
|
|
|||||||||
|
|
|
|
|
|
|
|
|
|
|
|
|
|
|
|
|
|
|
|
|
|
|
|
|
|
|
|
|
|
|
|
|
|
|||
|
|
|
|
|
|
|
|
|
|
|
|
|
|
|
|
|
|
|
|
|
|
|
|
|
|
|
|
|
|
|
|
|
|
|
|
|
Ukraine |
|
|
|
|
|
|
|
|
0,9 |
|
|
|
|
|
|
|
|
|
|
|
|
|
|
|
|
|
|
|
|
|
|
|||||
|
|
|
|
|
|
|
|
|
|
|
|
|
|
|
|
|
|
|
|
|
|
|
|
|
|
|
|
|||||||||
|
|
|
|
|
|
|
|
|
|
|
|
|
|
|
|
|
|
|
|
|
|
|
|
|
|
|
|
|
|
|
|
|
|
|
||
|
|
|
|
|
|
|
|
|
|
|
|
|
|
|
|
|
|
|
|
|
|
|
|
|
|
|
|
|
|
|
|
|
|
|
|
|
Russia |
|
|
|
|
|
|
|
0,8 |
|
|
|
|
|
|
|
|
|
|
|
|
|
|
|
|
|
|
|
|
|
|
||||||
|
|
|
|
|
|
|
|
|
|
|
|
|
|
|
|
|
|
|
|
|
|
|
|
|
|
|
|
|||||||||
|
|
|
|
|
|
|
|
|
|
|
|
|
|
|
|
|
|
|
|
|
|
|
|
|
|
|
|
|
|
|
|
|
|
|
|
|
|
|
|
|
|
|
|
|
|
|
|
|
|
|
|
|
|
|
|
|
|
|
|
|
|
|
|
|
|
|
|
|
|
|
|
|
|
Czech Republic |
|
|
|
|
|
|
0,7 |
|
|
|
|
|
|
|
|
|
|
|
|
|
|
|
|
|
|
|
|
|
|
|
|
|
|
|
||
|
|
|
|
|
|
|
|
|
|
|
|
|
|
|
|
|
|
|
|
|
|
|
|
|
|
|
|
|
|
|
|
|
||||
|
|
|
|
|
|
|
|
|
|
|
|
|
|
|
|
|
|
|
|
|
|
|
|
|
|
|
|
|
|
|
|
|
|
|
|
|
|
|
|
|
|
|
|
|
|
|
|
|
|
|
|
|
|
|
|
|
|
|
|
|
|
|
|
|
|
|
|
|
|
|
|
|
|
Jordan |
|
|
|
|
|
|
0,7 |
|
|
|
|
|
|
|
|
|
|
|
|
|
|
|
|
|
|
|
|
|
|
|
|
|
|
|
||
|
|
|
|
|
|
|
|
|
|
|
|
|
|
|
|
|
|
|
|
|
|
|
|
|
|
|
|
|
|
|
|
|
||||
|
|
|
|
|
|
|
|
|
|
|
|
|
|
|
|
|
|
|
|
|
|
|
|
|
|
|
|
|
|
|
|
|
|
|
|
|
|
|
|
|
|
|
|
|
|
|
|
|
|
|
|
|
|
|
|
|
|
|
|
|
|
|
|
|
|
|
|
|
|
|
|
|
|
Republic of Korea |
|
|
|
|
|
|
0,6 |
|
|
|
|
|
|
|
|
|
|
|
|
|
|
|
|
|
|
|
|
|
|
|
|
|
|
|
||
|
|
|
|
|
|
|
|
|
|
|
|
|
|
|
|
|
|
|
|
|
|
|
|
|
|
|
|
|
|
|
|
|
||||
|
|
|
|
|
|
|
|
|
|
|
|
|
|
|
|
|
|
|
|
|
|
|
|
|
|
|
|
|
|
|
|
|
|
|
|
|
|
|
|
|
|
|
|
|
|
|
|
|
|
|
|
|
|
|
|
|
|
|
|
|
|
|
|
|
|
|
|
|
|
|
|
|
|
Greece |
|
|
|
|
|
0,6 |
|
|
|
|
|
|
|
|
|
|
|
|
|
|
|
|
|
|
|
|
|
|
|
|
|
|
|
|
||
|
|
|
|
|
|
|
|
|
|
|
|
|
|
|
|
|
|
|
|
|
|
|
|
|
|
|
|
|
|
|
|
|
||||
|
|
|
|
|
|
|
|
|
|
|
|
|
|
|
|
|
|
|
|
|
|
|
|
|
|
|
|
|
|
|
|
|
|
|
|
|
|
|
|
|
|
|
|
|
|
|
|
|
|
|
|
|
|
|
|
|
|
|
|
|
|
|
|
|
|
|
|
|
|
|
|
|
|
Mauritius |
|
|
|
|
|
0,6 |
|
|
|
|
|
|
|
|
|
|
|
|
|
|
|
|
|
|
|
|
|
|
|
|
|
|
|
|
||
|
|
|
|
|
|
|
|
|
|
|
|
|
|
|
|
|
|
|
|
|
|
|
|
|
|
|
|
|
|
|
|
|
||||
|
|
|
|
|
|
|
|
|
|
|
|
|
|
|
|
|
|
|
|
|
|
|
|
|
|
|
|
|
|
|
|
|
|
|
|
|
|
|
|
|
|
|
|
|
|
|
|
|
|
|
|
|
|
|
|
|
|
|
|
|
|
|
|
|
|
|
|
|
|
|
|
|
|
Singapore |
|
|
|
|
|
0,6 |
|
|
|
|
|
|
|
|
|
|
|
|
|
|
|
|
|
|
|
|
|
|
|
|
|
|
|
|
||
|
|
|
|
|
|
|
|
|
|
|
|
|
|
|
|
|
|
|
|
|
|
|
|
|
|
|
|
|
|
|
|
|
||||
|
|
|
|
|
|
|
|
|
|
|
|
|
|
|
|
|
|
|
|
|
|
|
|
|
|
|
|
|
|
|
|
|
|
|
|
|
|
|
|
|
|
|
|
|
|
|
|
|
|
|
|
|
|
|
|
|
|
|
|
|
|
|
|
|
|
|
|
|
|
|
|
|
|
Kyrgyzstan |
|
|
|
|
|
0,6 |
|
|
|
|
|
|
|
|
|
|
|
|
|
|
|
|
|
|
|
|
|
|
|
|
|
|
|
|
||
|
|
|
|
|
|
|
|
|
|
|
|
|
|
|
|
|
|
|
|
|
|
|
|
|
|
|
|
|
|
|
|
|
||||
|
|
|
|
|
|
|
|
|
|
|
|
|
|
|
|
|
|
|
|
|
|
|
|
|
|
|
|
|
|
|
|
|
|
|
|
|
|
|
|
|
|
|
|
|
|
|
|
|
|
|
|
|
|
|
|
|
|
|
|
|
|
|
|
|
|
|
|
|
|
|
|
|
|
Bulgaria |
|
0,3 |
|
|
|
|
|
|
|
|
|
|
|
|
|
|
|
|
|
|
|
|
|
|
|
|
|
|
|
|
|
|
||||
|
|
|
|
|
|
|
|
|
|
|
|
|
|
|
|
|
|
|
|
|
|
|
|
|
|
|
|
|
|
|
||||||
|
|
|
|
|
|
|
|
|
|
|
|
|
|
|
|
|
|
|
|
|
|
|
|
|
|
|
|
|
|
|
|
|
|
|
|
|
|
|
|
|
|
|
|
|
|
|
|
|
|
|
|
|
|
|
|
|
|
|
|
|
|
|
|
|
|
|
|
|
|
|
|
|
|
0,0 |
0,5 |
1,0 |
1,5 |
2,0 |
2,5 |
3,0 |
3,5 |
4,0 |
||||||||||||||||||||||||||||
Fig. 7: Average number of structure and vehicle fires per 1000 inh. (2018)
Рис. 7: Среднее число пожаров в зданиях и на транспорте на 1000 чел.( 2018)
Bild 7: Mittlere Anzahl der Gebäude- / Transportbrände je 1.000 Einw. (2018)