

Адаптивная дифференциальная импульсно-кодовая модуляция / 5.8 ADPCM
.pdf1
MATLAB Exercise – ADPCM Coder
Program Directory: matlab_gui\adpcm
Program Name: adpcm_GUI25.m
GUI data file: adpcm.mat
Callbacks file: Callbacks_adpcm_GUI25.m
TADSP: Section 11.5.2, pp. 713-718, Section 11.7, pp. 732-734, Problem 11.30
This MATLAB exercise implements an Adaptive Differential Pulse Code Modulation (ADPCM) coder for waveform coding of speech signals.
ADPCM Coder – Theory of Operation
A block diagram of the ADPCM encoder is given in Figure 1. A block diagram of the step size adaptation logic is given in Figure 2. A block diagram of the ADPCM decoder is given in Figure 3. Finally the quantizer input-output characteristic is shown for a B = 4 bit quantizer in Figure 4. The adaptive component of the ADPCM coder is the step size which adapts according to the encoded quantizer output (i.e., the codeword at each sample).
Figure 1: Block diagram of ADPCM encoder.
Figure 2: Block diagram of step size adaptation logic for adaptive quantizer.
The ADPCM waveform coder encodes a speech file using an ADPCM encoder with the following characteristics:
1.quantization and coding of the difference between the current speech sample (x[n]) and prediction of the current speech sample (x^[n]),
2.fixed, first-order predictor with prediction coefficient , specified as one of the input parameters sent to the encoder and to the decoder,
2
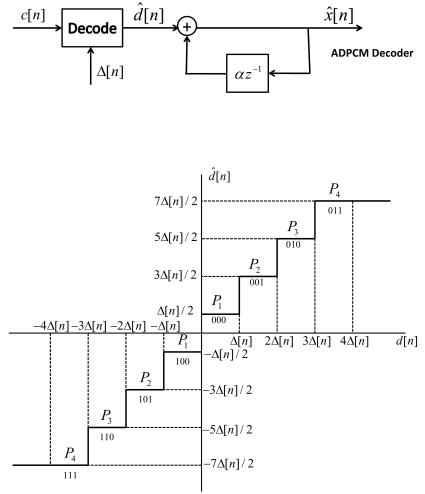
Figure 3: Block diagram of ADPCM decoder.
Figure 4: Block diagram of input-output characteristic of uniform quantizer using B = 4 bits quantization.
3.uniform quantization (Q) of the difference signal (d[n]) with an adaptive step size ( [n]),
4.step size adaptation logic whereby the current step size ( [n]) is based on both the previous step size ( [n 1]) and the previous codeword (c[n 1]),
5.the step size is adapted according to the following rule:
[n] = P [n 1] |
(1) |
with the range constraint:
min [n] max |
(2) |
and the step size multiplier (for the 3-bit uniform quantizer of Figure 4) is given by:

|
|
3 |
P = |
P1 |
if previous codeword is 000 or 100 |
> |
(3) |
|
|
> |
if previous codeword is 001 or 101 |
|
8P2 |
|
|
< |
|
|
>P3 |
if previous codeword is 010 or 110 |
|
> |
|
|
> |
|
|
: |
if previous codeword is 011 or 111 |
|
>P4 |
where the step size multipliers (P1 to P4) are specified in Table 11.6 of TADSP, page 717, for B = 2 to B = 5 bit uniform quantizers (under the DPCM column of this table).
6.a set of initial conditions for the ADPCM encoder are specified as the following:
•c[0] = 000 (for B = 3 bit quantizer)
•[0] = min
•x[0] = 0
•x~[0] = 1
•d[0] = 1
•d[0] = 1
•x^[0] = 0
7.the set of coder equations is solved sequentially for a range of values of n, with the step size adapted at each sample according to the adaptation equation above.
8.the set of ADPCM codewords is stored for use by an ADPCM decoder program which uses the same step size adaptation logic as the encoder, as shown in Figure 3.
ADPCM Coder – GUI Design
The GUI for this exercise consists of two panels, 3 graphics panels, 1 title box and 14 buttons. The functionality of the two panels is:
1.one panel for the graphics display,
2.one panel for parameters related to the ADPCM waveform coding analysis, and for running the program.
The set of three graphics panels is used to display the following:
1.overlay of the original speech signal, the quantized speech signal, and the ADPCM error signal – both the entire sequences and manually-selected regions of the sequence,
2.the signal power spectrum estimate overlayed with the error signal power spectrum estimate,
3.a histogram of the error signal showing usage of each of the quantization levels in the ADPCM quantizer.
The title box displays the information about the selected file along with the set of ADPCM waveform analysis parameters. The functionality of the 14 buttons is:
1.a pushbutton to select the directory with the speech file that is to be analyzed using short-time analysis methods; the default directory is ’speech files’,
2.a popupmenu button that allows the user to select the speech file for analysis,
3.an editable button that specifies the number of bits per sample, nbits, in the ADPCM quantizer; (the default is 4 bits per sample, with the allowable range of 2-5 bits per sample; special rapidly adapting quantizers are used for the cases of nbits= 4 and nbits= 5),

4
4.an editable button that specifies the first order prediction coefficient, ; (the default value of is 0.8 and the range of is 1 +1),
5.an editable button that specifies the x-axis plotting unit, iplot, where iplot = 1 for plotting units of samples, and iplot = 2 for plotting units of seconds; this option is used strictly for the plots of input signal, quantized signal and quantization error,
6.an editable button that specifies the smallest allowable value of step size, deltamin; (the default value for deltamin is 16),
7.an editable button that specifies the largest allowable value of step size, deltamax; (the default value for deltamax is 1600),
8.an editable button that shows the value of Signal-to-Noise ratio of the ADPCM coder, SNR; (the default is to let the program estimate SNR and display it in the editable button display region),
9.a pushbutton to run the code and display the results of ADPCM waveform coding on the three graphics panel displays,
10.a pushbutton to play out the original speech signal,
11.a pushbutton to play out the quantized speech signal,
12.a pushbutton to play out the ADPCM error signal,
13.a pushbutton to expand the time scale of the waveform plots (input signal, quantized signal, and error signal), based on plotting the entire waveforms and then using a pair of graphic cursors to specify beginning and ending samples of waveforms for subsequent display; this pushbutton can be iteratively hit to examine different waveform regions and show how the waveforms of signal, quantized signal, and error signal vary as the region of interest is changed by the user,
14.a pushbutton to close the GUI.
ADPCM Coder – Scripted Run
A scripted run of the program ’adpcm GUI25.m’ is as follows:
1.run the program adpcm GUI25.m’ from the directory ’matlab gui\adpcm’,
2.hit the pushbutton ’Directory’; this will initiate a system call to locate and display the filesystem for the directory ’speech files’,
3.using the popupmenu button, select the speech file for short-time feature analysis; choose the file ’s5 edited.wav’ for this example; the program displays the speech signal waveform in the top graphics panel (on a scale based on speech samples) along with a pair of graphic cursors which allow the user to select a beginning and ending region for adpcm analysis and synthesis; the user can move the beginning cursor to the left of sample 1 and to the right of the last sample to guarantee that the entire waveform is used for adpcm encoding and decoding;
4.using the editable buttons, set the initial values for the signal processing parameters to the values nbits=4,
= 0:8, iplot=1, deltamin=16 and deltamax=1600,
5.hit the ’Run ADPCM Coder’ button to process the speech waveform by the ADPCM coder and to display the waveform coding results in the three graphics panels,
6.take note of the signal-to-noise ratio of the coding, as displayed in the editable button for SNR,
5
7.hit the ’Expand Time Scale’ button to illustrate the effects of adpcm encoding and decoding using the current parameter values but for expanded waveform regions; the user selects the expanded region using the graphics cursors that appear after the full time scale waveforms are plotted in the top graphics panel; this process of running the ADPCM code and then expanding the time scale can be iterated as often as desired;
8.experiment with different choices of speech file, and with different values for nbits, , iplot, deltamin and deltamax,
9.hit the ’Close GUI’ button to terminate the run.
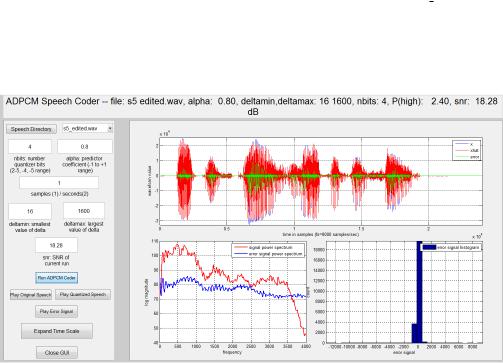
An example of the graphical output obtained from this exercise using the speech file ’s5 edited.wav’ is shown in Figure 5. The upper graphics panel shows the uncoded speech waveform overlayed by both the quantized speech waveform and the quantization error signal. The lower left graphics panel shows the signal power spectrum overlayed by the error signal power spectrum. The lower right graphics panel shows the error signal spectrogram. The signal-to- noise ratio of the ADPCM coder using 4-bits per sample is 18.3 dB for this speech file.
Figure 5: Graphical output from ADPCM waveform coding applied to a designated speech file. The upper graphics panel shows the original speech signal, overlayed with the quantized signal and the quantization error signal. The lower left graphics panel shows the power spectrums of both the original speech signal and the quantization error signal.
ADPCM – Issues for Experimentation
1.Select a speech utterance and listen to the original signal. Run the ADPCM exercise and listen to the quantized signal using the default values for the ADPCM parameters. Describe the difference in quality between the two waveforms.
2.Listen to the ADPCM error signal. How much intelligibility of the original speech utterance is preserved in the error signal? How can you explain this?
3.Vary the number of quantizer bits from 5 down to 2. What happens to the quantized signal as the number of quantizer bits falls? How does the SNR change as the number of quantizer bits goes from 5 to 4 to 3 to 2.
6
4.Set the number of bits in the quantizer to either 5 or 4. The minus sign is used to designate a second quantizer with 4 or 5 bits/sample. This special quantizer uses a more rapid attack and decay strategy. How well does this special quantizer work for the chosen speech file? Compare the quality (and SNR) of the pair of quantizers (nbits set to both 4 and 4, or nbits set to both 5 and 5); is there any way of deciding when the more rapid attack/decay characteristics are beneficial?
5.Choose another speech file whose characteristics are very different from those of the previous exercises (e.g., female instead of male). Repeat the proscribed exercises above and describe the differences in performance for the pair of speech utterances.