

3.5 Physical dot gain
One of the reasons limiting the minimal size of an element which would steadily present over print sheet within a run is schematically illustrated in figure 3.9. Possibility of the ink drop splitting and its separated part transfer onto a print is rather small when the drop dimension is comparable with the period of a paper roughness relief (case 1 in figure 3.9). The drop may “hang” over a substrate cave or being just pierced by its filament and stays on a plate or offset blanket due to the lack of adhesion.
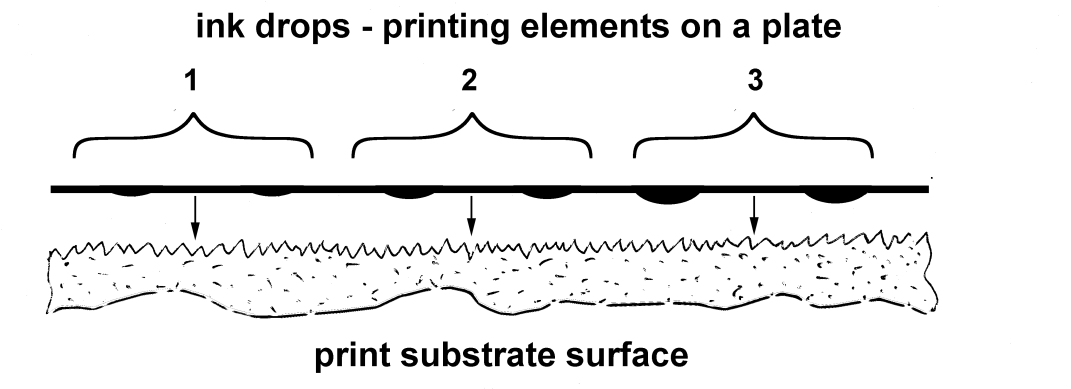
Figure 3.9. Transfer of an ink drop 1, which size is comparable to average roughness period of a substrate, is unreliable; halftone dots 2 of particular area, inherent in given ink-plate-substrate system, are confidently transferred at certain pressure; at such condition the greater dots 3 are squeezed.
The necessary adhesion can be provided at the proper pressure and greater ink amount when drop size essentially exceeds the relief period (case 2). But it becomes evident that the larger dots will be herewith squeezed (case 3). That’s why the ink supply and pressure required at nip for transfer of minimal possible dot are the inevitable, natural reason of physical dot gain – ink coverage excess for the greater tone values. It can be to some extent reduced with perforated larger printing elements met, for example, in the screens with so called “concentric” dots accepting the less ink amount due to the locally lower adhesion and thereby also providing some lower total ink waste. Additional, however avoidable, TVI can be caused by the halftone dots slur and doubling.
Minimal dot and blank are nearly equal and are of about 20 – 25 microns in lithography on coated papers and 80 - 100 in relief news printing. Providing them over the whole print sheet within a run is the fundamental criteria of such basic press settings as ink supply and pressure.2
Somewhat different, mostly geometric reasons cause the dot gain in the so called “digital” printing. It can be estimated there by the ink coverage increase on a print in relation to that predetermined in the orthogonal bit map generated by RIP or printer driver which supposes the idealistic, square form of an element. However, the latent charge image is recorded onto optical photoconductor (OPC) of a “laser” printer by the circle or oval aperture going out of margins of a bit map cell. Drops in ink jet printing are as well rounded due to the known physical reasons. Each method of digital printing is also characterized by the minimal steadily produced dot and blank, which specify, in turn, the b/w levels assignment and available effective, controllable tone range. These parameters are mainly defined by the toner dispersity and operating drop sizes.
Optical and physical dot gain comprise altogether the basic reason the so called proportionality failure in the halftone dot area transfer onto substrate. It can be also concluded from above that, with exception of avoidable slur and doubling, the physical dot gain for a minimal print element is null and all the measured or modeled TVI curves should stem from this value. Otherwise, these measurements or models are somewhat lacking.
Absolute size of the minimal available print element cardinally determines, in its turn, the proper choice of a screen ruling.
3.6 Strategy of screen ruling selection
Halftone frequency is the most important parameter of print reproduction. Image of 100 Lpi incorporates twice greater amount of data than at 70 Lpi. Advertising print area cost is usually estimated per square inch in periodicals. Photo in letterpress newsprint of 60 Lpi should be of about 2x3 inch to identify the person. It became possible to half reduce it with coming to litho printing at screen ruling of 85 Lpi.
This parameter was earlier used to be set from the limited nomenclature of projection screens but nowadays it’s possible freely manipulate its meaning.
Contrary to sampling frequencies of the other imaging media, the screen rulings standardization is, however, rather hindered due to the vast variety substrate – ink – plate - press combinations. There are no sufficiently reasonable instructions or methods of this parameter choice as applied to this or other kind of a print job. So, the ruling value for given printing conditions is usually set following the industry practice but the particular meaning isn’t somehow substantiated in spite of its cardinal effect on an image data volume and quality. Commented lower values of ISO 12647 (1996 и 2004) don’t completely follow logic and to certain extent conflict with those practical, industry used ones.
The superficial conclusions of ruling upper level of 150 Lpi (60 lines/cm) being quite sufficient for all kinds of jobs as related to HVS frequency response limit of about 6 lines/mm at reading distance are also met [3.16; 3.17]. Such a halftone can however reproduce just the 3 lines per mm of pictorial data. So, the practically unreal, twice higher ruling of 300 Lpi is required to completely satisfy that kind of “theoretical” supposition.
Image sharpness and definition increase with the growth of ruling and the screen becomes also less acute. However, the effective range and, as result, the image contrast, number of reproduced gradations diminish if the halftone frequency was upraised without the adequate lowering of plate making and printing processes noise level, i.e. at the same sizes of minimal available dots and blanks.
Example of the effective range reduction from 92% to 68% as result of the halftone frequency double overstatement is demonstrated in figure 3.10. There is also shown that in the opposite case of twice understatement it increases to 98%, i.e. very close to formal range of 100%. However, that results in the great decrease of image sharpness and definition while the screen becomes more visibly acute.
|
Figure 3.10 Tone value effective ranges (a) and fields of minimal available dots (b) at screen rulings 0.5L, L and 2L |

It
was shown that for given printing conditions the contrast of some
ideal halftone (Ds
=
 ;
Dp
= 0) is inversely proportional to square of screen frequency L
;
Dp
= 0) is inversely proportional to square of screen frequency L
К
 1/(Smin·L2),
3.9
1/(Smin·L2),
3.9
where Smin – absolute area of a minimal dot or blank space [1.9].
Overall image quality is, in general, estimated by the sum of its multiple parameters weighted according to their relative importance for a viewer in JND (Just Noticeable Differences) metric. As far as the ruling value L, responsible for image sharpness and definition, is in wide practice reduced at coming to coarser print substrates and less stable processes it’s possible to propose that some of these parameters are to certain extent ignored to provide the some other one. Such much more important, principle parameter is the image contrast defined by the reflection ratio of “white” and “black” point settings within the generally accepted tone range bounds of 3-5% and 95-97% [2.8; 2.9]. In terms of expert estimations it means that the average statistical viewer is ready to sacrifice the several JNDies of the other quality indices on behalf the single JND of contrast.
This fact may comprise the starting point of reasonable choice of halftone frequency. With taking into account the lower bound measurement tolerances it’s quite possible to assume the tiny dot value, characterizing above mentioned process facilities, as Smin = 4%. At presumably square form of such a dot its size dmin comprises the fifth part of a screen period 1/L which gives the rule of thumb for screen frequency computation:
L = 1/5dmin. 3.10
For example in news printing
by letterpress: dmin
= 80
 = 0.008 cm, L = 60 lpi (24 lines/cm); by offset: dmin
= 50
= 0.005 cm, L = 100 lpi (40 lines/cm).
= 0.008 cm, L = 60 lpi (24 lines/cm); by offset: dmin
= 50
= 0.005 cm, L = 100 lpi (40 lines/cm).