

Implementing the Triggers
The output signal of the Mux block connects to the input trigger port of the Stateflow block. Your chart should look like this:
2 Save Stage5Trigger.
Where to go next. Now you are ready to begin phase 6 of the workflow: Chapter 8, “Simulating the Chart”.
7-5

7 Triggering a Stateflow® Chart
7-6
8
Simulating the Chart
2
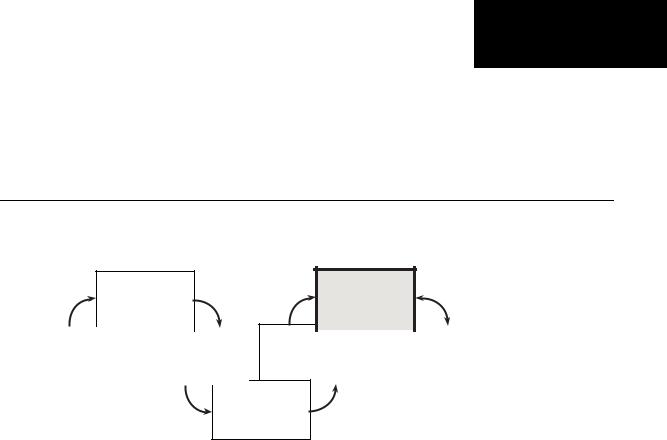
Define the states
for modeling each mode of operation
|
|
|
|
|
1 |
|
3 |
||
Define the |
|
Define |
||
interface |
|
state actions |
||
to Simulink |
|
and variables |
||
|
|
|
|
|
6 Simulate the chart
5 |
|
|
|
|
|
|
|
7 |
|||
Decide how to |
|
Debug |
|||
trigger the chart |
|
the chart |
|||
|
|
|
|
|
|
|
|
|
|
|
|
4 Define the transitions
between states
You have entered phase 6 of a basic workflow for building a Stateflow chart: simulating the chart. By the time you reach this phase, you have finished building your chart and integrating it with the Simulink model. Now it is time to test the chart by simulating its run-time behavior. During simulation, you can animate Stateflow charts to highlight states and transitions as they execute. This chapter guides you through the tasks required for simulating the chart with animation.
•“Preparing Charts for Simulation” on page 8-2
•“Setting Simulation Parameters” on page 8-3
•“Animating Stateflow Charts” on page 8-5
•“Setting Breakpoints” on page 8-8
•“Simulating the Air Controller Chart” on page 8-10

8 Simulating the Chart
Preparing Charts for Simulation
Before starting a simulation session, you should examine your chart to ensure that it conforms to recommended design practices:
•There must be a default transition at every level of the Stateflow hierarchy that contains exclusive (OR) states (has exclusive [OR] decomposition). (See “Placing Default Transitions” on page 6-3.)
•Whenever possible, input data objects should inherit properties from the associated Simulink input signal to ensure consistency, minimize data entry, and simplify maintenance of your model. Recall that in “Defining the Inputs and Outputs” on page 3-9, you defined the input temp to inherit its size and type from the Simulink output port temp, which provides the input value to the Air Controller chart.
•Output data objects should not inherit types and sizes because the values are back propagated from Simulink blocks and may, therefore, be unpredictable. Recall that in “Defining the Inputs and Outputs” on page
3-9, you specified the data type as uint8 and the size as scalar (the default). (See “Avoid Inheriting Output Data Properties from Simulink Blocks” in the Stateflow User’s Guide.)
Tip You can specify data types and sizes as expressions in which you call functions that return property values of other variables already defined in Stateflow, MATLAB, or Simulink software. Such functions include type and fixdt. For more information, see “Entering Expressions and Parameters for Data Properties” in the Stateflow User’s Guide.
8-2
Setting Simulation Parameters
Setting Simulation Parameters
To set simulation parameters, follow these steps:
1Open the model Stage5Trigger and save it as Stage6Simulate in the same folder.
2Double-click Air Controller to open the Stateflow chart.
3Check the settings for simulation time:
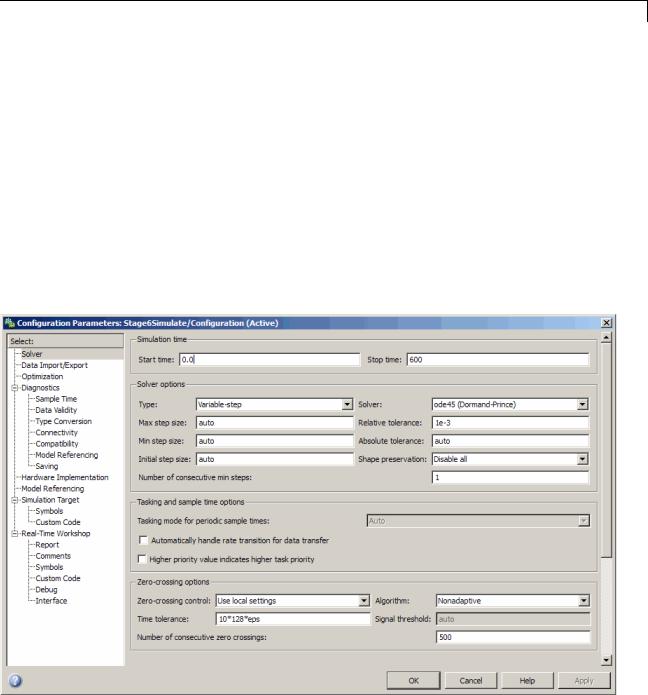
a In the Stateflow Editor, select Simulation > Configuration Parameters.
The Configuration Parameters dialog box opens on your desktop:
8-3

8 Simulating the Chart
bClick Solver in the left Select pane if it is not already selected.
Under Simulation time on the right, note that the start and stop times have been preset for you. You can adjust these times later as you become more familiar with the run-time behavior of the chart.
cKeep the preset values for now and click OK to close the dialog box.
4 Leave the chart open for the next exercise.
8-4
Animating Stateflow® Charts
Animating Stateflow Charts
When you simulate a Simulink model, you can animate Stateflow charts to highlight states and transitions as they execute. Animation provides visual verification that your chart behaves as expected. Animation is enabled by default, but you set the speed. To configure animation for your simulation session, follow these steps:
1Verify that animation has been enabled for your chart:
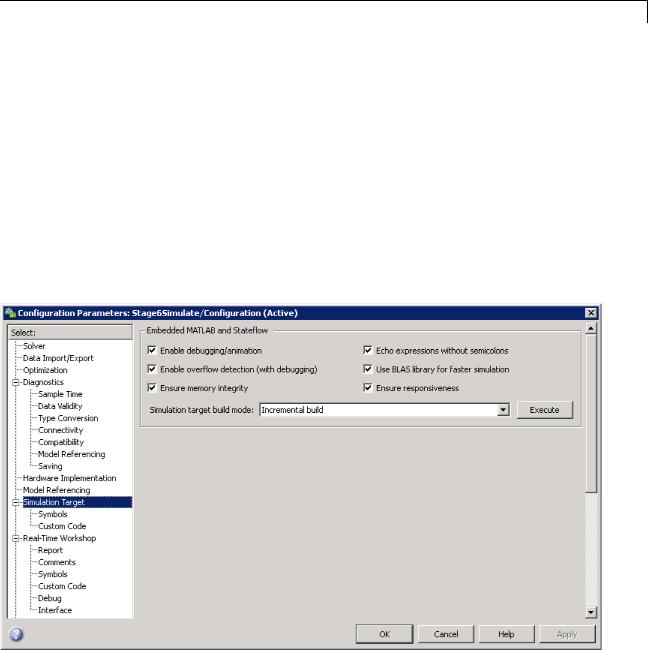
a In the Stateflow Editor, select Tools > Open Simulation Target.
The Simulation Target pane of the Configuration Parameters dialog box opens on your desktop.
8-5

8 Simulating the Chart
Note This dialog box is used to configure Stateflow software for building targets. A target is a program that executes a Stateflow chart or a Simulink model that contains a Stateflow chart. Stateflow software builds a simulation target that you use to simulate your Stateflow application. For more information, see “Building Targets” in the Stateflow User’s Guide.
bVerify that Enable debugging/animation is selected.
cClose the dialog box.
2Set the speed of animation:
a From the Stateflow Editor, open the Stateflow debugger by selecting Tools > Debug or clicking the Debug icon:
8-6
Animating Stateflow® Charts
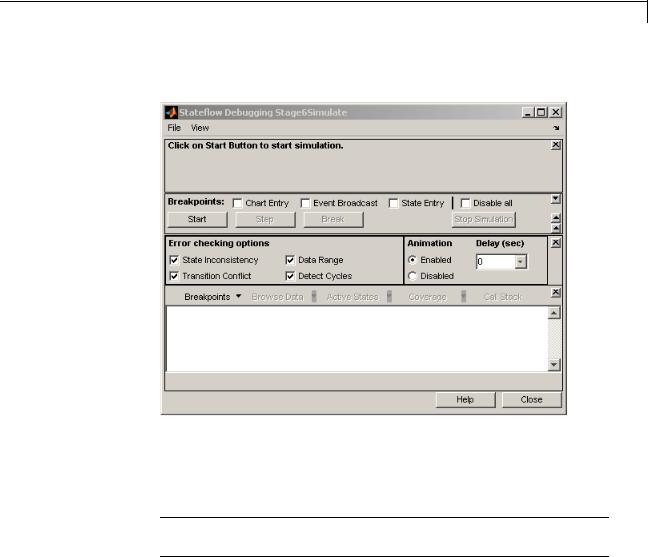
The Stateflow debugger opens on your desktop:
By default, animation is enabled at 0-second delay.
bChange the delay to 1 second so the animation will proceed at the slowest speed.
Note You can change the speed of animation at any time during simulation.
3 Leave the Air Controller chart and the debugger open for the next exercise.
8-7

8 Simulating the Chart
Setting Breakpoints
In this exercise, you will learn how to set breakpoints in the debugger to pause simulation during key run-time activities so you can observe the behavior of your chart in slow motion. You can set the following breakpoints:
|
Breakpoint |
Description |
|
|
Chart Entry |
Simulation halts when the Stateflow chart wakes |
|
|
|
up. |
|
|
Event Broadcast |
Simulation halts when an event, such as SWITCH or |
|
|
|
CLOCK, occurs. |
|
|
State Entry |
Simulation halts when a state becomes active. |
|
|
|
|
|
You will also learn how to examine data values when simulation pauses.
Follow these steps:
1In the debugger, select Chart Entry and State Entry as breakpoints.
Note If you also set breakpoints at each event broadcast, simulation would pause at every rising or falling edge of the SWITCH and CLOCK signals.
To keep simulation running at a reasonable pace, do not select Event Broadcast.
8-8