

2 - The Visualization Editor in CoDeSys
Example:
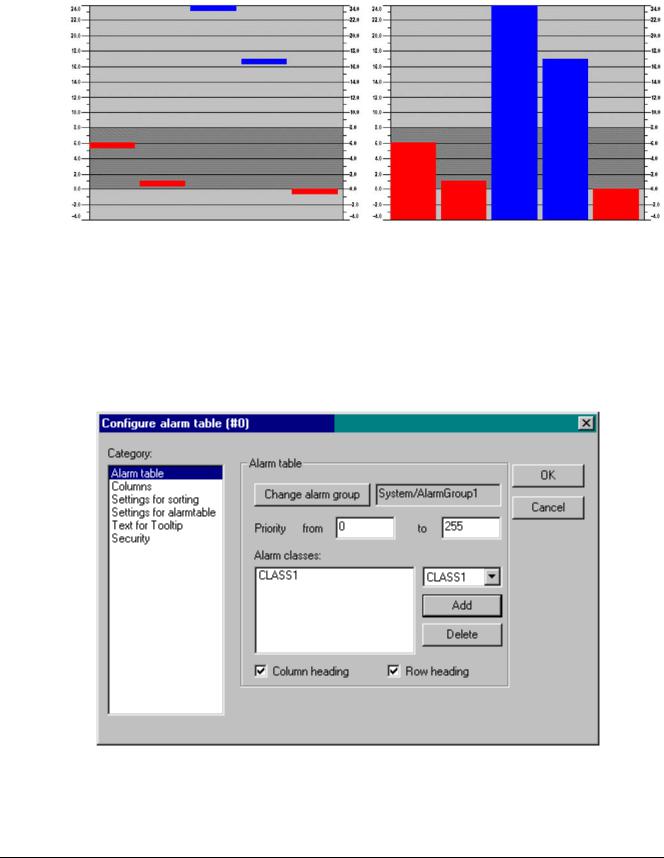
See in the following picture an example of the online display (bars resp. lines) of a histogram which represents an array arr1 [0..4] of INT. The number of bars appropriately was set to "5", the scale start to "–4", the scale end to "24", the main gradation was set to "2", the sub-gradation to "1" and the scale range 0 – 8 has got assigned another color (dark grey) than the rest of the scale range. Further on the bars should be displayed alarm-colored (blue) as soon as the value of the corresponding array element exceeds "8". You see the array elements arr1[2] and arr1[3] currently being in alarm state:
Alarm table
The element 'Alarm table' is used to visualize alarms, which must be defined before in the CoDeSys Alarm configuration.
As soon as the element gets inserted in the visualization object, the dialog 'Configure alarm table'. Besides the known categories for configuration of tooltip and security the following settings concerning display and selection in the table can be made:
Category Alarm table:
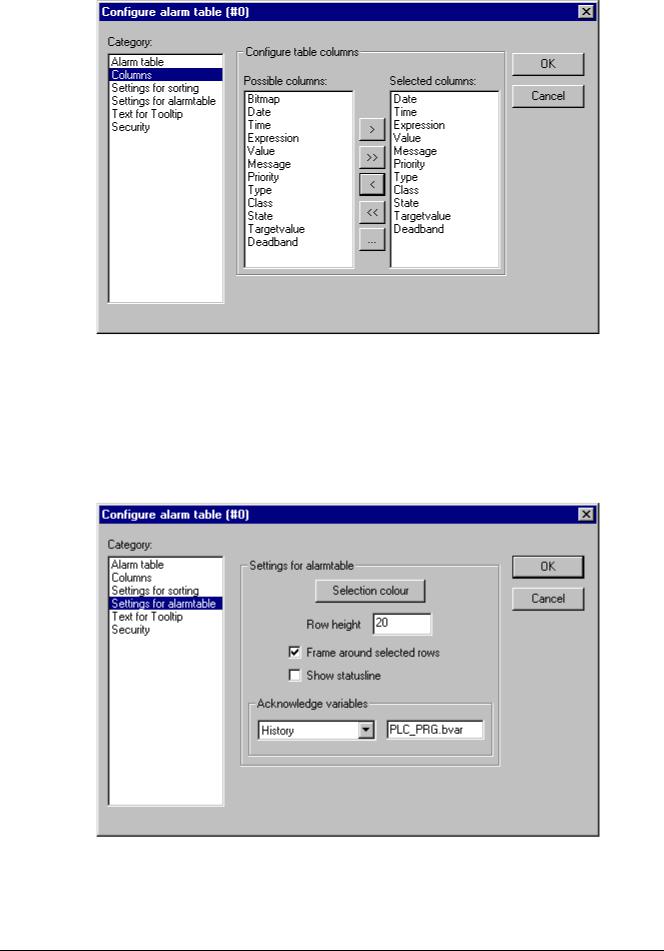
Dialog for configuration of a alarm table, category Alarm table
Define what you want to get displayed in the alarm table:
2-34 |
The CoDeSys Visualization |
2 - The Visualization Editor in CoDeSys
Change alarm group: Press this button to get the selection tree of the alarm configuration, which offers all alarm groups currently defined. Choose the desired group (which even may contain just one alarm).
Priority: Define the priority for which you want to get displayed all alarms. Permissible range: 0 to 255.
Alarm classes: Mark a class which you want to get displayed and press button Add to add the class to the list in the window 'Alarm classes'. Do this for all required classes. In order to remove a marked entry from the alarm classes window press button Delete.
Activate options Column heading resp. Row heading, if the headings should be displayed in the alarm table.
Category Settings for sorting:
Dialog for configuration of an alarm table, category 'Settings for sorting'
Define here according to which criteria the alarm table should be sorted:
Sort column: Sorting according to Priority, Alarm class, Date/Time or Alarm state
Sort order: Ascending or Descending; Example: Ascending according to priority means that the table will start with alarms of priority 0 (if available), followed by higher numbered priorities.
Category Columns:
Define here, which of the columns (alarm parameters) should be displayed in the alarm table: The parameters are defined -- except for date and time (alarm is coming) and alarm state (see CoDeSys User Manual, Alarm Configuration) in the Configuration of the alarm groups: Bitmap,
Date, Time, Expression, Value, Message, Priority, Type, Class, State, Target value (for alarm types DEV+ and DEV-), Deadband.
The CoDeSys Visualization |
2-35 |
2 - The Visualization Editor in CoDeSys
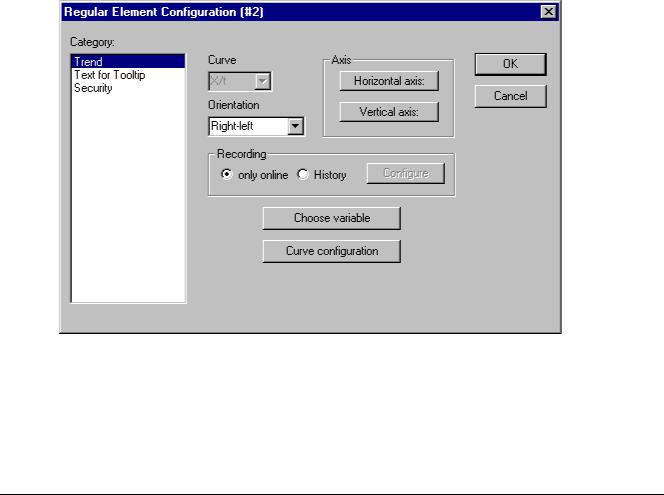
Dialog for configuration of an alarm table, category 'Columns'
Using the buttons ">", ">>", you can take single resp. all parameters from the left to the right window. The selection defined in the right window will be displayed in the alarm table. Using the buttons "<" resp. "<<" entries can be removed from the selection.
For each column you can open the dialog 'Configure columns' by a the right window. In this dialog Column header and Column width
Category Selection settings for alarm table:
double-click on the entry in can be defined.
Dialog for configuration of an alarm table, category 'Settings for alarmtable'
Define here some settings for the display for the chosen table fields:
Selection color: This button opens the standard dialog for choosing a color. Define the color in which selected fields should be displayed.
2-36 |
The CoDeSys Visualization |
2 - The Visualization Editor in CoDeSys
Row height: Height of the table rows in Pixel.
Slider size: Height of the slider (Pixel) at the bottom of the table.
Frame around selected rows: If this option is activated, selected table rows will get a frame.
Show statusline: If this option is activated, below the alarm table a status bar will be displayed providing the following buttons for the operation in online mode:
Acknowledge: All alarm entries marked in the alarm table get acknowledged. Acknowledge all: All alarm entries listed in the alarm table get acknowledged.
History: If this button is pressed, instead of the current status of the alarms the table will show a complete list of all events which have occurred up to now (all transitions between any alarm stati). In this list no acknowledgement is possible! Any new events will be added currently.
If you have defined a record file, also there you will find this history for all alarm classes, for which the action 'Save' has been activated.
Start: cancels Stop (see below)
Stop: The current update of the list with newly occurring events will be stopped until it is restarted by pressing button 'Start'.
Acknowledge variables: This option is only available as long as you have not chosen option 'Show statusline' (see above). If it is activated, the functions described above for the status string buttons can get controlled by variables. In order to define these variables, choose a function from the selection list and enter a project variable in the assigned edit field. Thus for example the acknowledgement of all alarms in online mode can be done by a rising edge of the assigned variable.
Trend
Dialog for configuration of a Trend element
The Trend element can be used to log the time dependent behaviour of variable values in the online mode. It can be compared with the trace functionality. The online presentation is done in a diagram, in case of logging to a text file each of the values is written to a separate line.
In the dialog for configuring visualization elements in category 'Trend' you can do the following settings :
Curve: X/t, horizontal axis = time axis, vertical axis = scale of values
The CoDeSys Visualization |
2-37 |
2 - The Visualization Editor in CoDeSys
Orientation: Left-right or Right.-left: The latest value will be displayed on the left/right side;
Axis:
Horizontal Axis:
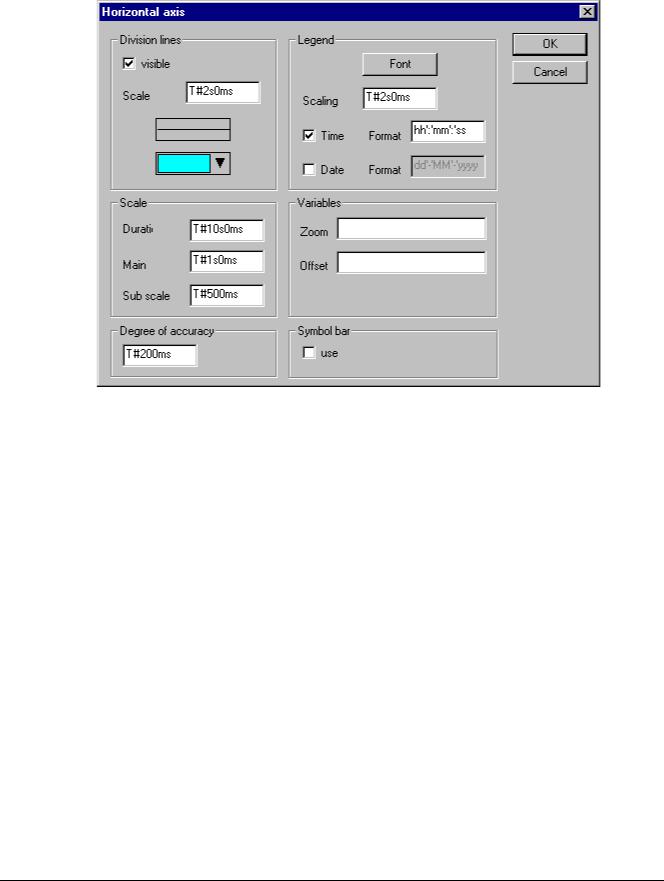
Dialog for configuration of the horizontal axis in the trend element
Division lines: Activate option 'visible', if vertical division lines should be displayed which are elongating the scale marks. In this case define the 'Scale': The given number defines the interval between the division lines on the horizontal axis. Type (normal ___, dashed _ _ _, dotted ....., dashdotted _ . _ .) and color of the lines can be defined in dialogs which will open when you perform a mouse-click on the corresponding rectangle showing the currently set line type resp. color.
Scale: The shown range of the scale is determined by the entry for Duration. If here e.g. " T#20s0ms" is defined, the scale will display a period of 20 seconds. The Main division and the Sub scale division, which will be displayed by the means of long and short marks are to be defined according to the same syntax.
Degree of accuracy: Define here (in the standard format for dates, e.g. T#5ms) the interval for displaying the current values of the variables.
Legend: Here you define the display of the legend. Via button Font the standard dialog for setting the font will be opened. At Scaling define the distances between the particular letterings on the scale (e.g. T#4ms, if the scale markings should get a lettering each 4 milliseconds. The lettering will contain the time and/or date, depending on which options are activated. The desired format each can be defined in the field 'format'.
Variables: Here you can define project variables, which contain the zoom values resp. offset values for the horizontal scale. For example the offset of the display range of the horizontal axis will be set to "10" as soon as the variable assigned here gets value 10.
Symbol bar: If option use is activated, at the bottom of the element a horizontal symbol bar will be added, providing buttons for scrolling and zooming in online mode. The simple arrow buttons will move the displayed range along the time axis step by step, the double arrow buttons will shift it to the end resp. start of the record. The zoom buttons allow a zooming of the horizontal scale step by step. To get a possibility to restore the original settings concerning zoom and offset, define the vertical symbol bar to get the 'home' symbol.
2-38 |
The CoDeSys Visualization |
2 - The Visualization Editor in CoDeSys
Vertical axis:
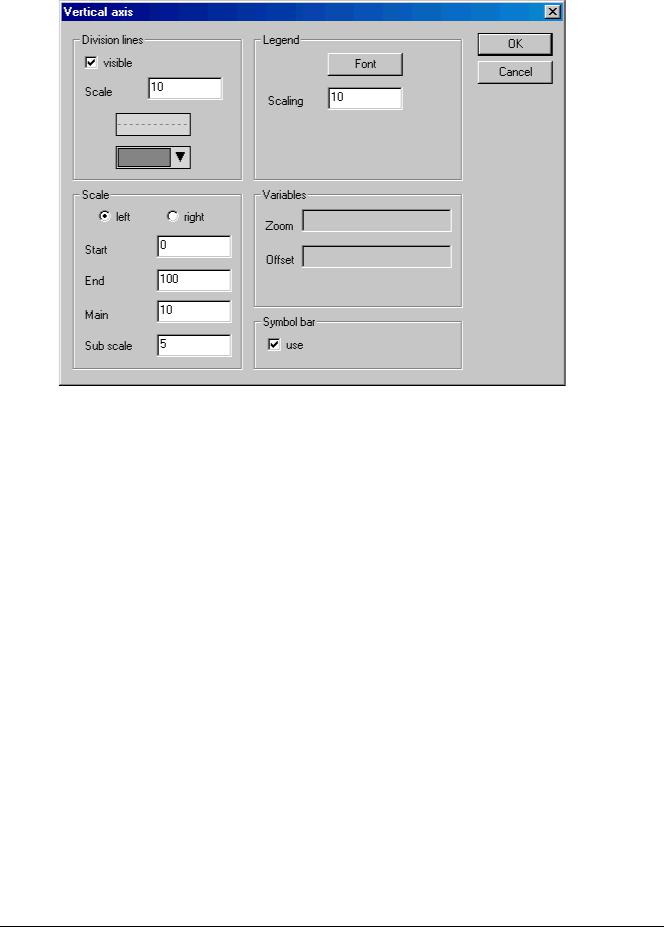
Dialog for configuration of the vertical axis in the trend element
Division lines: corresponding to the horizontal axis (see above)
Scale: Define whether the scale should be displayed at the left or right border of the trend diagram. Choose the Start value (lower end) and End value (upper end) of the scale as well as the Main and Sub scale divisions (longer and shorter markings will be displayed in the here defined distances).
Legend: Font and divisions; see above, horizontal axis Variables: see above, horizontal axis
Symbol bar: see above, horizontal axis, additionally there is a  "home" button for restoring the standard settings concerning zooming and offset of the axes.
Recording: Define here whether the trend should be recorded 'only online', i.e. the time dependent behaviour of the variable values will be displayed using the chosen range of the scale, or whether the record should be saved to history file, which can be configured after pressing the button 'History'. The dialog corresponds to that which is used for the configuration of the alarm log file. Regard: If the target-specific option 'Store trend data in the PLC' is activated (see Target Settings, category Visualization), the path defined here will be ignored and the log file will be stored in the download directory of the PLC.
In the log file for each time of measurement a separate line is written which contains the name and the values of all regarded variables. Each line starts with a unique identifier in DWORD format, which is built from the date of measuring.
Choose variable: Press this button to get the dialog Variables, where you can configure the variables for which the trend record should be done and how they should be displayed.
Enter a project variable in column Variable (mouse-click on the field will open an edit frame). It is recommended to use the input assistant <F2> or Intellisense function.
Color and Line type for the display of the variable in the record you can define by a mouseclick on the corresponding field in column Color (standard dialog for choosing a color) resp. by selecting a line type in the corresponding field of column Line type (normal ___, dashed _ _ _, dotted ....., dashdotted _ . _ .).
The CoDeSys Visualization |
2-39 |
2 - The Visualization Editor in CoDeSys
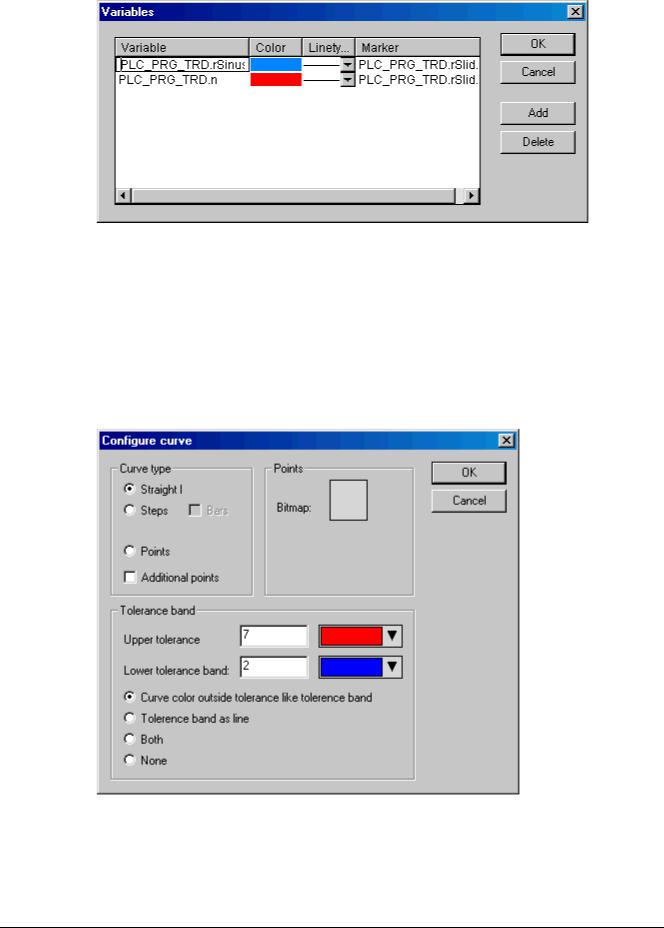
Dialog for configuration of the variables in the trend element
In column Marker you can define a variable, which will provide the currently recorded value when you use the marker function in online mode. The marker will be displayed as a little grey triangle in the upper left corner of the diagram. If you click on the triangle and keep the mousebutton pressed, you can shift a vertical marker line along the horizontal time axis. The variable defined as 'marker' then will read the corresponding value from the record curve of the associated project variable.
Do the settings for all variables you want to record. Via button Add a further line will be added at the end of the list. A line can be deleted by button Delete.
Curve configuration: This button opens the dialog Curve configuration. Here some settings concerning the trend curves can be done:
Dialog for doing the curve configuration for the trend element
Curve type: Select one of the options Straight line, Steps or Points. For the first two types the display of Additional points can be defined. For displaying a point a bitmap can be defined, otherwise a filled rectangle (same color as curve) will be used as point symbol. Press the rectangle next to Bitmap to get the standard dialog for selecting a bitmap file. Via Delete the currently set bitmap can be removed from the configuration.
2-40 |
The CoDeSys Visualization |

2 - The Visualization Editor in CoDeSys
Tolerance band: You can define an upper and lower limit value on the vertical axis to be displayed as a tolerance band. For each band a color (Press the color rectangle to get the selection dialog) can be defined. If the bands should be displayed in online mode, activate option Tolerance band as line. If you want the curve to get displayed in the color defined for the respective band as soon as exceeding the tolerance value, activate Curve color outside tolerance like tolerance band. Activate Both or None if you want to activate both or none of the above described display options at a time.
Example: Display of a trend element in online mode:
1. Declaration in program PLC_PRG:
VAR
in: INT; rSinus:REAL; rValue:REAL;
rSlider1:REAL; (*for marker function*) rSlider2:REAL; (*für marker function*)
END_VAR
2, Program part of PLC_PRG:
n:=n+1;
rValue := rValue + 0.01; rSinus:=SIN(rValue)*50 + 50; IF n>100 THEN
n:=0;
END_IF
3. Configuration of a trend element in a visualization: Orientation Left-Right, History activated
Horizontal axis: Division lines: T#2s, Duration: T#10s, Main: T#1s, Sub scale: T#500ms, Degree if accuracy: T#200ms, Legend: Time Format ('hh':'mm':'ss'), Scaling T#2s. Symbol bar activated.
Vertical axis: Division lines visible, Scale: 10, dotted, grey; Scale left, Start: 0, End: 100, Main: 10, Sub scale: 5; Legend: 10; Symbol bar activated.
Variables:
1.Variable PLC_PRG.rsinus, blue line, Marker: PLC_PRG_TRD.rSlider1;
2.Variable PLC_PRG.n, red line, Marker: PLC_PRG_TRD.rSlider2 Curve configuration: Straight line, no tolerance band
Configuration of two display fields for the current record values provided by the marker variables:
Rectangle element 1: Category Text: insert "%s" in the Content field; Category Variables: insert in field Textdisplay: PLC_PRG.rSlider1
Rectangle element 2: Category Text: insert "%s" in the Content field; Category Variables: insert in field Textdisplay: PLC_PRG.rSlider2
(additionally insert a rectangle element at the left border of the rectangle elements 1 and 2, showing the curve color of the corresponding record variable)
The CoDeSys Visualization |
2-41 |