


2 - The Visualization Editor in CoDeSys
2 The Visualization Editor in CoDeSys
Visualization - Overview
A visualization is a graphical representation of the project variables which allows inputs to the PLC program in online mode via mouse and keypad. The CoDeSys visualization editor, which is part of the programming system provides graphic elements which can be arranged as desired and can be connected with project variables. Thereupon in online mode the look of the graphical elements will change depending on the variables values.
Simple example: In order to represent a fill level, which is calculated by the PLC program, draw a bar and connect it to the corresponding project variable, so that the length and color of the bar will show the current fill level value. Add a text field which will display the current value in a text string and a button for starting and stopping the program.
The properties of a single visualization element as well as of the whole visualization object will be defined in appropriate configuration dialogs. There it is possible to set basic parameters by activating options as well as to define a dynamic parameterizing by entering project variables.
Additional special possibilities for configuring are given by the programability of element properties via structure variables.
Using placeholders in the configuration dialogs may save a lot of effort in case you want to use the same visualization object several times with different configurations.
The visualization which is created in the programming system will in many cases be used as the only user interface available for controlling and watching the associated PLC program in online mode. For this purpose it must be possible to give inputs to the program solely by activating visualization elements. To reach this you can use special input possibilities during the configuration of the visualization and you have the option to define special hotkeys for each particular visualization.
A visualization created in CoDeSys can later be used in different ways:
oIt can be made available on CoDeSys HMI, a special runtime system for operating the visualization in full screen mode on a PLC computer.
oIt can be made available as a Web-Visualization, which allows to call and operate it via the Internet (useful for remote maintenance purposes)
o It can be made available as a Target-Visualization, which can be started directly on the PLC.
The CoDeSys Visualization |
2-1 |
2 - The Visualization Editor in CoDeSys
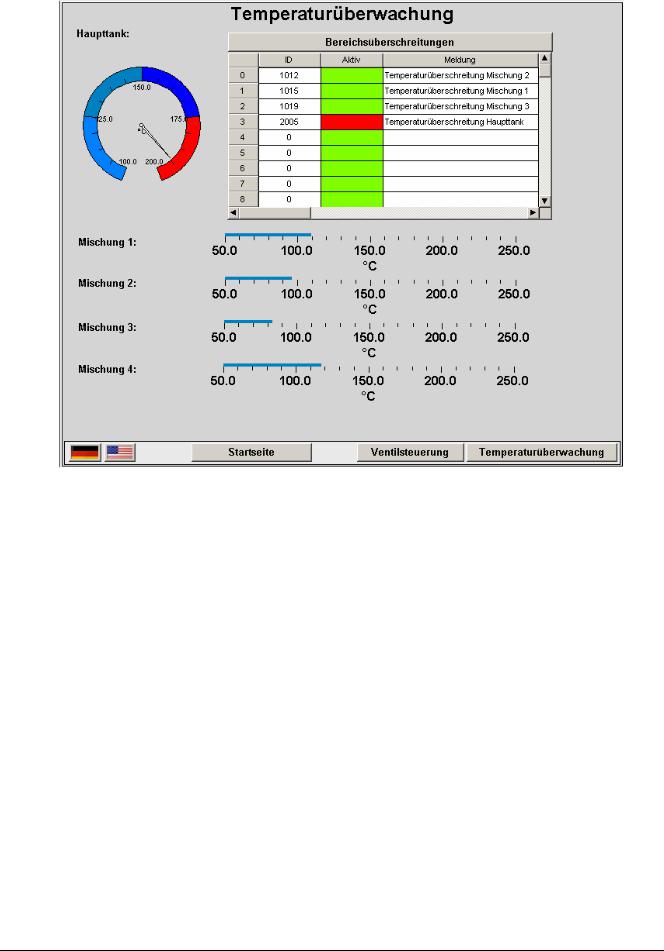
Example of a visualization
2-2 |
The CoDeSys Visualization |
2 - The Visualization Editor in CoDeSys
2.1Create a new Visualization
A visualization object is a CoDeSys object which is managed in the 'Visualization' register of the Object Organizer. It contains an arrangement of visualization elements and can get certain object properties. One or several visualization objects can be created in a CoDeSys project and might be linked with each other.
In order to create a visualization object in the Object Organizer, you must select the register card for  Visualization in the Object Organizer.
Using the 'Project' 'Object Add' command, you can create a new visualization object. Open the 'New visualization' dialog, in which you can enter the name of the new visualization. Once a valid entry is made, that is not a name that is already in use and no special characters used, you can close the dialog with OK. A window opens, in which you can edit the new visualization.
Please regard: If you want to use the implicit variable CurrentVisu (type STRING) for addressing the currently opened visualization object, you throughout must use capital letters for the names of the visualization
objects (e.g. "PLC_VISU"). (For information on implicit variables see here)
2.2Visualization Elements, Insert...
A visualization element is a graphical element, which is used to fill a visualization object. The available elements are offered in the CoDeSys menu bar. Each element gets a separate configuration.
You can insert various geometric forms, as well as bitmaps, metafiles, buttons and existing visualizations, into your visualization.
Geometric forms at your disposal include: rectangles, rounded rectangles, ellipses/circles, and polygons.
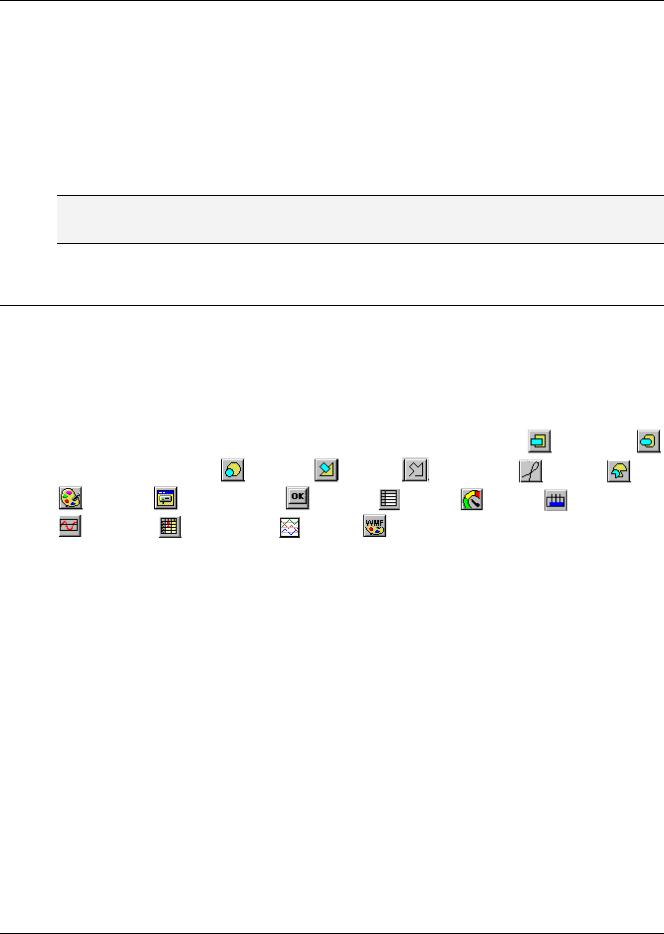
Go to the 'Insert' menu item and select freely from the following commands: |
'Rectangle', |
|||||||
'Rounded Rectangle', |
'Ellipse', |
'Polygon'‚ |
Polyline', |
'Curve', |
'Pie', |
|||
'Bitmap', |
'Visualization', |
'Button', |
'Table', |
'Meter', |
'Bar |
Display', |
||
'Histogram', |
'Alarm table', |
'Trend', |
'WMF file'. A check appears in front of the |
|||||
selected command. You can also use the tool bar. The selected element appears pushed down(e.g. ).
).
If you now go to the editor window with the mouse, you will see that the mouse pointer is identified
with the corresponding symbol (e.g. ). Click on the desired starting point of your element and move the pointer with pressed left mouse key until the element has the desired dimensions.
If you want to create a polygon or a line, first click with the mouse on the position of the first corner of the polygon resp. on the starting point of the line, and then click on the further desired corner points. By doubleclicking on the last corner point you will close the polygon and it will be completely drawn respectively the line will be completed. If you want to create a curve (Bezier curves) determine the initial and two other points with mouse clicks to define the circumscribing rectangle. An arc is drawn after the third mouse click. You can then change the position of the end point of the arc by moving the mouse and can then end the process with a double click or add another arc with additional mouse clicks.
Furthermore pay attention, to the status bar and the change from select and insert modes.
The CoDeSys Visualization |
2-3 |

2 - The Visualization Editor in CoDeSys
'Insert' 'Rectangle'
Symbol: 
With the command you can insert a rectangle as an element into your present visualization. (Use, see Visualization Elements, Insert)
'Insert' 'Rounded Rectangle'
Symbol: 
With the command you can insert a rectangle with rounded corners as an element in your present visualization. (Use, see Visualization Elements, Insert).
'Insert' 'Ellipse'
Symbol: 
With the command you can insert a circle or an ellipse as an element in your present visualization. (Use, see Visualization Elements, Insert).
'Insert' 'Polygon'
Symbol: 
With the command you can insert a polygon as an element in your present visualization. (Use, see Visualization Elements, Insert).
'Insert' 'Polyline'
Symbol: 
With the command you can insert a line as an element into your current visualization. (Use, see Visualization Elements, Insert).
'Insert' 'Curve'
Symbol: 
With the command you can insert a Bezier curve as an element into your current visualization. (Use, see Visualization Elements, Insert).
'Insert' 'Pie'
Symbol: 
Use this command to insert a Pie Segment as an element into your current visualization.
While pressing the left mouse button, bring up an area in the desired size. An oval element including a line marking the radius at the 0° position will be displayed. As long as keeping the mouse button pressed you can immediately change size and position of the element by moving the mouse. A little black square is attended to the the element, indicating the corner of a virtual rectangle surronding the element.
In order to define the start and end angles of a Pie, select the end point of the radius line on the circular arc by a mouse-click. As soon as you, keeping the mouse button pressed, move the cursor, two small rectangles will be displayed, indicating the two angle positions. As from now those can be selected and moved seperately. If you want the angle values get defined dynamically by variables, open the configuration dialog category 'Angle' and enter the desired variable names.
You can resize or reshape the element later by either clicking on the centre point, the cursor getting displayed as diagonally crossed arrows, and moving the mouse while keeping the mouse button
2-4 |
The CoDeSys Visualization |
2 - The Visualization Editor in CoDeSys
pressed (or using the arrow keys). Alternatively you can select and move the corner indicating little square outside of the element. In order to move the element to another position, click inside the element to get the cursor beeing displayed as vertically crossed arrows and then move the cursor.
'Insert' 'Bitmap'
Symbol: 
With the command you can insert a bitmap as an element in your present visualization. (Use, see Visualization Elements, Insert).
While pressing the left mouse button, bring up an area in the desired size. The dialog box is opened for opening a file. Once you have selected the desired bitmap, it will be inserted into the area brought up. You can define in the bitmap configuration dialog, whether a just link to the bitmap file should be stored or the bitmap should be inserted as an element.
'Insert' 'Visualization'
Symbol: 
With the command you can insert an existing visualization as an element in your present visualization. (Use, see Visualization Elements, Insert).
While pressing the left mouse button, bring up an area in the desired size. A selection list of existing visualizations opens. After you have selected the desired visualization, it will be inserted in the defined area.
An inserted visualization will also be named as an instance.
'Insert' 'Button'
Symbol: 
This command is used to insert a button into your current visualization. (Use, see Visualization Elements, Insert).
Drag the element to the desired size with the left mouse button held down.
If a toggle variable is configured for the button it displays the state of this variable by visually displaying whether it is pressed or not pressed. Conversely, the variable is toggled by „pressing" the button.
'Insert' 'WMF file'
Symbol: 
This command is used to insert a Windows Metafile. The standard dialog for opening a file will appear, where you can select a file (extension *.wmf). After having closed the dialog with OK the file will be inserted as an element in the visualization. Please regard, that no link to a file will be saved, like it is done when you insert a bitmap, but the elements of the metafile will be inserted as a group.
'Insert' 'Table'
Symbol: 
Use this command to insert a Table element as an element into your current visualization. It is used to display the current values of the elements of an array.
While pressing the left mouse button, bring up an area in the desired size. Before the element gets displayed the configuration dialog 'Configure table'' will be opened. Here you will find additionally to the standard categories Tooltip and Security the categories 'Table', 'Columns', 'Rows' and 'Selection' where you can define contents and appearance of the table.
The CoDeSys Visualization |
2-5 |
2 - The Visualization Editor in CoDeSys
'Insert' 'Meter'
Symbol: 
Use this command to insert a Meter as an element into your current visualization. It provides a scale which is defined as a sector of a circular arc, and a pointer element.
While pressing the left mouse button, bring up an area in the desired size. Before the element gets displayed the configuration dialog Configure Meter will be opened. Here you can define various parameters concerning the display of the element and a preview is available to check the configuration before really inserting the element by confirming the dialog.
'Insert' 'Bar Display'
Symbol: 
Use this command to insert a Bar Display element into your current visualization. It is used to visualize the value of the assigned variable by a bar indicating the value by its lenght along a horizontal scale.
While pressing the left mouse button, bring up an area in the desired size. Before the element gets displayed the configuration dialog 'Configure bar display' will be opened. Here you can define various parameters concerning the display of the element and a preview is available to check the configuration before really inserting the element by confirming the dialog.
'Insert' 'Histogram'
Symbol: 
Use this command to insert a Histogram element into your current visualization. It is used to visualize the elements of an array by bars which are placed side by side each indicating the value of the element by its length.
While pressing the left mouse button, bring up an area in the desired size. Before the element gets displayed the configuration dialog 'Configure Histogram' will be opened. Here you can define various parameters concerning the display of the element and a preview is available to check the configuration before really inserting the element by confirming the dialog.
'Insert' 'Alarm table'
Symbol: 
Use this command to insert an alarm table into your current visualization object.
While pressing the left mouse button, bring up an area in the desired size. Before the element gets displayed the configuration dialog 'Configure Alarm table' will open. Here you will find additionally to the standard categories Tooltip and Security the categories 'Alarmtable', 'Settings for sorting', 'Columns' and Settings for alarmtable' where you can define contents and appearance of the table.
An alarm table can be used to visualize the alarms, which have been defined in the Alarm configuration of the project.
'Insert' 'Trend'
Symbol:
Use this command to insert a trend element into your current visualization object.. While pressing the left mouse button, bring up an area in the desired size. The configuration (axes, variables, history) is done in the configuration dialog 'Trend'.
The trend element, also named oszilloscope element, is used to display variable values within a certain time period. It stores the data in a file on the client and displays them as a graph. As soon as a value changes, a new entry will be made in the file, showing date/time and the new value.
The trend element is drawn transparently. So you can assign any desired background (bitmap, color).
2-6 |
The CoDeSys Visualization |