

The CoDeSys Visualization
Supplement to the User Manual for PLC Programming
with CoDeSys 2.3
Copyright 2003 by 3S - Smart Software Solutions GmbH
All rights reserved.
We have gone to great lengths to ensure this documentation is correct and complete. However, since it is not possible to produce an absolutely error-free text, please feel free to send us your hints and suggestions for improving it.
Trademark
Intel is a registered trademark and 80286, 80386, 80486, Pentium are trademarks of Intel Corporation.
Microsoft, MS and MS-DOS are registered trademarks, Windows is a trademark of Microsoft Corporation.
Publisher
3S - Smart Software Solutions GmbH
Memminger Straße 151
DE-87439 Kempten
Tel. |
+49 |
831 |
5 40 31 - 0 |
Fax |
+49 |
831 5 40 31 – 50 |
|
Last update 26.06.2004
Document Version 1.4, CoDeSys V2.3.3.3
Content
Table of Content
1 Advantages of an integrated visualization |
1-1 |
||
|
|
|
|
2 The Visualization Editor in CoDeSys |
2-1 |
||
|
2.1 |
Create a new Visualization ................................................................................. |
2-3 |
2.2 |
Visualization Elements, Insert............................................................................. |
2-3 |
|
2.3 |
Positioning of Visualization Elements... .............................................................. |
2-7 |
|
2.4 |
Visualization, Configure - Overview.................................................................. |
2-10 |
|
2.4.1 |
Visualization Elements, Configure... ................................................................. |
2-10 |
|
2.4.2 |
Visualization Object, Configure......................................................................... |
2-47 |
|
2.5 |
Dynamic Texts .................................................................................................. |
2-52 |
|
2.5.1 |
Configuration .................................................................................................... |
2-52 |
|
2.5.2 |
XML-File for Dynamic Texts ............................................................................. |
2-53 |
|
2.6 |
Calling up language-dependent Online Help via a visualization element ......... |
2-55 |
|
2.7 |
Placeholder Concept ........................................................................................ |
2-56 |
|
2.8 |
Visualization in Online Mode... ......................................................................... |
2-57 |
|
2.9 |
Visualizations in libraries... ............................................................................... |
2-58 |
|
3 |
CoDeSys HMI |
3-1 |
||
|
3.1 |
Installation, Start and Operating ......................................................................... |
3-1 |
|
4 |
Web-Visualization |
4-1 |
||
|
4.1 |
Preconditions ...................................................................................................... |
4-1 |
|
|
4.2 |
Editing the WebVisu.htm file............................................................................... |
4-1 |
|
|
4.3 |
Preparing a Web-Visualization in CoDeSys ....................................................... |
4-2 |
|
|
4.4 |
Configuration and Start of the Web Server......................................................... |
4-2 |
|
|
4.5 |
Calling a Web-Visualization via Internet ............................................................. |
4-3 |
|
5 |
Target-Visualization |
5-1 |
||
|
5.1 |
Preconditions ...................................................................................................... |
5-1 |
|
|
5.2 |
Creating a Target-Visualization .......................................................................... |
5-1 |
|
|
5.3 |
Starting the Target-Visualization......................................................................... |
5-3 |
|
Appendix A |
|
Implicit Variables in the Visualization |
A-1 |
|
6 |
Index |
|
|
|
The CoDeSys Visualization |
i |

Inhalt
ii |
The CoDeSys Visualization |
1 - Advantages of an integrated visualization
1 Advantages of an integrated visualization
For visualizing, that means watching and operating the data of a controller which has is programmed with CoDeSys, no additional tool is required. The programming system contains an integrated visualization editor (see CoDeSys User Manual), allowing the user to create visualization objects to the parallel to the development of the application in the same user interface.
The integration offers a lot of benefits:
The visualization integrated in CoDeSys does not need a tag list and it can directly access the variables in the controller. Any OPCor DDE-layer, which often is difficult to configure, is also not necessary, because the communication is done by the same mechanism which is used for the programming system. Thus the engineering effort for the realization of visualizations will be clearly reduced. Besides that the connection of controller and visualization allows running modes (see below), in which the conventional display on a PC with a monitor is not needed any longer.
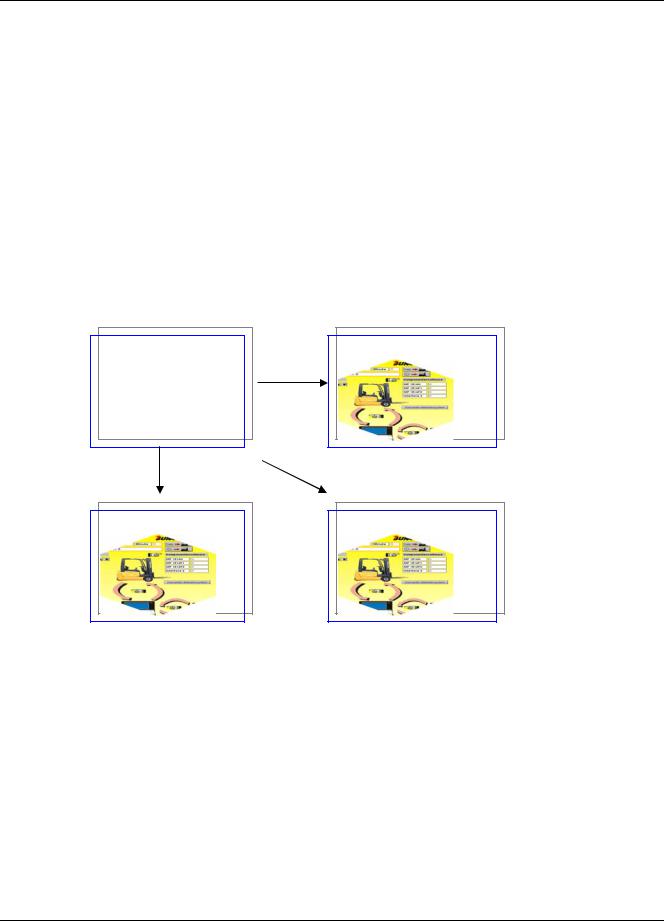
One of the main advantages of the concept: The visualization masks which are created in the programming system can run in four different modes without requiring any modifications, if desired even parallel:
1. Directly in the programming system
For testing the created visualization masks, but also for service or diagnosis purposes in direct connection with the controller you do not need a further tool: In online mode you immediately get a display of the visualizations within the programming system.
CoDeSys
XML
WebVisualisierung
CoDeSys HMI
ST-Code
TargetVisualisierung
2. CoDeSys HMI
The program CoDeSys HMI, which displays visualizations on a PC without the complete development user interface, also communicates via the programming interface. The configuration of OPC (OPC - OLE for Process Control) – resp. DDE (DDE – Dynamic Data Excange) inteface is not necessary. See chapter 3.
3. Web-Visualization
Optionally CoDeSys generates a description in XML format from the visualization data, which is loaded to the controller together with a Java-Applet (Applet – a program developped in the programming language JAVA, which can be processed by browsers) and which can be displayed via TCP/IP on a browser. Thus the visuaization data are available online on various platforms. See chapter 4.
The CoDeSys Visualization |
1-1 |

1 - Advantages of an integrated visualization
4. Target-Visualization
For controllers with integrated display the visualization data can be loaded from the programming system together with the application to the target system. There they get displayed automatically. This solution can be portated with low effort to any devices which are programmable with CoDeSys. See chapter 5.
Overview on the functions:
• Elements
-Rectangle, Ellipse, Rounded rectangle
-Line, Polygon, Polyline, Curve
-Bitmap, WMF-file
-Button, Table, Histogram, Bar Display, Meter
-Reference to another visualization (instance)
• Animations (depending on element type):
-Text display
-Color changes
-Visible/Invisible
-Shift
-Rotation
-Scaling
-Offset on the particular edges of an object (for Bar Display)
-Button activ/inactiv
-Current line (only text display)
• Input possibilities:
-Toggle/tap Boolean value
-Text input
-Change of visualization
-Special actions (Leave visualization, Read/Write receipts, Switch language, call external EXE etc.)
-Choose line (only text display)
• Further properties
-Switching language
-Tooltips for all elements
-ASCII Import/Export
-Background Bitmap
-Automatic Scaling
-Drawing operations: Alignment, Order, Grouping
-Placeholder concept for creating objects with complex graphic elements
-Programmed visualization expressions
1-2 |
The CoDeSys Visualization |