

3 - We Write a Little Program
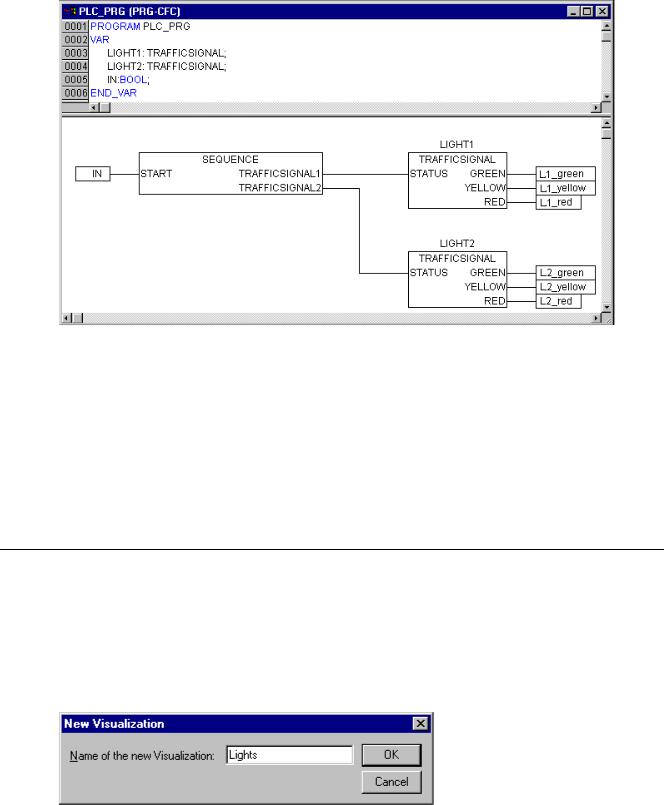
PLC_PRG, Declaration and presentation with the continuous function chart editor
TRAFFICSIGNAL simulation
Now test your program in simulation mode. Compile ('Project' 'Build') and load ('Online' 'Login') it. Start the program by 'Online' 'Start', then set variable ON to TRUE, e.g. by a double-click on the entry "ON" in the input box of the CFC editor. This will mark the variable as prepared to be set to <TRUE>. Then press <Ctrl><F7> or command 'Online' 'Write values', to set the value. Now variable START in ABLAUF (which we had set to TRUE manually in the first extension level of the program) gets this value by variable ON, which is used in PLC_PRG. This will make run the traffic light cycles. PLC_PRG has changed to a monitoring window. Click twice on the plus sign in the declaration editor, the variable display drops down, and you can see the values of the individual variables.
3.2Visualizing a Traffic Signal Unit...
With the visualization of CoDeSys you can quickly and easily bring project variables to life. We will now plot two traffic signals and an ON-Switch for our traffic light unit which will illustrate the switching process.
Creating a new visualization
In order to create a visualization you must first select the range of Visualization in the Object Organizer. First click on the lower edge of the window on the left side with the POU on the register card with this symbol and the name Visualization. If you now choose the command 'Project' 'Object Add', then a dialog box opens.
Enter here any name. When you confirm the dialog with OK, then a window opens in which you can set up your new visualization.
Insert element in Visualization
For our TRAFFICSIGNAL visualization you should proceed as follows:
CoDeSys V2.3 |
3-11 |
Visualizing a Traffic Signal Unit...
•Give the command 'Insert' 'Ellipse'.Insert..Ellipse.>Proc and try to draw a medium sized circle (?2cm). For this click in the editor field and draw with pressed left mouse button the circle in its length.
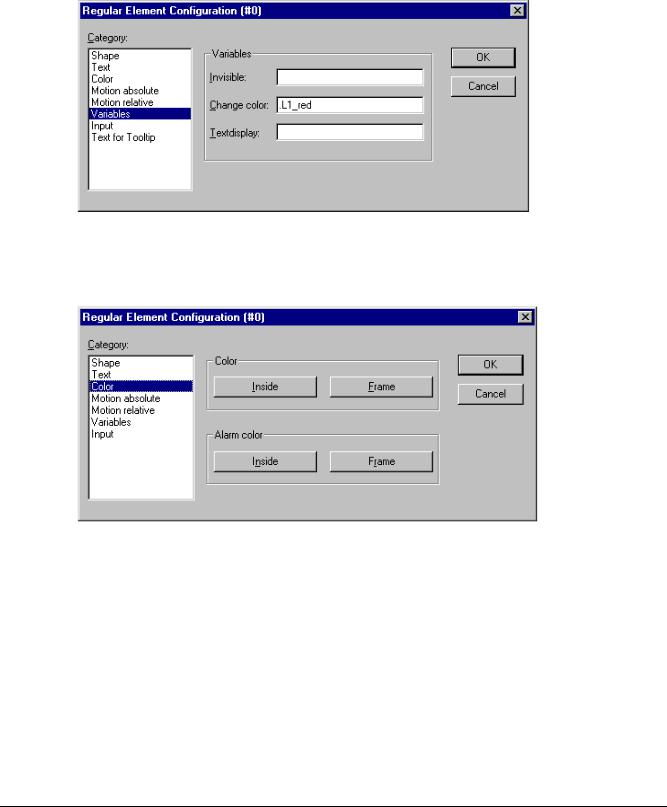
•Now double-click the circle. The dialog box for editing visualization elements opens
•Choose the category Variables and in the field Change color enter the variable name .L1_red or "L1_red". That means that the global variable L1_red will cause the color change as soon as it is set to TRUE. The dot before the variable name indicates that it is a global variable, but it is not mandatory.
•Then choose the category Color and click on the button Inside in the area Color. Choose as neutral a color as possible, such as black.
•Now click on the button within in the area Alarm color and choose the red which comes closest to that of a red light.
The resulting circle will normally be black, and when the variable RED from TRAFFICSIGNAL1 is TRUE, then its color will change to red. We have therefore created the first light of the first
TRAFFICSIGNAL!
The other traffic lights
Now enter the commands 'Edit' 'Copy' (<Ctrl>+<C>) and then twice 'Edit' 'Paste' (<Ctrl>+<V>). That gives you two more circles of the exact same size lying on top of the first one. You can move the circles by clicking on the circle and dragging it with pressed left mouse button. The desired position should, in our case, be in a vertical row in the left half of the editor window. Double-click on one of the other two circles in order to open the configuration dialog box again. Enter in the field Change Color of the corresponding circle the following variables:
for the middle circle: L1_yellow for the lowest circle: L1-green
3-12 |
CoDeSys V2.3 |
3 - We Write a Little Program
Now choose for the circles in the category Color and in the area Alarm color the corresponding color (yellow or green).
The TRAFFICSIGNAL case
Now enter the command 'Insert' 'Rectangle', and insert in the same way as the circle a rectangle which encloses the three circles. Once again choose as neutral a color as possible for the rectangle and give the command 'Extras' 'Send to back' so that the circles are visible again.
If simulation modeis not yet turned on, you can activate it with the command 'Online' 'Simulation'.
If you now start the simulation with the commands 'Online' 'Login' and 'Online' 'Run', then you can observe the color change of the first traffic signal.
The second traffic signal
The simplest way to create the second traffic signal is to copy all of the elements of the first traffic signal. For this you select all elements of the first traffic signal and copy them (as before with the lights of the first traffic signal) with the commands 'Edit' 'Copy' and 'Edit' 'Paste'. You then only have to change the text "TRAFFICSIGNAL1" in the respective dialog boxes into "TRAFFICSIGNAL2", and the visualization of the second traffic signal is completed.
The ON switch
Insert a rectangle and award it, as described above, a colour for a traffic light of your choice and enter
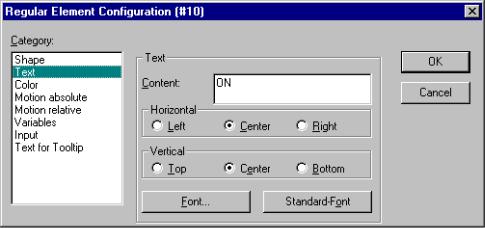
.ON at Variables for the Change color. Enter "ON" in the input field for Content in the category Text.
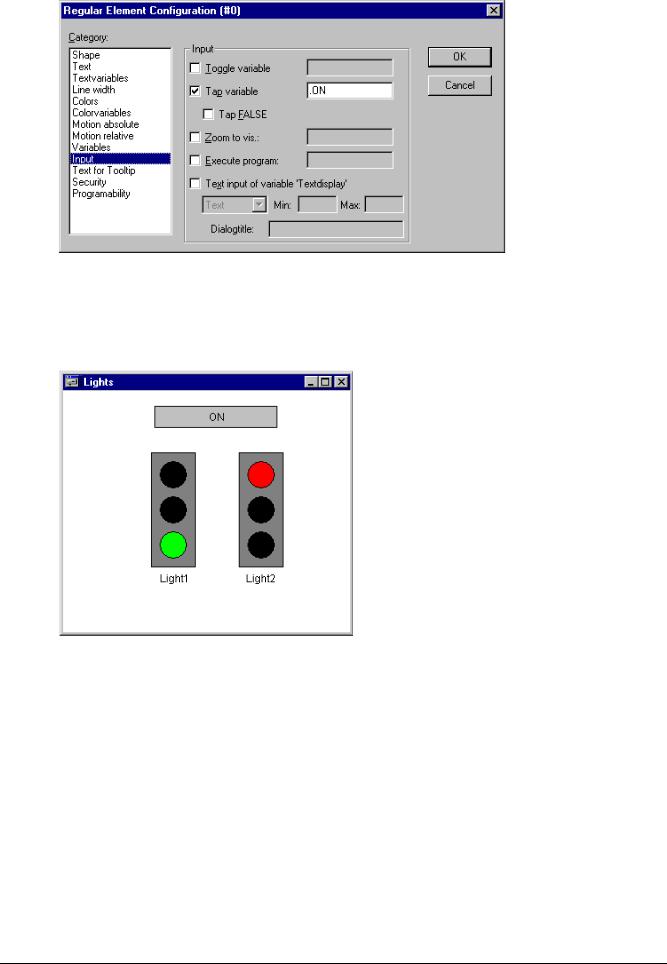
In order to set the variable ON to TRUE with a mouse click on the switch, activate option 'Toggle variable' in category 'Input' and enter variable name ".ON" there. Variable keying means that when a mouse click is made on the visualization element the variable .ON is set to the value TRUE but is reset to the value FALSE when the mousekey is released again (we have created hereby a simple switch-on device for our traffic lights program).
CoDeSys V2.3 |
3-13 |
Visualizing a Traffic Signal Unit...
Font in the visualization
In order to complete the visualization you should first insert two more rectangles which you place underneath the traffic signals.
In the visualizations dialog box set white in the category Color for Frame and write in the category Text in the field Contents "Light1" or "Light2". Now your visualization looks like this:
3-14 |
CoDeSys V2.3 |