

The Sampling Trace
6.9The Sampling Trace
6.9.1Overview and Configuration
Sample tracing will be available as an object in the CoDeSys resources, if it is activated in the target settings (category 'General').It can be used to trace the progression of values for variables is traced over a certain time. These values are written in a ring buffer (trace buffer). If the memory is full, then the "oldest" values from the start of the memory will be overwritten. As a maximum, 20 variables can be traced at the same time. A maximum of 500 values can be traced per variable.
Since the size of the trace buffer in the PLC has a fixed value, in the event of very many or very wide variables (DWORD), fewer than 500 values can be traced.
Example: if 10 WORD variables are traced and if the memory in the PLC is 5000 bytes long, then, for every variable, 250 values can be traced.
In order to be able to perform a trace, open the object for a  Sampling Trace in the Resources register card in the Object Organizer. Create resp. load an appropriate trace configuration and define the variables to be traced. (See 'Extras' 'Trace Configuration' and 'Selection of the Variables to be Displayed').
After you have created the configuration and have started the trace in the PLC ('Start Trace'), then the values of the variables will be traced. With 'Read Trace', the final traced values will be read out and displayed graphically as curves.
A Trace (variable values and configuration) can be saved and reloaded in project format (*.trc) or in XML format (*.mon). Just the configuration can be stored and reloaded via a *.tcf-file.
Various traces can be available in a project for getting displayed. They are listed in a selection list ('Trace') in the upper right corner of the trace window. You can select one of those to be the currently used trace configuration.
Please regard: If a task configuration is used for controlling the program, the trace functionality refers to the debug task.
Selection of the Variables to be Displayed
The combo box es to the right, next to the window for displaying curves trace variables defined in the trace configuration. If a variable is selected from the list, then after the trace buffer has been read the variable will be displayed in the corresponding color (Var 0 green, etc.). Variables can also be selected if curves are already displayed.
A maximum of up to eight variables can be observed simultaneously in the trace window.
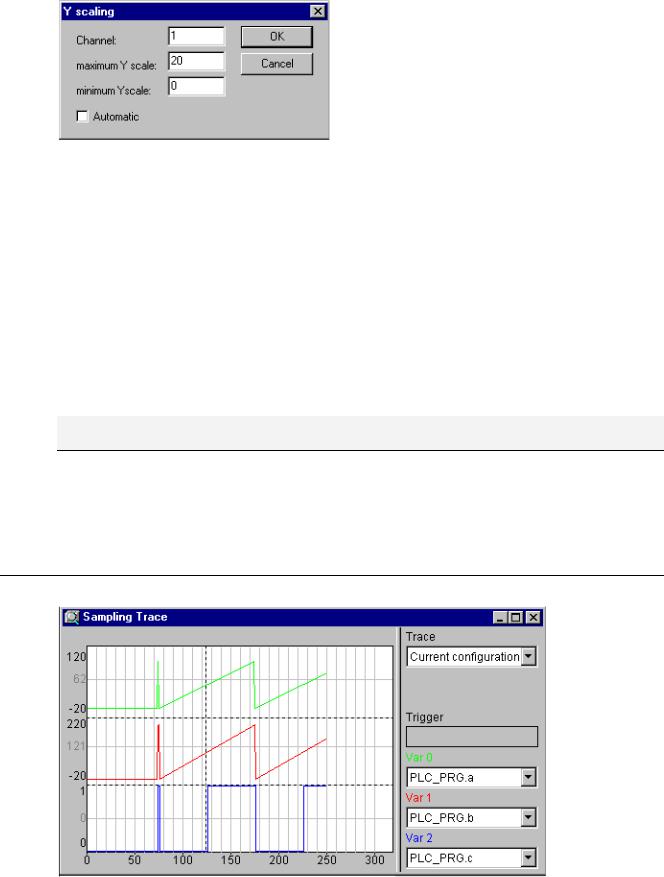
'Extras' 'Y Scaling'
With this command you can change the preset Y scaling of a curve in the trace display. By doubleclicking on a curve you will also be given the dialog box 'Y-scaling'.
As long as option Automatic is activated, the default scaling will be used, which depends on the type of the used variable. In case of enumeration variables the enumeration values will be displayed at the scale. In order to change the scaling, deactivate option 'Automatic' and enter the number of the respective curve (Channel) and the new maximum (maximum y scale) and the new minimum value (minimum y scale) on the y axis.
The channel and the former value are preset.
6-54 |
CoDeSys V2.3 |
6 - The Resources
Dialog Box for Setting the Y Scale
'Extra' 'Start Trace'
Symbol: 
With this command the trace configuration is transferred to the PLC and the trace sampling is started in the PLC.
'Extra' 'Read Trace'
Symbol: 
With this command the present trace buffer is read from the PLC, and the values of the selected variables are displayed.
Use the commands of this menu to save or reload traces (configuration + trace values) in files resp. from files, to load a trace from the controller to the project or to set a certain trace as that which should be used in the project.
Note: Regard the alternative way of storing and reloading traces by using the commands of menu 'Extras' 'Save Trace' (Project format, *.trc-Datei, ASCII) !
'Extra' 'Stop Trace'
Symbol: 
This command stops the Sampling Trace in the PLC.
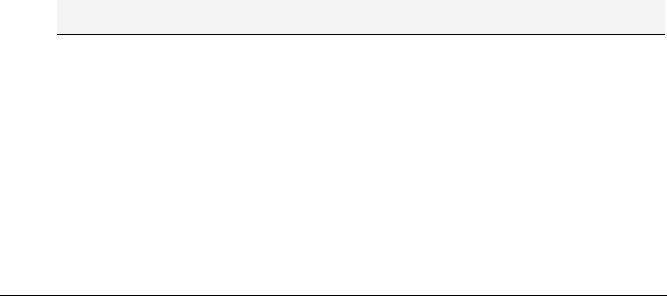
6.9.2Display of the Sampling Trace
Sampling Trace of Different Variables
If a trace buffer is loaded, then the values of all variables to be displayed will be read out and displayed. If no scan frequency has been set, then the X axis will be inscribed with the continuous
CoDeSys V2.3 |
6-55 |
The Sampling Trace
number of the traced value. The status indicator of the trace window (first line) indicates whether the trace buffer is full and when the trace is completed.
If a value for the scan frequency was specified, then the x axis will specify the time of the traced value. The time is assigned to the "oldest" traced value. In the example, e.g., the values for the last 25 seconds are indicated.
The Y axis is inscribed with values in the appropriate data type. The scaling is laid out in a way that allows the lowest and the highest value to fit in the viewing area. In the example, Var 0 has taken on the lowest value of 6, and the highest value of 100: hence the setting of the scale at the left edge.
If the trigger requirement is met, then a vertical dotted line is displayed at the interface between the values before and after the appearance of the trigger requirement.
A memory that has been read will be preserved until you change the project or leave the system.
'Extras' 'Cursor Mode'
The easiest way to set a cursor in the monitoring area is to click there with the left mouse button. A cursor appears and can be moved by the mouse. At the top of the monitoring window the current x- position of the cursor is displayed. In the fields next to 'Var 0', 'Var 1', ..., 'Var n' the value of the respective variable is shown.
Another way is the command 'Extras' 'Cursor mode'. With this command two vertical lines will appear in the Sampling Trace. First they are laying one on the other. One of the lines can be moved to the right or to the left by the arrow keys. By pressing <Ctrl>+<left> or <Ctrl>+<right> the speed of the movement can be increased by factor 10.
If additionally the <Shift> key is pressed, the second line can be moved, showing the difference to the first one.
'Save to file'
With this command a trace (configuration + values) can be saved in a file in XML format. For this purpose the standard dialog for saving a file opens. Automatically the file extension *.mon will be used.
A *.mon-file can be reloaded to a project with command 'Load from file'.
'Load from file'
With this command a trace (configuration + values), which is available in a file in XML format (*.mon, can be loaded into the project. The dialog for opening a file will open and you can browse for files with extension *.mon. The loaded trace will be displayed and added to the selection list in field 'Trace in the configuration dialog. If you want to set it as currently used project trace configuration, use command 'Set as project configuration'.
A *.mon-file can be created by using command 'Save to file'.
Note: Regard the alternative way of saving a trace by using the commands of menu 'Extras' 'Save trace values'.
'Extra' 'Read Trace'
Symbol: 
With this command the present trace buffer is read from the PLC, and the values of the selected variables are displayed.
'Set as project configuration'
With this command the trace configuration which is currently selected in the list of available traces (field 'Trace' in the trace window) can be set as active configuration within the project. The selection list besides the currently used (top position) offers all traces which have been loaded to the project by command 'Load from file' from *.mon-files (e.g. for the purpose of viewing).
6-56 |
CoDeSys V2.3 |
6 - The Resources
'Load from controller'
With this command the trace (configuration + values) which is currently used on the controller can be loaded to the CoDeSys project. It will be displayed in the trace window and can be set as active project trace configuration.
6.9.3'Extras' 'Save Trace'
Use the commands of this menu to save traces (configuration + values) to files resp. to reload them from files to the project. Besides that a trace can be saved in a file in ASCII-format.
Note: Regard the alternative way of storing and reloading traces by using the commands of menu 'Extras' 'External Trace Configurations' (XML format, *.mon-file) !
'Save Values'
With this command you can save a Sampling Trace (values + configuration data). The dialog box for saving a file is opened. The file name receives the extension "*.trc".
Be aware, that here you save the traced values as well as the trace configuration, whereas Save trace in the configuration dialog only concerns the configuration data.
The saved Sampling Trace can be loaded again with 'Extras' 'Load Trace'.
'Load Values'
With this command a saved Sampling Trace (traced values + configuration data) can be reloaded. The dialog box for opening a file is opened. Select the desired file with the "*.trc" extension.
With 'Extras' 'Save Values' you can save a Sampling Trace.
'Extras' 'Stretch'
Symbol: 
With this command you can stretch (zoom) the values of the Sampling Trace that are shown. The beginning position is set with the horizontal picture adjustment bar. With repeated stretches that follow one-after-another, the trace section displayed in the window will increasingly shrink in size.
This command is the counterpart to 'Extras' 'Compress'.
6.9.4'Extras' 'External Trace Configurations'
'Extras' 'Show grid'
With this command you can switch on and off the grid in the graphic window. When the grid is switched on, a check (9) will appear next to the menu item.
'Extras' 'Compress'
Symbol: 
With this command the values shown for the Sampling Trace are compressed; i.e., after this command you can view the progression of the trace variables within a larger time frame. A multiple execution of the command is possible.
This command is the counterpart to 'Extras' 'Stretch'.
'Extras' 'Cursor Mode'
The easiest way to set a cursor in the monitoring area is to click there with the left mouse button. A cursor appears and can be moved by the mouse. At the top of the monitoring window the current x-
CoDeSys V2.3 |
6-57 |