


6 - The Resources
For this use the input assistant (<F2>) or enter manually the name of an already existing POU (e.g. "PLC_PRG" or "PRG.ACT1"), or insert a name for a not yet existing POU. In order to get this POU created in the project, press button Create POU. Hereupon the POU will be inserted in the Object Organizer. The input and output parameters which are required by the event will automatically be defined in the declaration part of the POU. Below the assignment table the currently selected event is displayed in a picture, showing the required parameters.
If you actually want the POU to be called by the event, activate the entry in the assignment table ( ). Activating/deactivating is done by a mouse click on the control box.
Which task is being processed?
•For the execution, the following rules apply:
•That task is executed, whose condition has been met; i.e., if its specified time has expired, or after its condition (event) variable exhibits a rising edge.
•If several tasks have a valid requirement, then the task with the highest priority will be executed.
•If several tasks have valid conditions and equivalent priorities, then the task that has had the longest waiting time will be executed first.
•The processing of the program calls will be done according to their order (top down) in the task editor.
6.7.3Taskconfiguration in Online Mode
In online mode the status and number of passed through cycles of each task will be displayed in the configuration tree. The time flow is monitored in a diagram. Precondition: the libraries SysTaskInfo.lib and SysTime.lib must be included in the project to provide functions for the internal evaluation of the task times. The libraries will be included automatically as soon as a target is set which supports the task monitoring.
Display of task status in the configuration tree:
In online mode the current status of a task will be displayed in brackets at the end of the task entry line in the configuration tree, also the number of already passed through process cycles. This update interval is the same as usual for the monitoring of PLC values. The possible stati:
has not been started since last update; especially used for event tasks has been started at least once since last update
stopped
stopped, because breakpoint in task is reached Error, e.g. division by zero, page fault etc. cycle time has been exceeded
The task entry will be displayed red coloured in case of status 'Stop on Error' or 'Stop Watchdog' .
Display of the time flow of the tasks
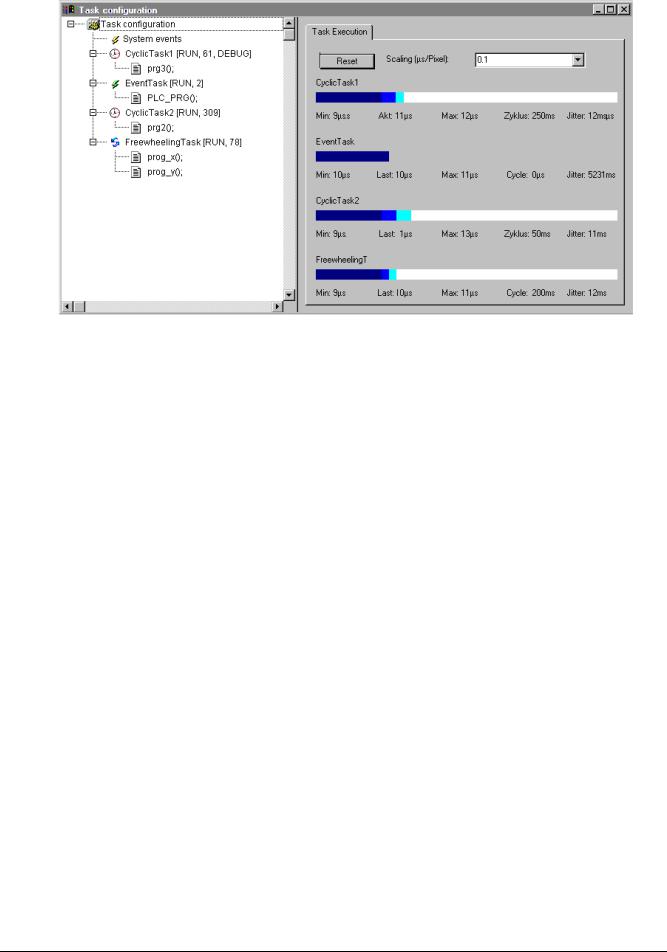
If the entry 'Taskconfiguration' is selected in the configuration tree, the utilization of the tasks will be displayed in bar charts in the right part of the window:
CoDeSys V2.3 |
6-49 |
Task Configuration...
Display of the Task Execution in Online Mode
For each task a bar chart is displayed. The length of the bar represents the length of a cycle period. Below the bar as well as by appropriate marks on the bar the following measurement values are illustrated:
Min: minimum measured runtime in µs
Akt: last measured runtime in µs
Max: maximum measured runtime in µs
Cycle: total length of a cycle in µs
Jitter: maximum measured jitter in µs
The button Reset can be used to set back the values of Min., Max. and Jitter to 0.
The scaling of the chart (microseconds per Pixel) can be adjusted by the aid of a selection list at
Scaling [µs/Pixel].
Additional online functions in the context menu resp. in the 'Extras' menu:
'Extras' 'Set Debug Task'
With this command a debugging task can be set in Online mode in the Task Configuration. The text [DEBUG] will appear after the set task.
The debugging capabilities apply, then, only to this task. In other words, the program only stops at a breakpoint if the program is gone through by the set task.
'Extras' 'Enable / disable task'
With this command the task which is currently marked in the task configuration can be disabled or reenabled. A disabled task will not be regarded during processing of the program. In the configuration tree it is indicated by a greyed entry.
'Extras' 'Callstack'
This command is available in the Extras menu in the Task Configuration. If the program is stopped at a breakpoint during debugging, it can be used to show the callstack of the corresponding POU. For this purpose the debug task must be selected in the task configuration tree of. The window 'Callstack of task <task name>' will open. There you get the name of the POU and the breakpoint position (e.g.
6-50 |
CoDeSys V2.3 |