

Ceramic materials Carter Horton / fulltext 20 Powders Fibers Platelets Composites
.pdf20
Powders, Fibers, Platelets, and Composites
CHAPTER PREVIEW
The topic of this chapter is how to produce particles of a particular shape, chemistry, and size and then how to characterize them. We are going to describe the methods used to produce ceramic powders, from the traditional ball-milling technique to more recent vapor-phase approaches that can produce nanometer-sized particles. It is worth remembering that powder processing is used to produce some special metals (e.g., tungsten filaments for incandescent lamps), it is used in the pharmaceutical industry, for making catalysts, and it is used to prepare many food ingredients.
Producing powders of a consistent quality and composition is an important industry. In the United States the total market for powders of advanced ceramics (e.g., electronic and structural ceramics) alone is around $1 billion per year.
To specify powders for particular applications and products we need to be able to determine their physical and chemical characteristics, often with a high degree of accuracy and with statistical significance. In this chapter we will describe the different analytical techniques used for particle characterization and also indicate which technique works best. In addition to powders there are other important dimensionally constrained forms of ceramics. Whiskers and fibers are long in one dimension but restricted in the other two. Ceramics in these forms are important reinforcement phases in composites, such as
C fibers in polymer–matrix composites (PMCs)
Al2O3 fibers in metal–matrix composites (MMCs)
SiC whiskers in ceramic–matrix composites (CMCs)
If the particles are constrained in only one dimension, we have platelets. The amount of space we devote to platelets does not correlate with their commercial importance: remember that clay particles are platelets. The excuse is that most platelet particles are produced in nature while we are concentrating on particles we “design.”
If we limit the size in two or three dimensions to less than 100 nm, we have nanomaterials.
20.1 MAKING POWDERS
Many methods are available for the preparation of ceramic powders. These can be divided into just three basic types:
Mechanical
Chemical
Vapor phase
Mechanical methods use coarse-grained materials that have generally been derived from naturally occurring minerals. They are subjected to a series of processes, collectively referred to as comminution, in which the particle
size is gradually reduced. The final step is known as milling, which produces particles of the desired size. Mechanical methods of powder production are used widely in the production of traditional ceramic products where high purity powders are not required and cost is one of the most important requirements.
Chemical methods, such as sol-gel processing, offer several advantages over mechanical methods because they allow exceptional control over particle morphology and purity. Chemical processes are used widely in the production of advanced ceramic materials.
Vapor-phase processes can be used to produce ceramic powders. They tend to be expensive, but offer many advantages, such as the ability to produce particles of nonoxides.
2 0 .1 M A K I N G P O W D E R S ................................................................................................................................................... |
359 |
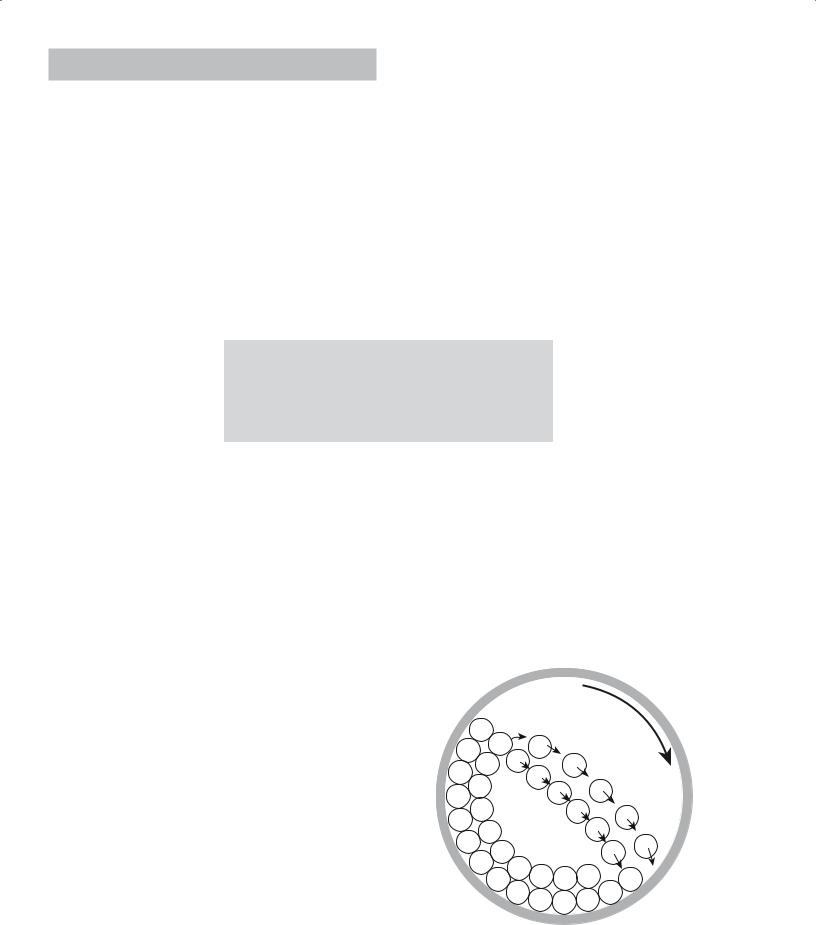
TABLE 20.1 Desirable Powder Characteristics for
Advanced Ceramics
Powder characteristic |
Desired property |
|
|
Particle size |
Fine (<1 μm) |
Particle size distribution |
Narrow |
Particle shape |
Spherical or equiaxed |
State of agglomeration |
No agglomeration or soft agglomerates |
Chemical composition |
High purity |
Phase composition |
Single phase |
|
|
Vapor phase techniques are also used to produce nanoparticles (particles with diameters of a few to 10s of nanometers).
Table 20.1 lists the desirable powder characteristics for advanced ceramics. For most processing methods we want a small particle size. The small size helps shape the product and during densi-
fication (sintering) at high temperature, allows higher density bodies at lower firing temperatures.
20.2 TYPES OF POWDERS
Powders can have a complex structure; to describe this structure it is necessary to follow a consistent terminology. The terminology we use follows that used in the ceramic processing industry.
Primary particles are the smallest clearly identifiable unit in the powder. Primary particles may be crystalline or amorphous and cannot easily be broken down into smaller units.
Agglomerates are clusters of bonded primary particles. Soft agglomerates are easily broken up; hard agglomerates, because of the stronger interparticle bonds, are more difficult to break up. Hard agglomerates should be avoided in ceramic powder processing as much as possible.
Particles is a general term applied to both primary particles and agglomerates. Some of the techniques that we refer to in the next section measure particle size often with no distinction between agglomerates and primary particles.
Granules are large agglomerates, usually 0.1–1 mm in diameter, that are formed by the addition of a granulating agent (e.g., a polymer binder). The mixture is tumbled, producing large, nearly spherical granules that flow freely and can be used to fill complex molds and in automated processes.
Flocs are clusters of particles in a liquid suspension held together electrostatically.
Colloids are very fine particles (they can be as small
as 1 nm in diameter) held in fluid suspension by
Brownian motion. Consequently, colloidal particles will settle very slowly.
Aggregates are coarse constituents, >1 mm, in a mixture. The important example is the addition of gravel to cement to make concrete. In early concrete structures such as the Pantheon in Rome, pumice was used as aggregate.
20.3 MECHANICAL MILLING
For traditional raw materials like clay and the oxides produced from ores, it is often necessary to eliminate aggregates and to reduce the particle size. Compound formation during firing and densification during sintering require diffusion between neighboring particles. Diffusional processes are proportional to the square of the particle size.
The most common method for reducing particle size is ball milling. A ball mill is a barrel (usually made of a ceramic, although for small-scale milling in the laboratory a small plastic bottle works well) that rotates on its
axis and is partially filled with a grinding medium (called media) in the form of spheres, cylinders, or rods. Figure 20.1 shows a crosssection of a ball mill. The quantity of the media is such that the rotation of the mill causes it to cascade, creating both shearing and crushing actions on the powder.
The media should have a high density (ρ) as this provides for the most effective collisions. The choice of media is also based on cost, wear resistance, and the possibility of introducing contamination into the powder.
Mill rotation
FIGURE 20.1 Cross section of a ball mill showing the movement of the media as the mill rotates about its axis.
360 ......................................................................................................... |
P O W D E R S , F I B E R S , P L A T E L E T S , A N D C O M P O S I T E S |

TABLE 20.2 Possible Particles Sizes for Different
Milling Techniques
Jaw crushers |
to 5 mm |
Cone crushers |
to 5 mm |
Crushing rolls |
to 1 mm |
Hammer mill |
to 0.1 mm |
Jet mill |
1 to 50 μm |
Vibratory mill |
1 to 50 μm |
Ball mill |
0.5–10 μm |
Attrition mill |
0.1–5 μm |
Roller mill |
0.1–5 μm |
|
|
Depending on the amount of powder to be milled, the size of the mill, and the final particle size required, the media could range from more than 8 cm
in diameter to 0.6 cm, which is used for fine grinding. The powder is often milled in a liquid with a surface-active agent added. Ball milling eliminates aggregates and can typically reduce the particle size down to 1 μm.
The advantages of ball milling are that the equipment
is
Simple (although experimentally straightforward, there are many theoretical aspects that are quite complex)
Inexpensive (at least for small batch sizes) The disadvantages of ball milling are that it
Cannot produce ultrafine particles
Can add impurities to the powder from the media and the inside of the mill
Is inefficient, less than 2% of the energy input goes into creating new surfaces
You have seen polished stones of hematite, quartz, etc. These are obtained by tumbling in the same type of mill— the “particle” size is just bigger. The biggest “ball” mill is the seashore, where pebbles are eventually changed into sand.
There are many other mechanical methods that can be used to achieve comminution. The possible particle size range for each is compared in Table 20.2; we describe three of the methods in more detail below.
Fluid-energy milling, also called jet milling, achieves particle size reduction by particle–particle impact in a high-velocity fluid, usually either compressed air or superheated steam. The powder is added to the fluid and injected into the grinding chamber at sonic or near-sonic velocity. The design of the chamber maximizes particle–particle impact while minimizing particle–wall impact. Coating
of the walls of the chamber, e.g., with a polymer, can further reduce contamination. Fluid-energy milling can achieve controlled particle size (down to about 1 μm) with a narrow size
distribution. Table 20.3 shows examples of ceramic powders formed by fluid-energy milling. The main drawback with this method is collecting the fine powder that is mixed into the gas stream.
In vibratory milling the drum containing the media and powder is vigorously shaken. The collisions between the media are much more violent than they are in ball milling and this can shorten milling times. Polymer balls can be used as media and this means any contamination can be burned off during subsequent firing.
Attrition milling, or agitated ball milling, differs from conventional ball milling in that the milling chamber does not rotate. Instead, a slurry containing the particles and media is stirred continuously at frequencies of 1–10 Hz. The grinding chamber is aligned either vertically, as shown in Figure 20.2, or horizontally, with the stirrer located in the center of the chamber. The media consists of small spheres (0.2–5 mm) that make up between 60 and 90% of the available mill volume. Most attrition mills work on a continuous basis with the powder to be milled fed in at one end and the milled product collected at the other. Attrition mills are more energy efficient than the other methods we have described and can also handle higher solid contents in the slurry. The rapid milling time, because of the use of small media, helps reduce contamination.
TABLE 20.3 Examples of Ceramic Powders Produced by Fluid-Energy Milling
|
|
|
|
|
|
|
|
Average particle |
|
|
Mill diameter |
Grinding |
Material feed rate |
|
size obtained |
||||
|
|
|
|
|
|
|
|
|
|
|
|
|
|
|
|
|
mm |
|
|
Material |
cm |
in. |
medium |
kg/h |
lb/h |
|
in. |
||
|
|||||||||
|
|
|
|
|
|
|
|
|
|
Al2O3 |
20.3 |
8 |
|
Air |
6.8 |
15 |
3 |
0.00012 |
|
TiO2 |
76.2 |
30 |
|
Steam |
1020 |
2250 |
<1 |
<0.00004 |
|
TiO2 |
106.7 |
42 |
|
Steam |
1820 |
4000 |
<1 |
<0.00004 |
|
MgO |
20.3 |
8 |
|
Air |
6.8 |
15 |
5 |
0.0002 |
|
Dolomite |
91.4 |
36 |
|
Steam |
1090 |
2400 |
<44 |
<0.0018 |
|
Fe2O3 |
76.2 |
30 |
|
Steam |
450 |
1000 |
|
2–3 |
0.0001 |
|
|
|
|
|
|
|
|
|
|
2 0 . 3 M E C H A N I C A L M I L L I N G ........................................................................................................................................... |
361 |
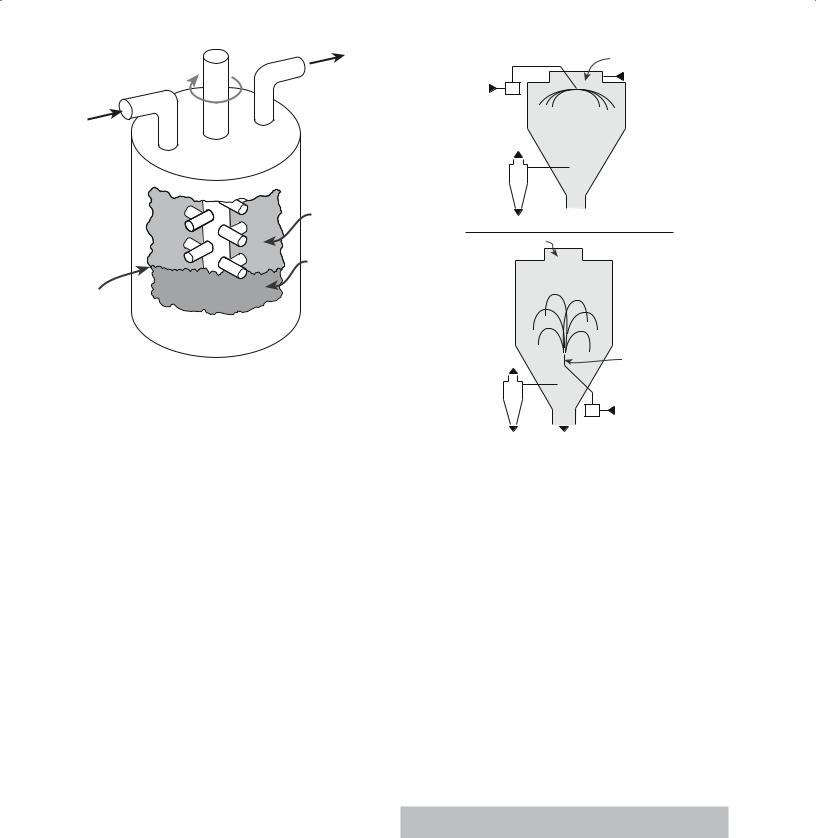
Controlled atmosphere
Powder
Grinding medium
Cutaway
FIGURE 20.2 An attrition mill.
Lining the chamber with a polymer or a ceramic and using ceramic stirrers and media can further reduce contamination.
|
Air disperser |
|
Drying |
Feed |
air |
Pump |
Rotary |
|
atomizer |
Exhaust |
Drying |
air |
chamber |
Cyclone |
|
(A)Product  Co-current
Air disperser
 Drying air
Drying chamber
Exhaust |
|
Nozzle |
|
atomizer |
|
air |
|
|
|
|
|
Cyclone |
|
|
|
|
Feed |
(B) |
|
Pump |
Product |
Mixed flow |
FIGURE 20.3 Spray dryers: (a) Centrifugal atomizer with cocurrent air flow. (b) Nozzle atomizer using mixed-flow conditions.
20.4 SPRAY DRYING
Spray drying is an example of powder production from solution. It is used widely for preparing ferrites, titanates, and other electrical ceramics. Fine droplets produced by an atomizer are sprayed into a drying chamber and the powder is collected (Figure 20.3). There are different types of atomizers. One uses ultrasonic atomization in which the solution is passed over a rapidly vibrating piezoelectric membrane. Droplet sizes in the range of 10 μm to over 100 μm can be produced.
In the drying chamber, the flow pattern of the hot air determines the completeness of moisture removal and the maximum temperature that the particles experience. Finally the particles are carried out of the chamber in the air stream and captured in a bag or another form of collector. The particles produced by spray drying are often agglomerated with a primary particle size less than 0.1 μm.
The variables in spray drying are
Droplet size
Solution concentration and composition
Temperature and flow pattern of the air in the drying chamber
Chamber design
For small-scale laboratory experiments nitrates and acetates are often used because of their relatively low
decomposition temperature. Chlorides and oxychlorides are frequently used in industrial spray-drying operations because of their high solubility in aqueous solutions. The capacities of industrial spray dryers are up to several hundred kilograms per hour. The spray drying process is not limited to aqueous solutions; for example, alcohol solutions of alkoxides can be used.
Table 20.4 lists examples of salt precursors and their decomposition temperatures. The decomposition of salts to oxides is an example of a solid-state reaction. These reactions are often referred to as calcination and are frequently governed by kinetics rather than thermodynamics. As a consequence, they may be carried out at temperatures much greater than those necessary based on thermodynamic calculations. A feature of the decomposition reactions is that they often result in the production of extremely fine particles.
TABLE 20.4 Salt Precursors and Their Decomposition
Temperatures in Air
Precursor |
T (°C) |
|
|
Zn(NO3) 6H2O |
360 |
Ni(NO3)2 6H2O |
400 |
Ni(CH3COO)2 4H2O |
350 |
Fe(NO3)3 9H2O |
200 |
MgSO4 |
1000 |
Y2(C2O4)3 5H2O |
500 |
|
|
362 ......................................................................................................... |
P O W D E R S , F I B E R S , P L A T E L E T S , A N D C O M P O S I T E S |

Evaporate |
Vapor |
Precipitate Dry Decompose Sinter |
||
|
|
|||
Solution |
diffusion |
|||
|
Dv |
|
||
Ds |
|
|
||
|
|
|
||
α1 |
αg |
|
Solution |
|
vapor |
Heat |
|||
|
Precipitate |
|||
transfer
FIGURE 20.4 Stages in the spray pyrolysis process.
A variation of the spray drying process, known as spray pyrolysis, uses a higher temperature and a reactive (often an oxidizing) environment in the chamber. This allows the salts to be dried and decomposed directly. Figure 20.4 shows the stages in the spray pyrolysis process. In addition to producing powders this technique has been used to produce thin films and fibers.
20.5 POWDERS BY SOL-GEL PROCESSING
Sol-gel processing is one of the topics we describe in Chapter 22. It is best applied to the formation of films and fibers. We discuss the technique here because, although expensive, it can produce powders with a high surface area, which allows sintering to nearly full density at much lower temperatures than are normally required when the particles have been made by other techniques.
In most sol-gel processes the reactants are solutions of metal alkoxy compounds. Alkoxides result from the reaction of metals (Me) with alcohols. The general reaction is
nROH + Me → (RO)nMe + (n/2)H2 (20.1)
where R is an organic group. For ethanol, R is the ethoxy group C2H5. Catalysts are often necessary to increase reaction rates. For example, aluminum will react with isopropanol at 80°C in the presence of a small amount of HgCl2. In this case the catalyst breaks down the protective oxide layer that forms on the aluminum.
A number of metal alkoxides are commercially available in high purity form. To make metal oxide powders from these organometallic precursors we start with a solution (a “sol”) of the metal alkoxide in alcohol. (The alcohol is usually the same one that was used for alkoxide formation.) Water is added to the alcohol solution. Two reactions then occur, which, using aluminum isopropoxide as an example, may be written as follows:
Reaction 1: Hydrolysis |
|
|
(C3H7O)2–Al–OC3H7 |
+ HOH → |
|
(C3H7O)2–Al–OH |
+ C3H7OH |
(20.2) |
Reaction 2: Condensation
(C3H7O)2–Al–OH + C3H7O–Al–(C3H7O)2 →
(C3H7O)2–Al–O–Me–(O C3H7)2 + C3H7OH (20.3)
The remaining alkoxy groups (–OR) of the condensation product can be hydrolyzed further to form a crosslinked, three-dimensional network of metal–oxygen bonds. The actual reactions that occur appear to be significantly more complex than those represented by Eqs. 20.2 and 20.3.
There are several variables in the sol-gel process:
Rates of hydrolysis and condensation (relative differences in the rates can be used to modify the microstructure of the powder)
Type of alkoxide (mixing of the alkoxides in the solution is achieved at a molecular level giving the powders a high degree of chemical homogeneity)
Reaction temperature (affects the degree of polymerization of the gel)
Amount of water added (affects the degree of polymerization of the gel)
Solution pH (rates of hydrolysis and condensation can be increased by the addition of acids or bases, respectively)
Gelation times vary from seconds to several days. When the gel forms it may contain only about 5 vol% of the oxide. The dried gel is calcined to completely convert it to oxide. Powders produced by the sol-gel method are amorphous. A crystallization step is required to produce crystalline bodies, which is often performed after sintering.
20.6 POWDERS BY PRECIPITATION
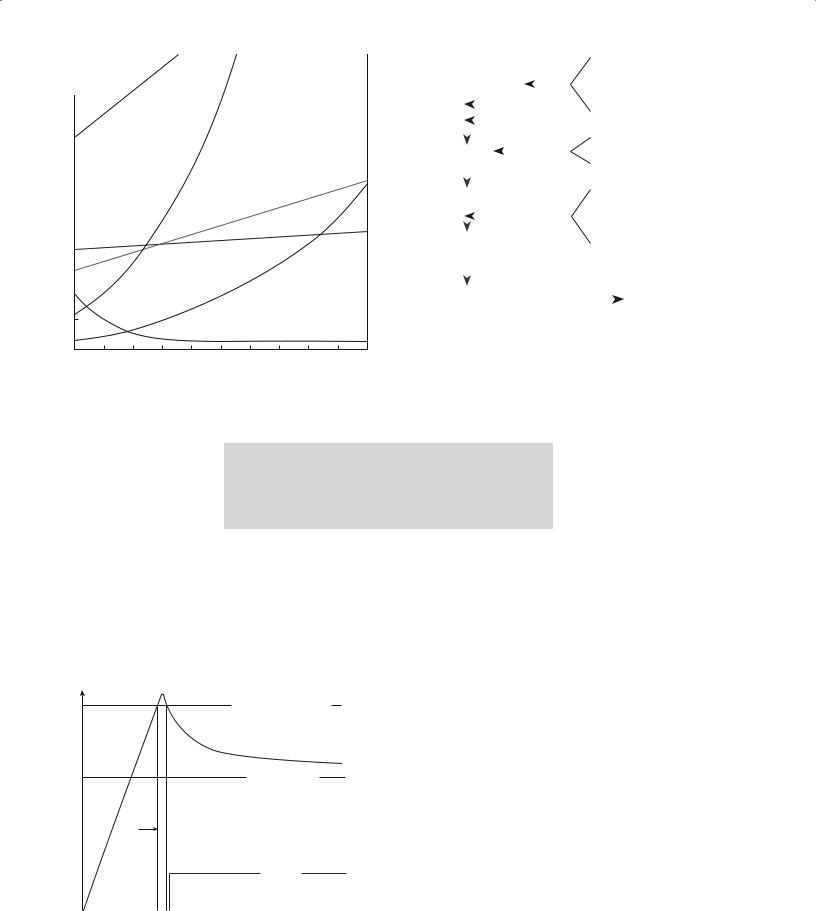
To cause precipitation it is necessary to produce a supersaturated solution. This can be achieved, for example, by changing the pH or the temperature. A larger quantity of a soluble component (for example, a metal salt) can be dissolved in a solution at high temperature than at a lower temperature. For example, not only does sugar dissolve more quickly in hot tea than in iced tea, but more sugar dissolves. The relation between solubility and temperature for several ionic compounds is shown in Figure 20.5. There are some exceptions to prove the rule: cerium sulfate is less soluble at higher temperatures because its heat of
solution is negative ( Hsol < 0).
At a supersaturation that exceeds the concentration threshold for homogeneous nucleation, a large number of nuclei form suddenly. Their formation lowers the solution concentration below the concentration at which nucleation occurs, but enough excess solute remains for the existing nuclei to grow. If the solution is kept uniform, growth of all the particles proceeds at the same rate, producing
2 0 . 6 P O W D E R S B Y P R E C I P I T A T I O N ................................................................................................................................. |
363 |
100 |
|
|
|
|
|
|
|
NaNO3 |
KNO3 |
||
Solubility |
|||||
|
|
||||
wt.% solute |
|
|
|||
in H2O) |
|
|
|||
80 |
|
|
|
|
|
|
|
|
|
||
60 |
|
|
|
KCl |
|
|
|
|
|||
|
|
|
|||
|
|
|
|
||
40 |
|
|
|
NaCl |
|
|
|
|
|||
|
|
|
|||
|
|
|
|
||
20 |
|
|
|
KClO3 |
|
|
|
|
|||
|
|
|
|||
|
|
|
|
||
Ce2(SO4)3
0
0 |
20 |
40 |
60 |
80 T (°C) 100 |
FIGURE 20.5 Solubility (grams of solute in 100 g H2O) versus temperature for several ionic compounds.
powders with extremely uniform size distribution. The variation of solute concentration with time during the nucleation and growth of particles from solution is shown in Figure
20.6. This diagram is often referred to as a LaMer diagram after the work of LaMer and Dinegar.
Precipitation of mixed oxides is possible. For example, in the fabrication of nickel ferrite (a magnetic ceramic used for memories) a mixed aqueous solution of iron and nickel sulfates is used. The solution is kept at about
Nucleation threshold
c
Solubility limit
 Nucleation burst
Growth
FIGURE 20.6 Concentration versus time for a solution in which the concentration is first increased to the point of nucleation (e.g., by evaporation) and then declines as a precipitate grows.
|
|
|
|
|
|
|
|
|
|
|
|
Ethylene Glycol |
|||
|
|
|
|
|
|
|
|
100°C |
|
|
|
|
|
||
“Ti Solution” |
|
Ti n-Butoxide |
|||||||||||||
|
|
|
|
||||||||||||
|
|
Stir |
|
||||||||||||
|
|
|
|
H2O |
|
|
|
|
|
|
|||||
|
|
|
|
|
Citric Acid |
||||||||||
|
|
|
|
HNO3 |
|
||||||||||
|
|
|
|
|
|
|
|
|
|||||||
|
|
|
|
|
|
Precipitate |
|
(NH4)2CO3 + H2O |
|||||||
|
|
|
|
|
|
|
|||||||||
SrCO3 |
|
|
|||||||||||||
|
|
|
|
|
|
|
|
|
|
|
|
||||
|
|
Wash, Filter |
|
|
|
|
|
||||||||
|
|
|
|
|
|
|
Sr (NO3)2 + H2O |
||||||||
|
|
|
|
|
|
|
|
|
|
|
|
||||
|
|
|
|
|
|
|
|
|
|
|
|
|
|
|
|
|
|
|
|
|
|
|
|
|
|
|
|
“Ti Solution” |
|||
“Sr, Ti Solution” |
|
|
|
||||||||||||
|
|
|
|
|
|
|
|
|
|
|
|
|
|
|
|
|
|
|
|
|
|
|
|
|
|
Sr (NO3)2 + H2O |
|||||
|
|
|
|
|
|
(Dopants) |
|
||||||||
|
|
|
|
|
|
|
|
|
|
|
|
|
|
|
|
Batch |
|
|
|
|
|
|
|
|
|
|
|
|
|||
|
|
|
|
|
|
|
|
H2WO4, H2O |
|||||||
Solution |
|
|
|
|
|||||||||||
|
|
|
|
|
|
|
|
|
|
|
|
NH4OH |
|||
|
Dry 150°C |
|
|
|
|
|
|||||||||
|
|
|
|
|
|
Char 250°C, Crush |
|
|
|
|
|||||
Glassy |
|
|
|
|
|
|
|||||||||
|
|
|
|
Powder |
|
||||||||||
Resin |
|
|
|
|
|
|
|
|
|
|
|
||||
|
|
Calcine 700°C |
|
|
|
||||||||||
|
|
|
|
|
|
||||||||||
|
|
|
|
|
|
|
|
|
|
||||||
|
|
|
|
|
|
|
|
|
|
|
|
|
|
|
|
FIGURE 20.7 Flow chart for preparing SrTiO3 powders by the Pechini method.
80°C and precipitation occurs when the pH is increased to around 11 with ammonium hydroxide. A mixed hydro-
xide |
precipitates, |
which |
is washed to remove the |
||
residual sulfate and |
dried |
|
to a powder with a particle |
||
size |
between 50 nm and |
|
1 μm. |
|
|
The Pechini method is a commercial process for the preparation of titanates and niobates for the capacitor
industry. With slight modifications, it is also referred to as the “citrate gel” process or the “amorphous citrate” process. Figure 20.7 shows a flow chart for the preparation of strontium titanate powder. Metal ions from starting materials such as carbonates, nitrates, and alkoxides are complexed in aqueous solution with α-carboxylic acids such as citric acid. When heated with a polyhydroxyl alcohol, such as ethylene glycol, polyesterification occurs. On removal of the excess liquid a transparent resin is formed. The resin is heated to decompose the organic constituents, ground to break up large agglomerates, and finally calcined. The powders produced are not as uniform as those from the sol-gel process: they often contain hard agglomerates.
20.7 CHEMICAL ROUTES TO NONOXIDE POWDERS
Many important engineering ceramics are nonoxides, e.g., Si3N4 and SiC. These often do not exist in nature or are rare and so must be produced synthetically. In Chapter 19 we described how nonoxide powders are obtained by solid-state reactions, such as between SiO2 and C to
364 ......................................................................................................... |
P O W D E R S , F I B E R S , P L A T E L E T S , A N D C O M P O S I T E S |
produce SiC. We also described direct nitridation processes, such as the reaction between Al and N2 to produce AlN. Now we are concerned with liquid-phase reactions that lead to the formation of nonoxides.
It is possible to produce submicron particles of α-Si3N4 by reacting silicon tetrachloride, a liquid at room temperature, and ammonia. The reaction involves the formation of silicon diimide [Si(NH)2] as an intermediate phase.
3Si(NH)2 → Si3N4 + 2NH3 |
(20.4) |
This process is used commercially by Ube Industries in Japan to produce Si3N4. The particle morphology is controlled by the calcination time and temperature:
Fine-grained equiaxed powders form at low temperatures
Needle-like and coarse-grained hexagonal particles form at temperatures >1500°C.
Another example of a liquid-phase reaction used to produce precursors for nonoxide powders involves reductive dechlorination of halide solutions. An example is the reaction between silicon tetrachloride, carbon tetrachloride, and sodium in heptane at 300°C:
SiCl4 + CCl4 + 8Na → “SiC” + 8NaCl (20.5)
The amorphous precursor can be crysyallized by heating between 1400 and 1800°C in 5% H2/Ar. This process has also been used to produce powders of TiB2 and B4C.
20.8 PLATELETS
Platelets are particles that are constrained in one dimension. They are commercially important because this is the shape of clay particles and mica. Another example of platelets previously encountered is SiC, which forms as flat hexagonal crystals by the Acheson process. An in situ process has been developed to produce platelet-reinforced- intermetallic composites. The reaction is
Mo2C + 5Si → 2MoSi2 + SiC |
(20.6) |
The SiC is in the form of platelets in an MoSi2 matrix.
20.9 NANOPOWDERS BY VAPOR-PHASE REACTIONS
Vapor phase processes are relatively expensive, but there are several good reasons for using them to prepare powders, particularly when we want
High purity
Discrete and nonaggregated particles
Nanoparticles with narrow size distributions
A |
Evaporation |
sources |
 Liquid N2
 Scraper
B
Gas
inlet
 Funnel
 To compactor
FIGURE 20.8 Schematic of a gas-condensation chamber for nanoparticle synthesis.
Versatility in producing powders of oxides and nonoxides
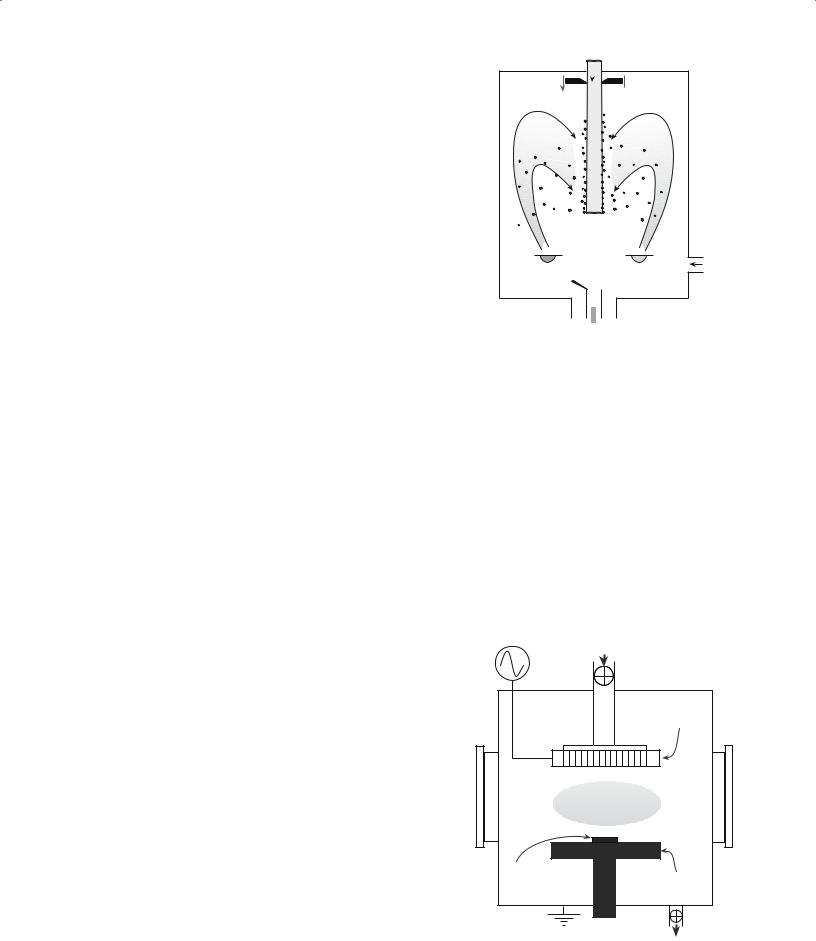
Figure 20.8 illustrates a gas-condensation chamber developed specifically for this purpose. Material is evaporated from the two sources and condenses in the gas phase. The condensate is transported by convection to the liquid nitrogen cold finger. The clusters are scraped from the cold finger and collected via a funnel. It is possible to have the particles transferred directly into a cold press where they can be compacted. With this technique ceramic powders with very small particle size have been produced, e.g., TiO2 powders with an average particle size of 10–15 nm.
Figure 20.9 shows a typical plasma reactor that can also be used to produce ceramic nanoparticles. The
RF power |
Gas inlet |
13.56 MHz |
|
RF showerhead electrode
Plasma
Substrate
Grounded
electrode
Vacuum
FIGURE 20.9 Schematic of a plasma reactor.
2 0 . 9 N A N O P O W D E R S B Y VA P O R - P H A S E R E A C T I O N S ...................................................................................................... |
365 |

TABLE 20.5 Summary of Particle Size Analysis Techniques |
|
|
|
|
||
Method |
Medium |
Size (mm) |
wt (g) |
t |
||
|
|
|
|
|
|
|
Light microscopy |
Liquid/gas |
400 |
– |
0.2 |
<1 |
S-L |
Electron microscopy |
Vacuum |
20 |
– |
0.002 |
<1 |
S-L |
Sieving |
Air |
8000 |
–37 |
50 |
M |
|
|
Air |
5000 |
–37 |
5–20 |
M |
|
|
Liquid |
5000 |
–5 |
5 |
L |
|
|
Inert gas |
5000 |
–20 |
5 |
M |
|
Gravity sedimentation |
Liquid |
100 |
– |
0.2 |
<5 |
M-L |
Centrifuge sedimentation |
Liquid |
100 |
– |
0.02 |
<1 |
M |
Electrical sensing zone |
Liquid |
400 |
– |
0.3 |
<1 |
S-M |
(Coulter counter) |
|
|
|
|
|
|
Fraunhofer scattering |
Liquid/gas |
1800 |
–1 |
<5 |
S |
|
Mie scattering |
Liquid |
1– |
0.1 |
<5 |
S |
|
Intensity fluctuation |
Liquid |
5 |
– |
0.005 |
<1 |
S |
X-ray line broadening |
Air |
<0.1 |
<1 |
S-M |
||
|
|
|
|
|
|
|
gaseous reactants are introduced into an argon plasma where they are decomposed into free atoms, ions, and electrons. Quenching of these highly excited species results in the formation of ultrafine powders with sizes typically less than 20 nm.
20.10 CHARACTERIZING POWDERS
There are several techniques that can be used to obtain particle size and particle size distribution and these are compared in Table 20.5. The choice of technique depends on several factors, such as applicable particle size range, sample size required, and the analysis time. In addition, we often have to consider instrument cost, availability, ease of operation, and maintenance.
Obtaining accurate and representative measurements of particle size is not trivial. Beyond selecting the right experimental method to use, you may have to perform a statistical analysis of the data to obtain meaningful results.
20.11 CHARACTERIZING POWDERS BY MICROSCOPY
The most direct way to determine the size of a particle is to look at it. We described the various microscopy techniques in some detail in Chapter 10. If the size of the particle is >1 μm, then visible light microscopy (VLM) is fine. Particle size measurements are made either directly at the microscope or from micrographs (photographs taken using the microscope). The main challenge is in determining the size of three-dimensional grains on the basis of planar images. Several procedures have been employed for making these measurements. The Heyn intercept method is one of the most useful approaches, and is ideally suited for nonequiaxed grains. The number of grain or grain boundary intersections of a straight or
curved line is measured and from this information the grain size is determined. It is possible to make these measurements by hand using a ruler, but it would take a long time to obtain a statistically relevant sample. Using imageanalysis methods on a computer a large number of particles can be measured quickly. The data are often then plotted as a histogram of frequency of occurrence versus particle size.
For submicron particles it is necessary to use an electron microscope. For scanning electron microscopy (SEM), and in particular transmission electron microscopy (TEM), the total amount of material that can be examined is quite small, and so it is essential to make sure that the sample examined is representative of the entire powder batch.
The digital readout on a TEM is not more than ±10% accurate. To obtain more accurate measurements you must first calibrate the magnification of the instrument.
20.12 SIEVING
Sieving is the oldest method to determine particle size distribution. Actually, sieving is used for sorting particles according to size rather than measuring their size. Typically, sieves with decreasing mesh size are stacked with the largest mesh at the top. The term “mesh size” denotes the number of openings per linear inch in the sieve screen. NBS (now NIST) developed the sieve numbering system based on the “fourth root of two” ratio; this series is known as the ASTM E-11 standard. This ratio (= 1.189) means that the sieve openings are an exact geometric series.
Table 20.6 lists the aperture (hole) size of standard sieves; this size corresponds closely to the ISO standard. As you can see sieving is not applicable to the smallest particle sizes (<5 μm), which are often used in the fabrication of components from advanced ceramics. But sieving is used in the traditional ceramics industry for size determination of raw materials. It is particularly suited for
366 ......................................................................................................... |
P O W D E R S , F I B E R S , P L A T E L E T S , A N D C O M P O S I T E S |

TABLE 20.6 Aperture Size of U.S. Standard Sieves
Sieve number |
Aperture (mm) |
Sieve number |
Aperture (mm) |
|
|
|
|
3.5 |
5,660 |
60 |
250 |
4 |
4,760 |
70 |
210 |
5 |
4,000 |
80 |
177 |
6 |
3,360 |
100 |
149 |
7 |
2,830 |
120 |
125 |
8 |
2,380 |
140 |
105 |
10 |
2,000 |
170 |
88 |
12 |
1,680 |
200 |
74 |
14 |
1,410 |
230 |
63 |
16 |
1,190 |
270 |
53 |
18 |
1,000 |
325 |
44 |
20 |
841 |
400 |
37 |
25 |
707 |
600 |
30 |
30 |
595 |
1,200 |
15 |
35 |
500 |
1,800 |
9 |
40 |
420 |
3,000 |
6 |
45 |
354 |
8,000 |
3 |
50 |
297 |
14,000 |
1 |
|
|
|
|
powders with particle size >56 μm. The particle size distribution obtained by sieving is normally only approximate because it is often too time consuming to sieve for long enough periods to achieve the final distribution of particles in the various sieves.
20.13 SEDIMENTATION
A spherical particle of diameter, d, falling through a viscous liquid, soon reaches a constant velocity, v, where its weight is balanced by a frictional force, F, exerted by the liquid as shown in Figure 20.10. Stokes’ law gives the important relationship between F and v:
 FUP
FUP
 FDOWN
FDOWN
FIGURE 20.10 Illustration of the force balance during settling of a particle in a Newtonian fluid with laminar flow.
F = 3πηdv |
(20.7) |
where η is the viscosity of the liquid. Equating F to the effective weight of the particle (i.e., the downward force) gives
v = d(ρs − ρl)g/18η |
(20.8) |
where g is the gravitational constant and ρs and ρl are the densities of the particle and the liquid, respectively. Equation 20.8 is Stokes’ equation from which we can determine d by measuring the sedimentation rate.
The sedimentation technique is reliable for particle size determination when d is in a size range of 2–50 μm. The falling rate of smaller particles is affected by Brownian motion resulting from collisions with the molecules of the liquid and other interactions between particles. Stokes’ law is valid only for laminar or streamline flow (i.e., when there is no turbulence). The Reynolds number (Re) is a measure of when the process transitions from turbulent to laminar flow:
Re = vρld/η |
(20.9) |
Laminar flow is restricted to Reynolds numbers of less than 0.2.
If there is a narrow distribution of particle sizes then sedimentation is experimentally very simple. A dilute suspension of the particles is shaken in a tall graduated cylinder. After a few seconds the suspension becomes stagnant and the particles start to settle at a constant (terminal) velocity. A clear layer of liquid forms at the top of the cylinder and grows as the particles continue to settle. The velocity of the downward movement of the interface between the clear liquid and suspension is v, which can readily be obtained using a stopwatch and the cylinder graduations.
The technique becomes more complicated if there is a distribution of particle sizes. In these cases it is more usual to measure the particle concentration at some point in the fluid. One way of doing this is by determining the turbidity of the fluid (i.e., its clarity). We use either light or X- rays and measure the intensity of the transmitted beam as the powder settles. The ratio of the intensity of the the transmitted beam, I, to that of the incident beam, I0, is given by the Beer–Lambert law:
I/I0 = exp(−KAcx) |
(20.10) |
where K is the extinction coefficient, A is the projected area per unit mass of particles, c is the concentration by mass of the particles, and x is the path length of the light through the suspension.
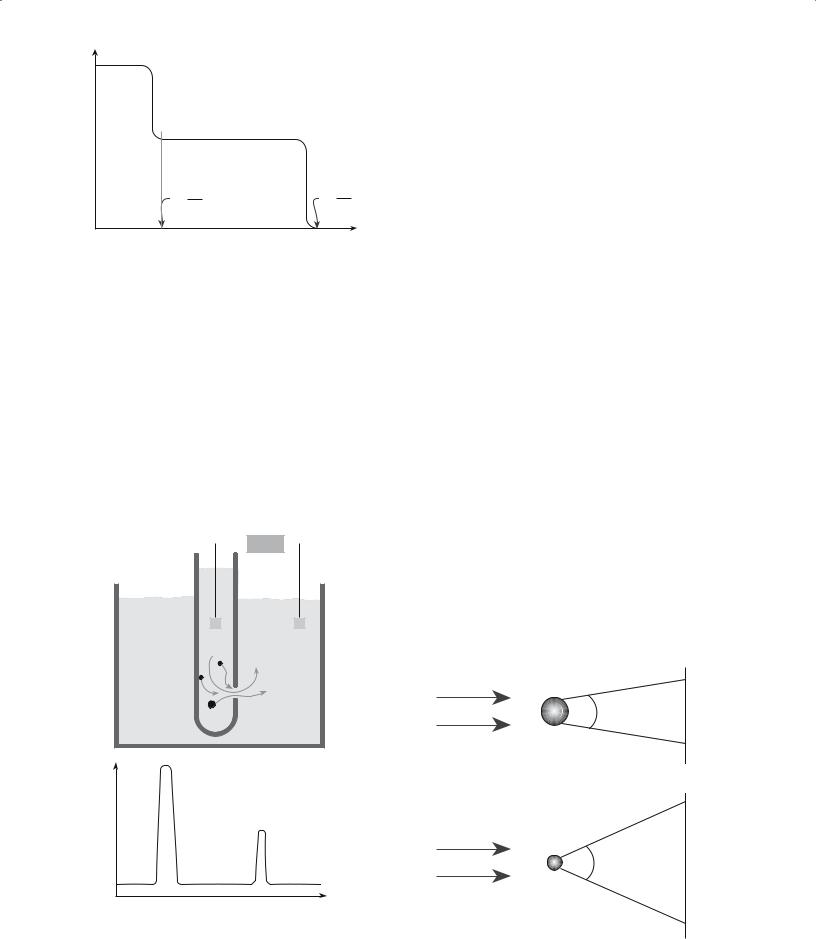
For a dilute suspension containing roughly equal amounts of two particle sizes, Figure 20.11 shows the way turbidity changes with time at a distance, L, below the top of the liquid. Turbidity is usually expressed in terms of nephelometric turbidity units (NTu). This is in reference to a specific type of measurement technique. A nephelometer specifically measures the light reflected into the detector by the particles.
2 0 .1 3 S E D I M E N T A T I O N .................................................................................................................................................... |
367 |
NTu |
|
|
|
Large |
Small |
|
|
particle |
particle |
||
t = |
L |
t = |
L |
Vt,l |
|
||
|
Vt,s |
||
|
|
t |
|
FIGURE 20.11 Result of sedimentation measurements using |
|
||
turbidity for two particle sizes in a solution; Vt is the terminal velocity.
The particle size can be determined from Stokes’ equation. Clearly, if the particle size distribution is broad, the interpretation of turbidity measurements is not simple! Turbidity measurements are widely used to assess water quality. In the United States the allowable turbidity in drinking water is 1 NTu. Many drinking water utilities try to achieve levels as low as 0.1 NTu.
20.14 THE COULTER COUNTER
The Coulter counter, shown in Figure 20.12a, measures the number and size of particles suspended in an electrolyte by causing them to flow through a narrow orifice on
 Meter
Meter 

 B
B
A Orifice
A
R
B
t
FIGURE 20.12 Results of Coulter counter measurements for two particle sizes A and B. R is the resistance between the electrodes, shown as shaded squares.
either side of which an electrode is immersed. As a particle passes through the orifice, it displaces an equivalent volume of electrolyte and causes a change in resistance, R. The magnitude of this change is proportional to the particle size.
The changes in R are converted to voltage pulses that are amplified, sized, and counted to produce data for the size distribution of the suspended particles. The peak height depends on the particle size as illustrated in Figure 20.12b. For peak A a larger particle passes through the orifice than for peak B. The peak width is a measure of how long it takes the particle to move through the orifice. The Coulter counter can measure particles in a size range 0.5–100 μm.
20.15 CHARACTERIZING POWDERS BY LIGHT SCATTERING
When a beam of light strikes a particle, some of it is transmitted, some is absorbed, and some is scattered. When the particles are larger than the wavelength of the incident light they cause Fraunhofer diffraction. The intensity of the forward-scattered light (i.e., light traveling in roughly the same direction as the incident light) is proportional to d2. Figure 20.13 shows examples of the light scattered from two particles of different sizes.
Smaller particles scatter a small amount of light through a large angle.
Large particles scatter a greater amount of light but through a smaller angle.
The relationship between scattering angle (θ) and d is
sin θ = 1.22λ/d |
(20.11) |
θ
Large Laser particle
beam Detector plane
θ
Small particle
Laser beam
FIGURE 20.13 Scattering of light by large and small particles.
368 ......................................................................................................... |
P O W D E R S , F I B E R S , P L A T E L E T S , A N D C O M P O S I T E S |