- •Module ііі. Physics of oscillations and waves. Optics
- •Study of stationary waves properties. Determination of frequency of string oscillations
- •Interference of light. Determination of lens curvature radius and light wavelength using Newton's rings
- •Table 4
- •Module IV. Quantum and atomic physics
- •Table 2
Module IV. Quantum and atomic physics
LABORATORY WORK
STUDY OF THERMAL RADIATION LAWS DETERMINATION OF STEFAN CONSTANT
The purpose of the work: - to study thermal radiation laws of perfectly black body; - to determine Stefan constant |
Devices and accessories:
|
Task 1. Thermoelectromotive force measurement
1.1. Enter the value of thermoelectromotive force at 100 С into table 1.
1.2. Repeat measurements for furnace temperatures 200, 300, 400, 500 and 600 С. Enter the results into table 1.
Table 1
Furnace temperature, t, С |
Environment temperature, t, С |
Absolute furnace temperature, T, К |
Thermoelectromotive, μV |
Furnace radiation power ,Wt |
Hole area, A m2 |
Stefan constant, σ, W/(m2 К4) |
|
15 |
|
|
|
7,85 · 10–5 |
|
|
|
|
|
|
||
|
|
|
|
|
||
|
|
|
|
|
||
|
|
|
|
|
||
|
|
|
|
|
1.3. Calculate the absolute furnace temperature as the sum of measured furnace temperature and environment. Enter the results into table 1.
Task 2. Stefan constant determination
2.1. Plot the graph on plotting paper using data from table 2.
Table 2
Thermoelectromotive force, μV |
Radiation power, W |
0,26 |
0,05 |
0,61 |
0,16 |
1,06 |
0,37 |
1,65 |
0,73 |
2,55 |
1,32 |
3,88 |
2,19 |

2.2. Determine furnace radiation power using graph. Enter the results into table 1.
2.3. Determine Stefan constant according to the formula:
![]()
Enter the results into table 1.
2.4. Determine deviation of measured value of Stefan constant from table 1:
![]() %
%
Task 3. Calculation of absolute and fractional errors of Stefan constant determination
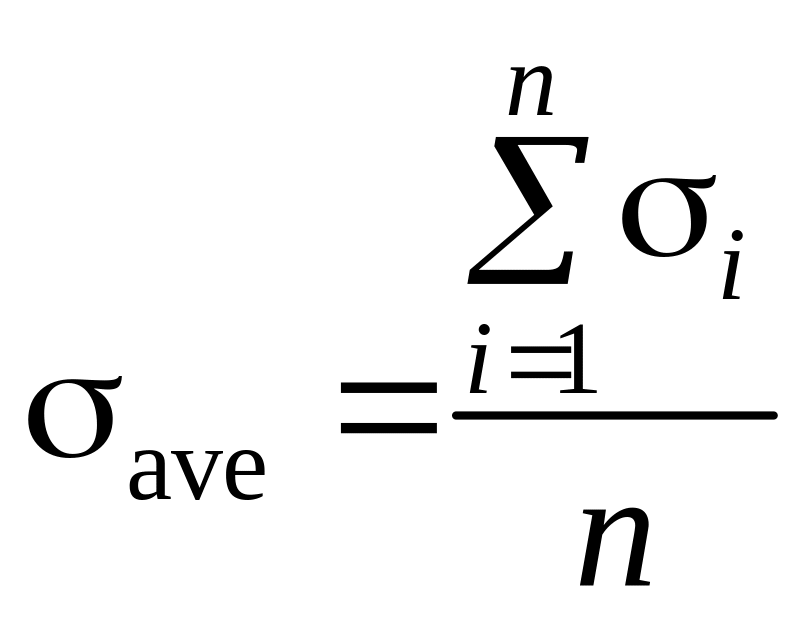
3.1. Calculate average value of Stefan constant:

where п = 6 is an amount of measurements.
3.2. Determine deviation of each value from average one:
![]()
Enter the results into table 3.
Table 3
Average value of Stefan constant |
Deviation from average value |
Root-mean square deviation |
Student’s
coefficient,
|
Absolute
error,
|
Fractional error, ε, % |
|
|
|
|
|
|
|
|||||
|
|||||
|
|||||
|
|||||
|
3.3. Determine root-mean-square deviations according to the formula:
 .
.
3.4. Calculate the absolute error:
![]()
where the Student’s
coefficient
![]() (α = 0,95 and n
= 6).
(α = 0,95 and n
= 6).
3.5. Calculate the fractional error:
![]() %
%
3.6. Write down the result in the following form:
![]() W / (m2 К4).
W / (m2 К4).
Task 4. Stefan law testing using graphical method
4.1. Calculate furnace radiant emittance using data from table 1 according to the formula:
![]() .
.
Enter the results into table 4.
Plot the graph of the function
 using data
from table 4.
Table 4
Furnace radiant emittance, E, W/m2 |
lgE |
|
|
Stefan constant, determined by the graph method, , W/(m2 К4) |
|
|
|
|
|
|
|
|
||
|
|
|
||
|
|
|
||
|
|
|
||
|
|
|
4.3. Calculate the inclination angle tangent
![]() of
the graph to the x-axis.
Make a conclusion about Stefan law
confirmation.
of
the graph to the x-axis.
Make a conclusion about Stefan law
confirmation.
4.4. Determine Stefan constant using plotted graph. Compare Stefan constant values obtained by analytical and graphical methods.
Conclusions
The data of laboratory work fulfilment
Pass mark Signature
Mark of laboratory work defence Signature
q uestions to be admitted for doing laboratory work and its defending
What type of radiation is called thermal radiation?
What is the peculiarity of thermal radiation?
How does spectral composition of thermal radiation depend on the body temperature?
Name energy characteristics of thermal radiation.
Formulate Kirchhoff law for thermal radiation.
What is a perfectly black body?
How can the model of a perfectly black body be given?
Draw and explain the graph of function f (λ, Т) for different temperatures of a body.
How does wavelength maximum value corresponding to perfectly black body at the increase of body temperature change?
Formulate thermal radiation laws for a perfectly black body.
What does «violet catastrophe» mean?
Formulate principles of the quantum theory of thermal radiation; formulate Planck hypothesis.
What is the principal difference between quantum theory of radiation and classical wave theory?
Write down Planck formula for thermal radiation.
What conclusions follow from Planck formula?
Explain the method of experimental determination of Stefan constant applied in this work.
How can Stefan law be checked up graphically?
LABORATORY WORK
STUDY OF PHOTOELECTRIC EXTERNAL EFFECT DETERMINATION of PLANCK’S CONSTANT by RETARDING FIELD METHOD
-
The purpose of the work:
- to study photoelectric external effect laws;
- to measure retarding field at different values of falling light frequency;
- to calculate Planck’s constant, electron work function, photoelctric threshold for given photocathode
Devices and accessories:
1. optical bench;
2. vacuum photosensitive device СЦВ-4;
3. source of light with changeable light filters;
4. direct current battery;
5. potentiometer;
6. switch;
7. digital devices Щ431З і Щ4316 for voltage and current measurement
Task 1. Measurement of stopping potential
1.1. Measure stopping potential at different values of falling light frequency. Enter the results into table 1. Table 1
Light filters color |
U, V |
0,00 |
0,05 |
0,10 |
0,15 |
0,20 |
0,25 |
0,30 |
0,35 |
0,40 |
0,45 |
0,50 |
0,55 |
0,60 |
0,65 |
Orange λ = __________m |
і, μА |
|
|
|
|
|
|
|
|
|
|
|
|
|
|
Yellow λ = _________ m |
і, μА |
|
|
|
|
|
|
|
|
|
|
|
|
|
|
Green λ = _________ m |
і, μА |
|
|
|
|
|
|
|
|
|
|
|
|
|
|
Blue λ = _________ m |
і, μА |
|
|
|
|
|
|
|
|
|
|
|
|
|
|
Violet λ = _________ m |
і, μА |
|
|
|
|
|
|
|
|
|
|
|
|
|
|
Task 2.
Plot graphs of functions
![]() for each light filter.
for each light filter.
Task 3.
Determine stopping potential
![]() for each light filter by extrapolation of straight line part of the
graph to the its intersection with axis ОX.
for each light filter by extrapolation of straight line part of the
graph to the its intersection with axis ОX.
Task 4.
Plot the graph of function
![]() .
.
Task 5. Planck’s constant determination
5.1. Determine Planck’s constant using the graph of function and according to the formula:
![]() where
where ![]()
5.2. Enter the results into table 2.
5.3. Determine deviation of measured value of Planck’s constant from theoretical one:
![]()
Table 2
Light filter color |
, Hz |
|
Planck’s constant, h, J∙s |
Deviation of measured value from theoretical one |
Work
function,
|
Photoelectric
threshold
|
Orange |
|
|
|
|
|
|
Yellow |
|
|
||||
Green |
|
|
||||
Blue |
|
|
||||
Violet |
|
|
Task 6.
Determine work function
![]() and photoelectric threshold
and photoelectric threshold![]() for
given photocathode using graph of function
and formulae:
for
given photocathode using graph of function
and formulae:
![]()
![]() .
.
Enter the results into table 2.
Task 7.
Determine photoelectric threshold
for
elements with known work function and
plotted graph
![]() Enter the results into table 3.
Enter the results into table 3.
Table 3
Element |
|
|
Element |
еV |
, Hz |
Caesium |
1,9 |
|
Potassium |
2,2 |
|
Natrium (sodium) |
2,3 |
|
Calcium |
2,7 |
|
Conclusions
The data of laboratory work fulfilment
Pass mark Signature
M ark
of laboratory work defence
Signature
questions to be admitted for doing laboratory work and its defending
What is photoelectric effect?
What types of photoeffect do you know?
What regularities of photoeffect do you know?
What is the essence of photo-electric effect theory?
Write down Einstein’s equation for photoeffect and explain it.
Formulate external photoelectric effect laws.
What is the essence of quantum theory of light?
What is photon? Write down its characteristics.
What is electron work function?
What is stopping potential?
What does stopping potential depend on?
What is photoelectric threshold?
What does photoelectric threshold depend on?
Application of photo-electric effect in science and technique.
Structure and operation principle of photocell. Integral and spectral sensitiveness of photoeffect.
What do energy and speed of electron flown out from photocathode depend on?
LABORATORY WORK
STUDY OF HYDROGEN ATOM SPECTRUM RYDBERG’S CONSTANT DETERMINATION
The purpose of the work: - to determine wavelengths of hydrogen atom visible spectrum; - to calculate Rydberg’s constant; - to determine energy and mechanical characteristics of hydrogen atom |
Devices and accessories: 1. spectroscope; 2. discharge tube; 3. current source |
Task 1. Monochromator calibration graph drawing
1.1. Obtain readings of monochromator drum for all wavelength of krypton atom. Enter the results into table 1.
Table 1
Spectrum line color |
Theoretical values of wavelengths |
Drum reading |
|
|
λ, m |
||
Bright red |
|
|
|
Orange |
|
|
|
Yellow-orange |
|
|
|
Yellow |
|
|
|
Green |
|
|
|
Blue |
|
|
|
Blue |
|
|
|
Violet |
|
|
|
Violet |
|
|
|
Violet |
|
|
|
Draw calibration graph using plotting paper.
Task 2. Determination of wavelengths of hydrogen atom visible spectrum lines
2.1. Determine positions of red, blue, dark blue and violet lines of hydrogen atom using drum scale.
2.2. Determine wavelengths of hydrogen atom visible spectrum lines Нα, Нβ, Нγ, Нδ using monochromator calibration graph. Enter the results into table 2
Table 2
Color of Spectrum line |
Line symbol |
Drum reading |
Spectrum line wavelength determined by graphical method, λ, m |
Rydberg’s constant, R¥, m–1 |
Average value of Rydberg’s constant, R¥ave, m–1 |
Absolute error, DR¥ ,m–1 |
Fractional error, e, % |
Red |
H |
|
|
|
|
|
|
Blue |
H |
|
|
|
|||
Dark blue |
H |
|
|
|
|||
Violet |
H |
|
|
|
Task 3. Rydberg’s constant determination
3.1. Calculate Rydberg’s constant according to the formula:
![]() ,
,
where n = 2; k = 3, 4, 5, 6.
3.2. Rydberg’s constant measurement error calculation.
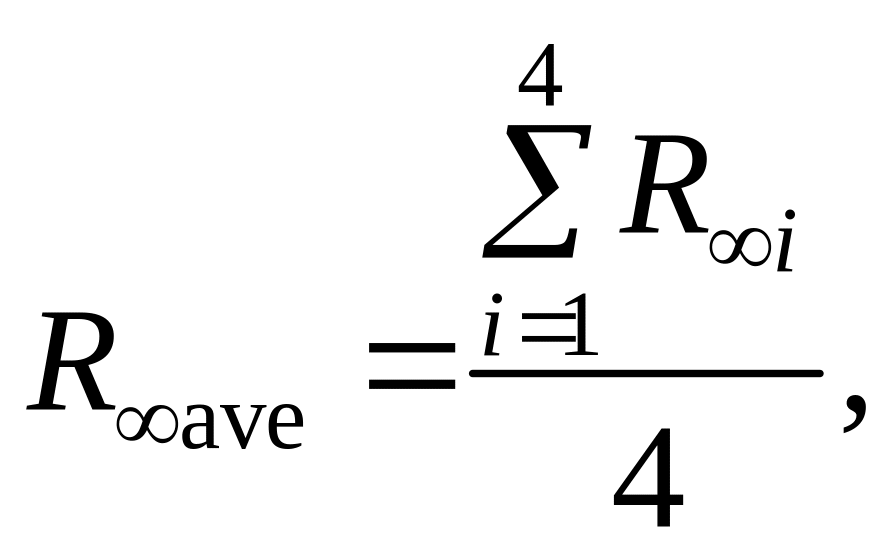
— Determine average value:

— Calculate deviation of each value from average one:
![]()
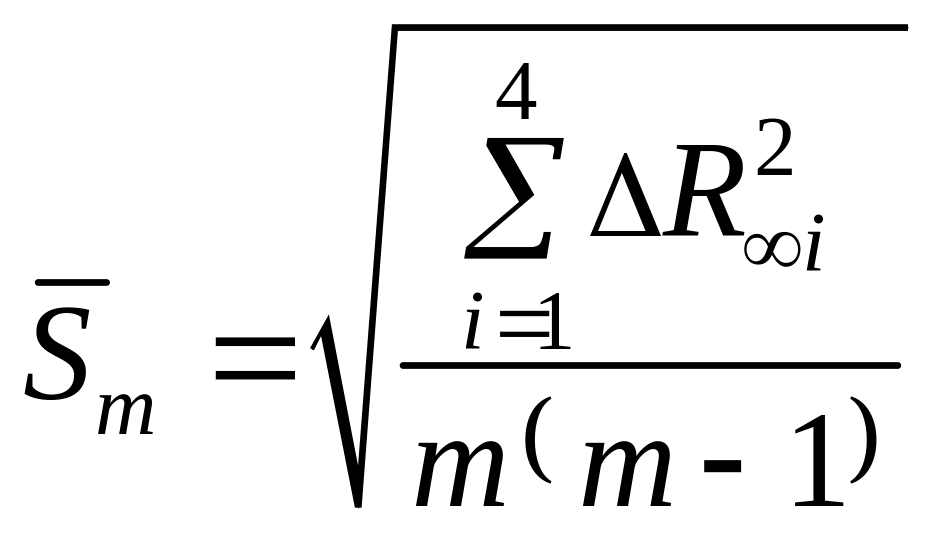
— Calculate root-mean-square deviation from average value:

where т = 4.
— Calculate the absolute error of Rydberg’s constant measurement:
![]()
where
![]() (т
= 4 and
(т
= 4 and![]() ).
).
— Calculate the fractional error of Rydberg’s constant measurement according to the formula:
![]() .
.
— Write down the result in the following form:
![]() m–1,
m–1,
Enter the results into table 2.
Task 4. Determination of energy and mechanical characteristics of hydrogen atom. Enter the results into table 3.
Table 3
Prinsipal quantum number, n |
Total energy Еп, J |
Radius of electron orbit rп, m |
Photon energy of Balmer’s series, , J |
Ionization energy Eion, еV |
|||
k = 3 |
k = 4 |
k = 5 |
k = 6 |
||||
n = 1 |
|
|
|
|
|
|
|
n = 2 |
|
|
|
|
|
|
|
n = 3 |
|
|
|
|
|
|
|
n = 4 |
|
|
|
|
|
|
|
Conclusions
The data of laboratory work fulfilment
Pass mark Signature
Mark of laboratory work defence Signature
q uestions to be admitted for doing laboratory work and its defending
What is linear spectrum?
Formulate Bohr’s postulates.
Name spectral series in hydrogen atom radiation spectrum.
Deduce formula for electron orbits radius determination in hydrogen atom.
Deduce formula for determination of electron total energy in hydrogen atom.
Deduce Balmer’s serial formula using Bohr’s theory.
Draw energy levels scheme of hydrogen atom. Explain it.
Write down Schrodinger’s equation. Explain the essence of ψ-function.
What quantum numbers do you know? What is their physical essence?
What is electron state? How is electron state denoted?
Formulate the selection rule for orbital quantum number.
Draw the quantum scheme formation of hydrogen atom radiation series.
What is spectroscope calibration graph? How is spectroscope calibration graph drawn? How is it used?
L ABORATORY WORK
STUDY OF TEMPERATURE DEPENDENCE OF METAL AND SEMICONDUCTOR RESISTANCE
-
The purpose of the work:
to determine the temperature coefficient of resistance of metal resistor and forbidden bands width of a semiconductor
Devices and accessories:
installation ФПК-07
Task 1. Copper resistor resistance determination
Measure metal resistance at room temperature.
Measure resistor resistance with the step of 10 С. Enter the results into table 1.
Table 1
Temperature t, C |
20 |
30 |
40 |
50 |
60 |
70 |
80 |
90 |
100 |
Temperature Т, К |
|
|
|
|
|
|
|
|
|
Metal resistance R, Ω |
|
|
|
|
|
|
|
|
|
Metal resistance temperature coefficient , 1/Т |
|
||||||||
Task 2. Determination of resistance temperature coefficient
2.1. Draw
the graph of metal resistance upon temperature dependence
![]() using data from table 1.
using data from table 1.
2.2. Determine tangent of the graph inclination angle to the x-axis:
![]() =
___________.
=
___________.
Value determines metal resistance temperature coefficient.
Task 3. Determination of semiconductor forbidden band width
Measure semiconductor resistance at room temperature.
Measure resistance with the step of 10 С. Enter the results into table 2.
